A number of people have observed that there has been an excess of non-Covid deaths in the last ten weeks, e.g., Will Jones and John Campbell. Whether this means anything or is just a statistical variation I don’t know. There have been periods of such excess deaths over expectation in the past, as well as periods of fewer deaths than expected. Jones notes an apparent correlation of the latest occurrence with the 2022 spring booster programme for the over-75s.
Here I report some observations using a different dataset which purports to disaggregate deaths in the vaccinated and unvaccinated. I first made similar observations in January but was reticent about posting because of the known problems with the ONS datasets employed. I do so now with a huge warning. I conclude only that there is something here to keep watching (as if you didn’t know!).
Analysis of Mortality Data by Covid-19 Vaccination Status (England): Data for 1st January 2021 to 31st May 2022
Dataset: Excel file “Deaths occurring between 1 January 2021 and 31 May 2022 edition of this dataset” (UK Office for National Statistics, release 6 July 2022) obtainable from web page “Deaths by vaccination status, England”. Be aware that this web page will also contain links to earlier datasets (and probably, in due course, to later ones). This series of ONS datasets is known to have some major problems – see Appendix A, below. It is not clear if these problems fatally undermine the results given here. The use here of ratios of death rates may save the results from the worst issues, but this is not clear. Make of the analysis what you will bearing those problems in mind.
Method: Results are presented as the ratio of death rates of vaccinated people to that of unvaccinated people. I concentrate on non-Covid deaths and all-cause deaths.
It is essential to disaggregate by age as both Covid and Non-Covid death rates are extremely sensitive to age. Consequently, I use Table 6 of the dataset as this gives data with the finest granularity by age (namely 5 year age bands). I do not disaggregate by sex in this analysis, and the dataset does not provide breakdowns by any other demographic variables.
The ONS Excel file primarily presents age standardised death rates. However, Table 6 of the dataset gives only death counts and person-years, so I have used unstandardised death rates throughout (defined as the ratio of the number of deaths to the listed person-years). Death rates are per 100,000 person years.
95% confidence upper and lower bounds have been estimated as defined in Appendix B.
Figure 1 plots the death rate for people “ever vaccinated” (i.e., at any time following one, two or three doses) divided by the death rate for the unvaccinated. The best estimate and upper bounds of this ratio are plotted for both non-Covid and all-cause deaths. Subject to the issues with this dataset (Appendix A), this ostensibly suggests a net benefit of vaccination for those over 25.
However, there is a serious question-mark over whether the vaccinated and unvaccinated populations are equivalent (other than vaccination status). A sample bias in the unvaccinated towards generally poorer health would invalidate this interpretation.
More importantly, these data do not provide a statistically significant case for a net benefit of vaccination for the under-25s. For the under-20s the best estimate is a net disbenefit of vaccination as regards mortality risk.
Looking at longer term effects evident in this dataset is more concerning.
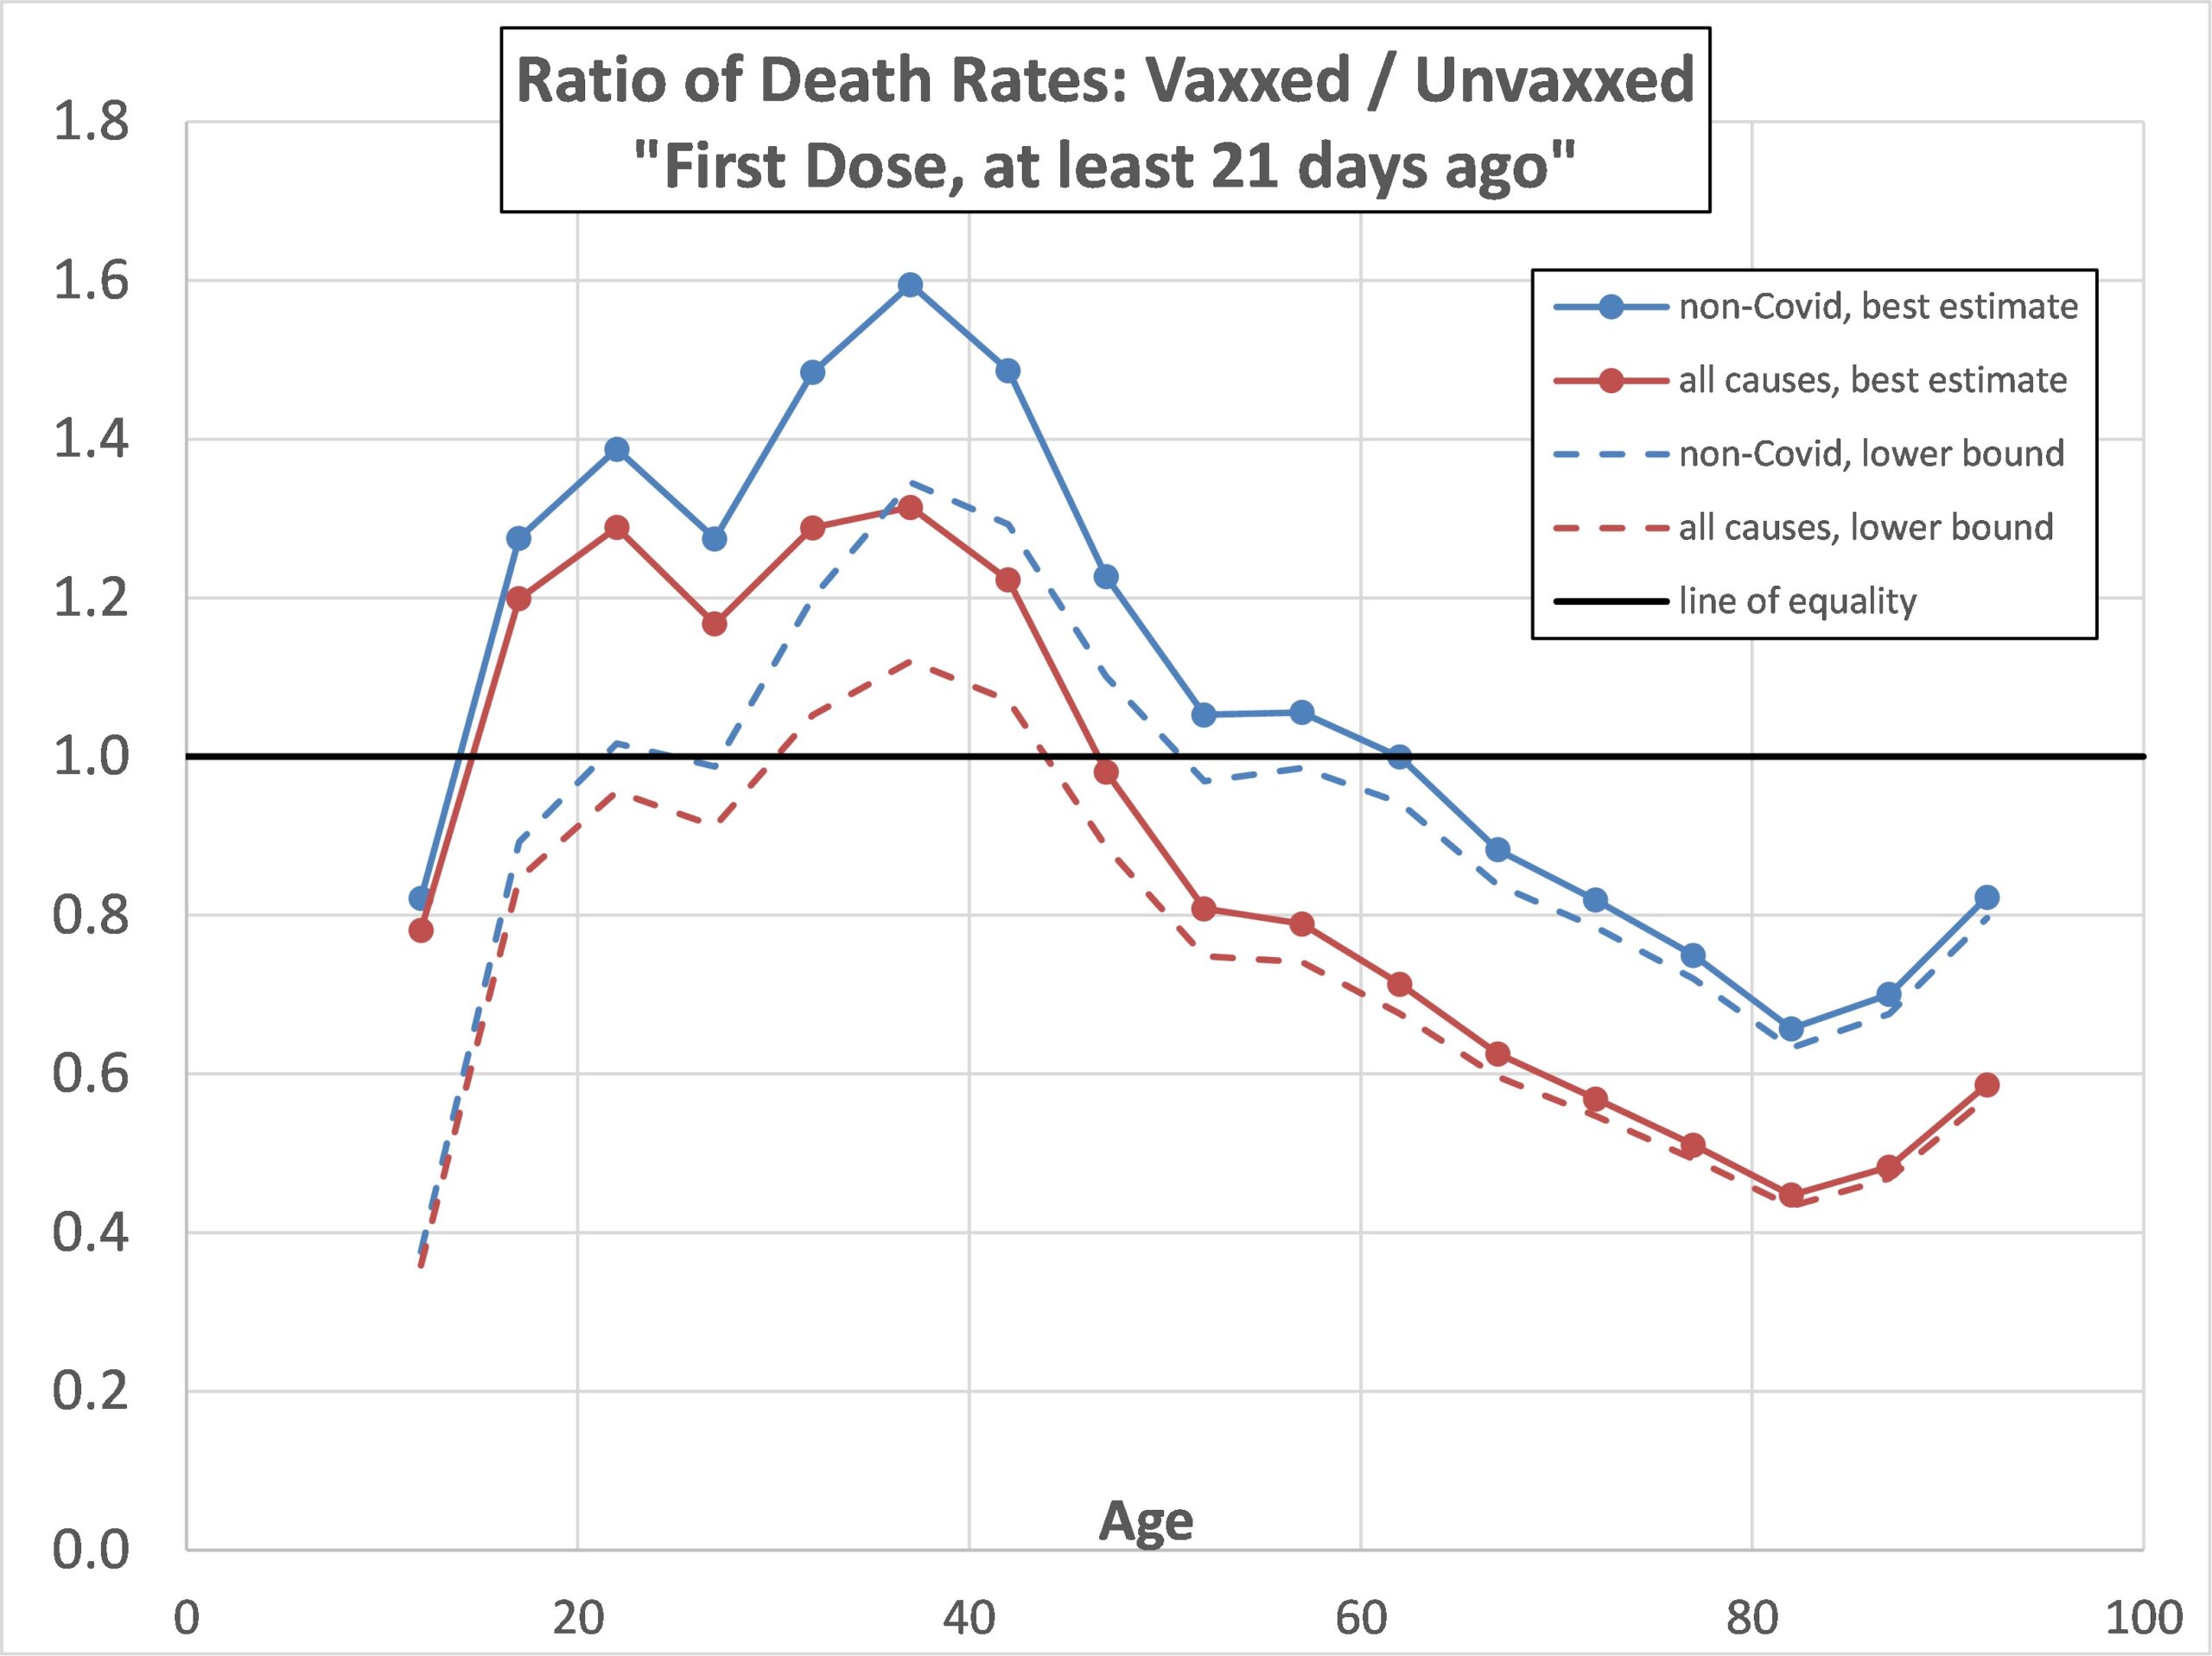
Figure 2 plots the death rate for people who had just one vaccination dose, and that over 21 days previously, divided by the death rate for the unvaccinated. The best estimate and lower bounds of this ratio are plotted for both non-Covid and all-cause deaths. This suggests a net disbenefit of vaccination (i.e., an elevated all-cause death rate) for people in an age range from mid-teens to mid-40s. Moreover, the lower bound line suggests this is statistically significant in the age range 30 to mid-40s.
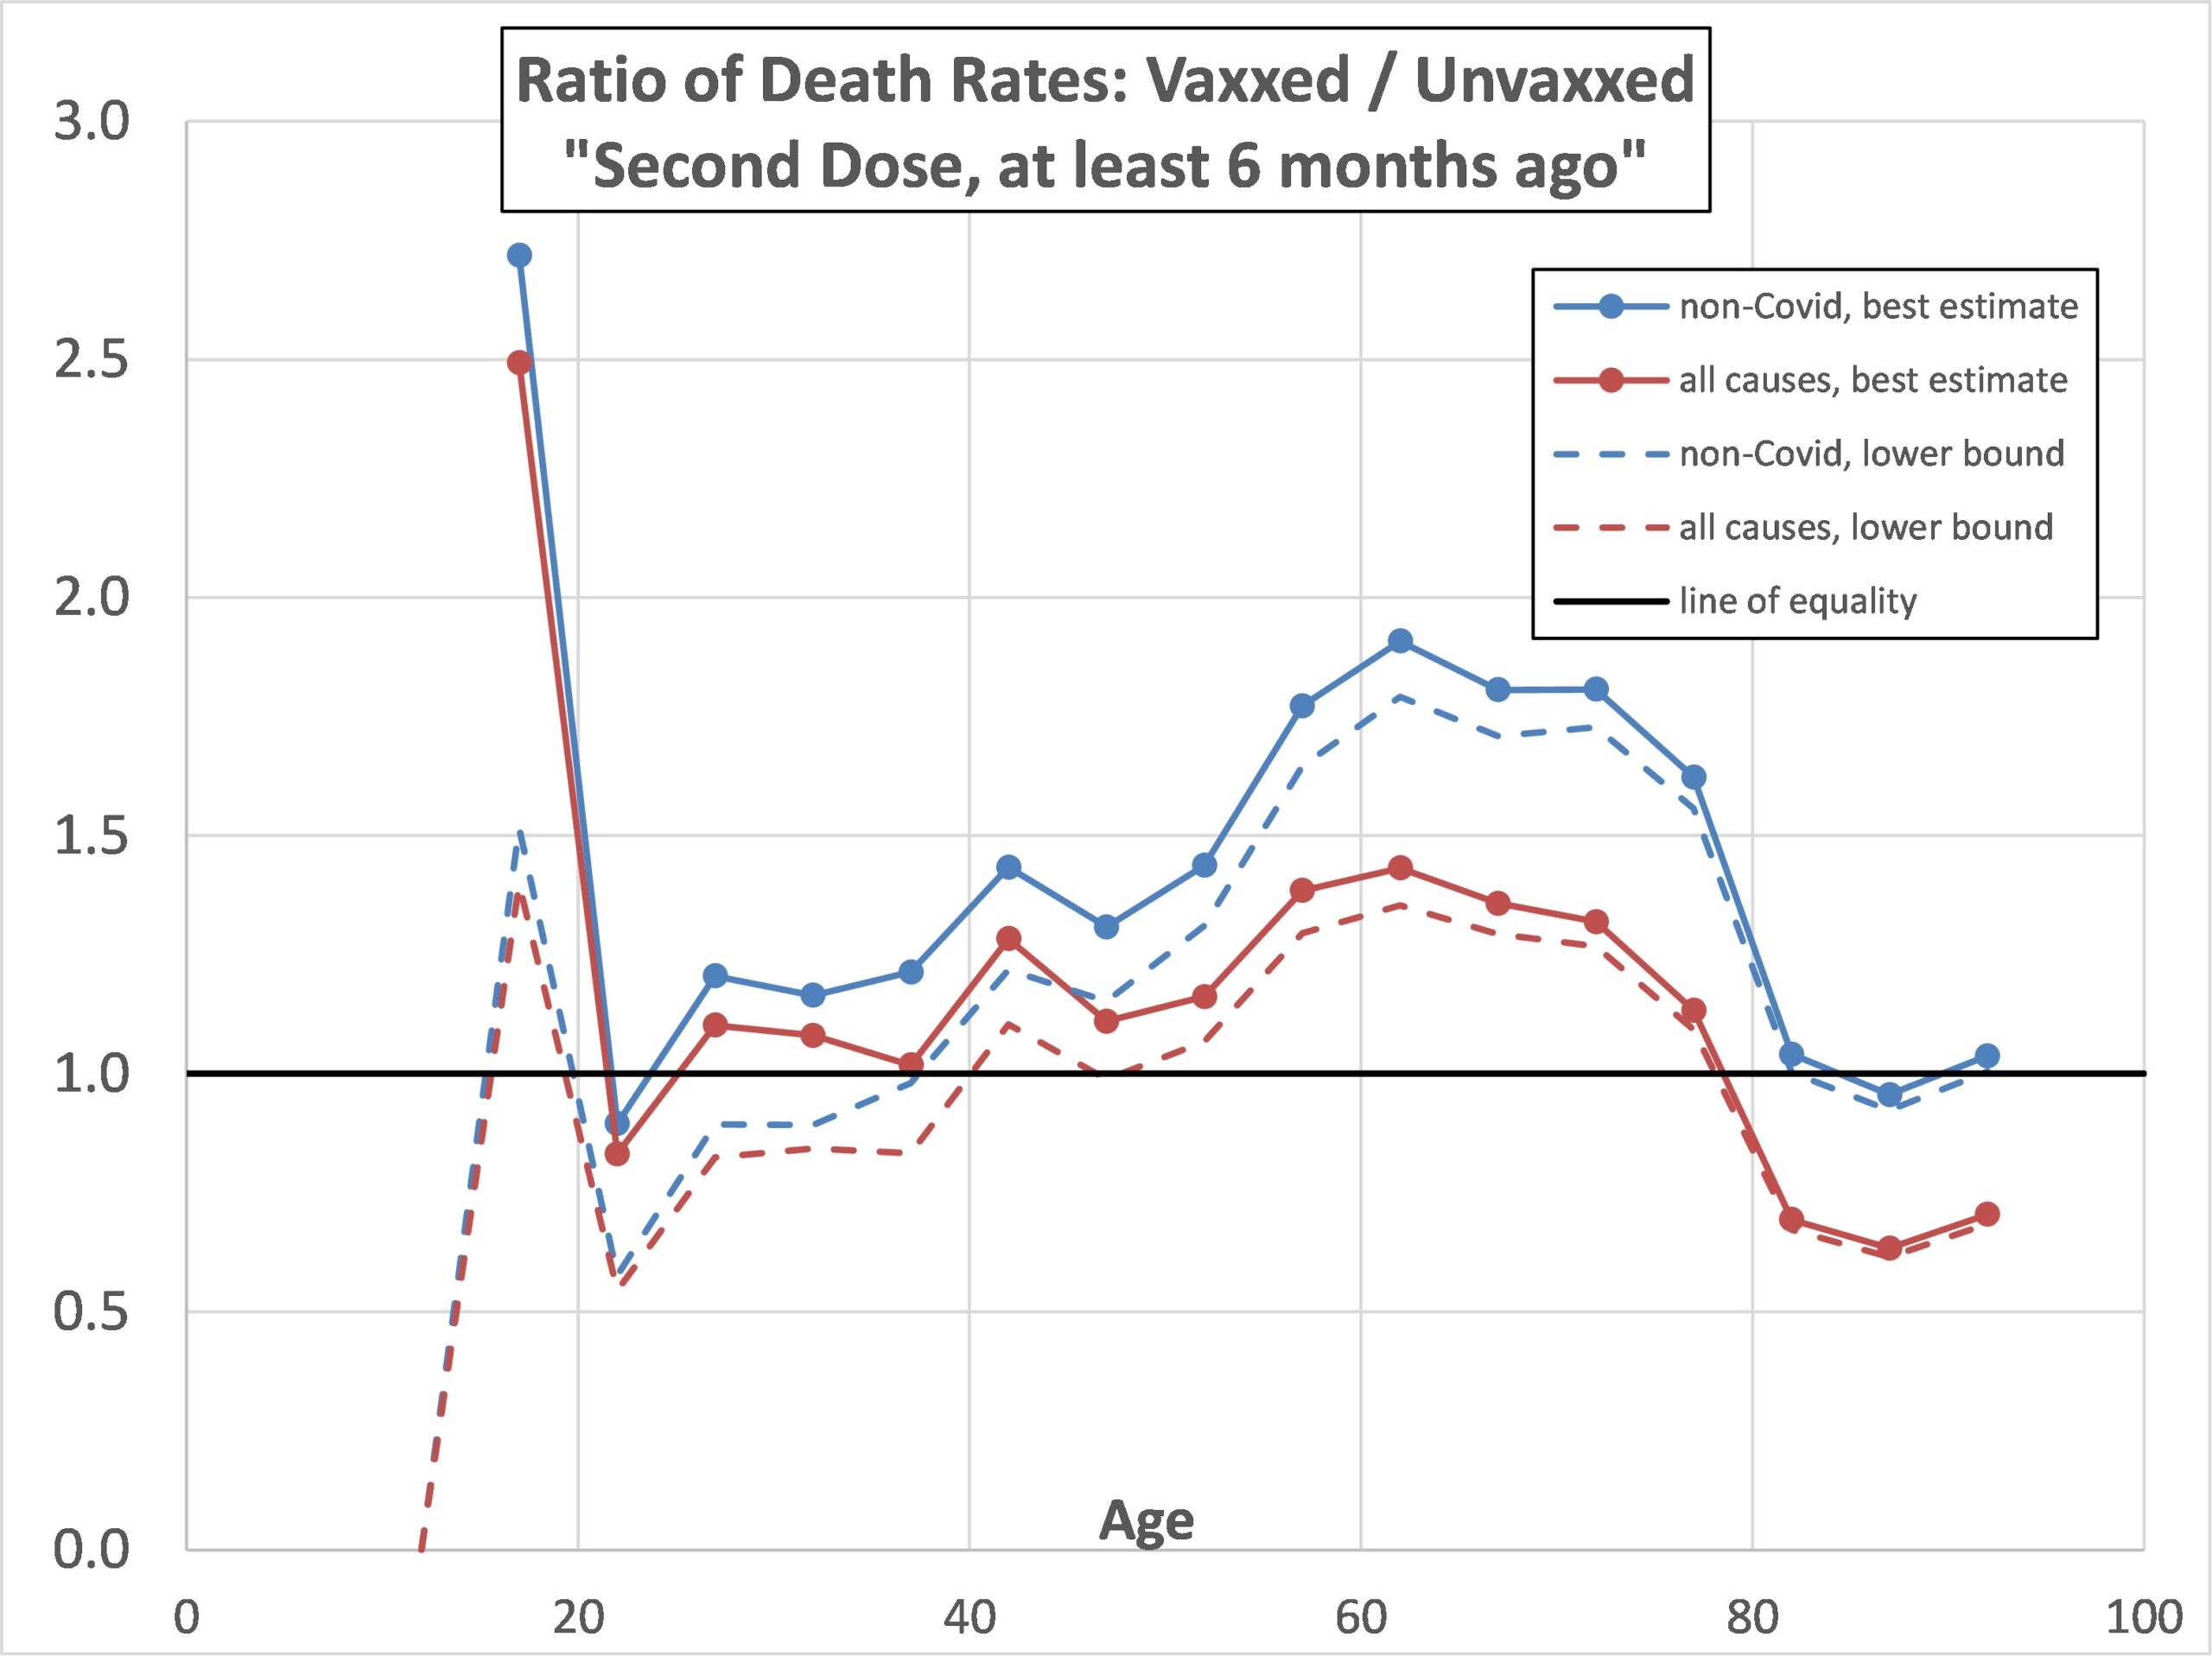
Figure 3 plots the death rate for people who had two vaccination doses over 6 months ago divided by the death rate for the unvaccinated. The best estimate and lower bounds of this ratio are plotted for both non-Covid and all-cause deaths. The best estimate of this ratio is mostly above 1 at all ages below 80, suggesting there might be a longer-term elevation in death rate following double vaccination. Moreover, the lower bound all-cause line shows this is a statistically significant finding in the age range 40 to 80.

Conclusions
It is not clear whether the problems with these datasets, as discussed in Appendix A, undermine any claims made based upon them. If so, then the implicit claims of vaccine efficacy made in, for example, Deaths involving COVID-19 by vaccination status, England – Office for National Statistics, and broadly exemplified by Figure 1, above, are themselves undermined.
On the other hand, if reliance can be placed on conclusions based on these datasets, then Figures 2 and 3, above, are rather disconcerting regarding apparently raised death rates among the vaccinated population in the longer term.
Any longer term adverse effects of vaccination are potentially of greater concern than acute short-term effects if they persist over the very long term, i.e., years, as the accumulated fatalities could be far greater. On the other hand it is not clear if the apparent enhanced death rates in the vaccinated population will persist as more data accumulates. All the present post demonstrates is that there is something here to be watched.
Appendix A: Problems with this Sequence of ONS Datasets
Earlier ONS datasets in the sequence “Deaths by vaccination status, England” have come in for severe criticism, notably from Martin Neil, Clare Craig, Norman Fenton and others of Fenton’s lab, including “Official mortality data for England suggest systematic miscategorisation of vaccine status and uncertain effectiveness of Covid-19 vaccination” (January 2022) and “Official mortality data for England reveal systematic undercounting of deaths occurring within first two weeks of Covid-19 vaccination” (March 2022). As far as I am aware neither of these preprints have been peer reviewed and journal published as of 18 July 2022.
The latter reference provides evidence that data from the first two weeks after vaccination have been omitted from these datasets. Providing this is done consistently for both vaccinated and unvaccinated people, this might not matter too much as long as the data marked as “first 21 days” are reinterpreted as “in the third week”. However, it does mean any fatalities in the first two weeks are omitted, which makes the dataset useless for identifying short-term, acute vaccine reactions leading to death.
Another generic problem with these ONS datasets is that their data is based only on a subset of the English population. Neil et al state the situation thus,
“Of most concern are the very different estimates provided by UKHSA (United Kingdom Health Security Agency) and the ONS (Office for National Statistics) of the number of vaccinated and unvaccinated people. The reports from UKHSA use estimates from the NIMS (National Immunisation Management Service) database, while the estimates from the ONS are based on 2011 census respondents and patients registered with a GP in 2019. Hence the ONS England population (which therefore includes only people aged at least 10) is only approximately 39 million, compared to the approximately 49 million listed in NIMS.”
Again this might not matter too much provided that the restricted sample remained representative of the whole population (and provided death counts are not misinterpreted as applying to the whole nation, but rather death rates per 100,000 only are used). However, there is an obvious concern about sample bias: those people not within the 2011 census or who did not registered with a GP in 2019 might have a different health profile. In particular there might be a concern over the representation of younger people, and, of course, immigrants over the last 10 years will have been excluded. Nevertheless, one might still hope that, provided only the ratio of vaccinated to unvaccinated death rates are used that this should remain indicative.
However, the first of the above Neil et al papers casts doubt even on this if the vaccine status of individuals has commonly been misidentified.
The ONS include a warning regarding naïve interpretation of the data in terms of vaccine efficacy,
“The ASMRs (Age Standardised Mortality Rates) are not equivalent to vaccine effectiveness and both the non-COVID-19 and COVID-19 ASMRs can be affected by various factors other than vaccination status, such as health status and changes in mortality rates over the year. We are undertaking further analysis to understand the relative impact of these effects.”
However, this exclusion clause comes after several bullet points which implicitly make claims relating to vaccine effectiveness based on the data, and hence seems somewhat disingenuous.
I have previously compared the overall death rates for 2021 from dataset “Age-standardised mortality rates for deaths by vaccination status, England: deaths occurring between 1 January 2021 and 31 January 2022” on page “Deaths by vaccination status, England” with an alternative source of the total death rates (by age) for that year, namely Deaths registered weekly in England and Wales, provisional – Office for National Statistics (ons.gov.uk). The comparison is shown in Figure 4 (where “this dataset” means that from “Deaths by vaccination status, England”). On a logarithmic scale the two look to be in reasonable agreement – but that belies the fact that, at younger ages, the “Deaths by vaccination status, England” data seriously underestimates the death rates. (Note that Figure 4 relates to any vaccine status, including unvaccinated).
Under age 45 the “Deaths by vaccination status, England” data appears to under-report death rates by between 40% and 80%. Above age 65 the two sources of total death rate are in pretty good agreement.

Appendix B: Evaluation of the 95% Confidence Bounds
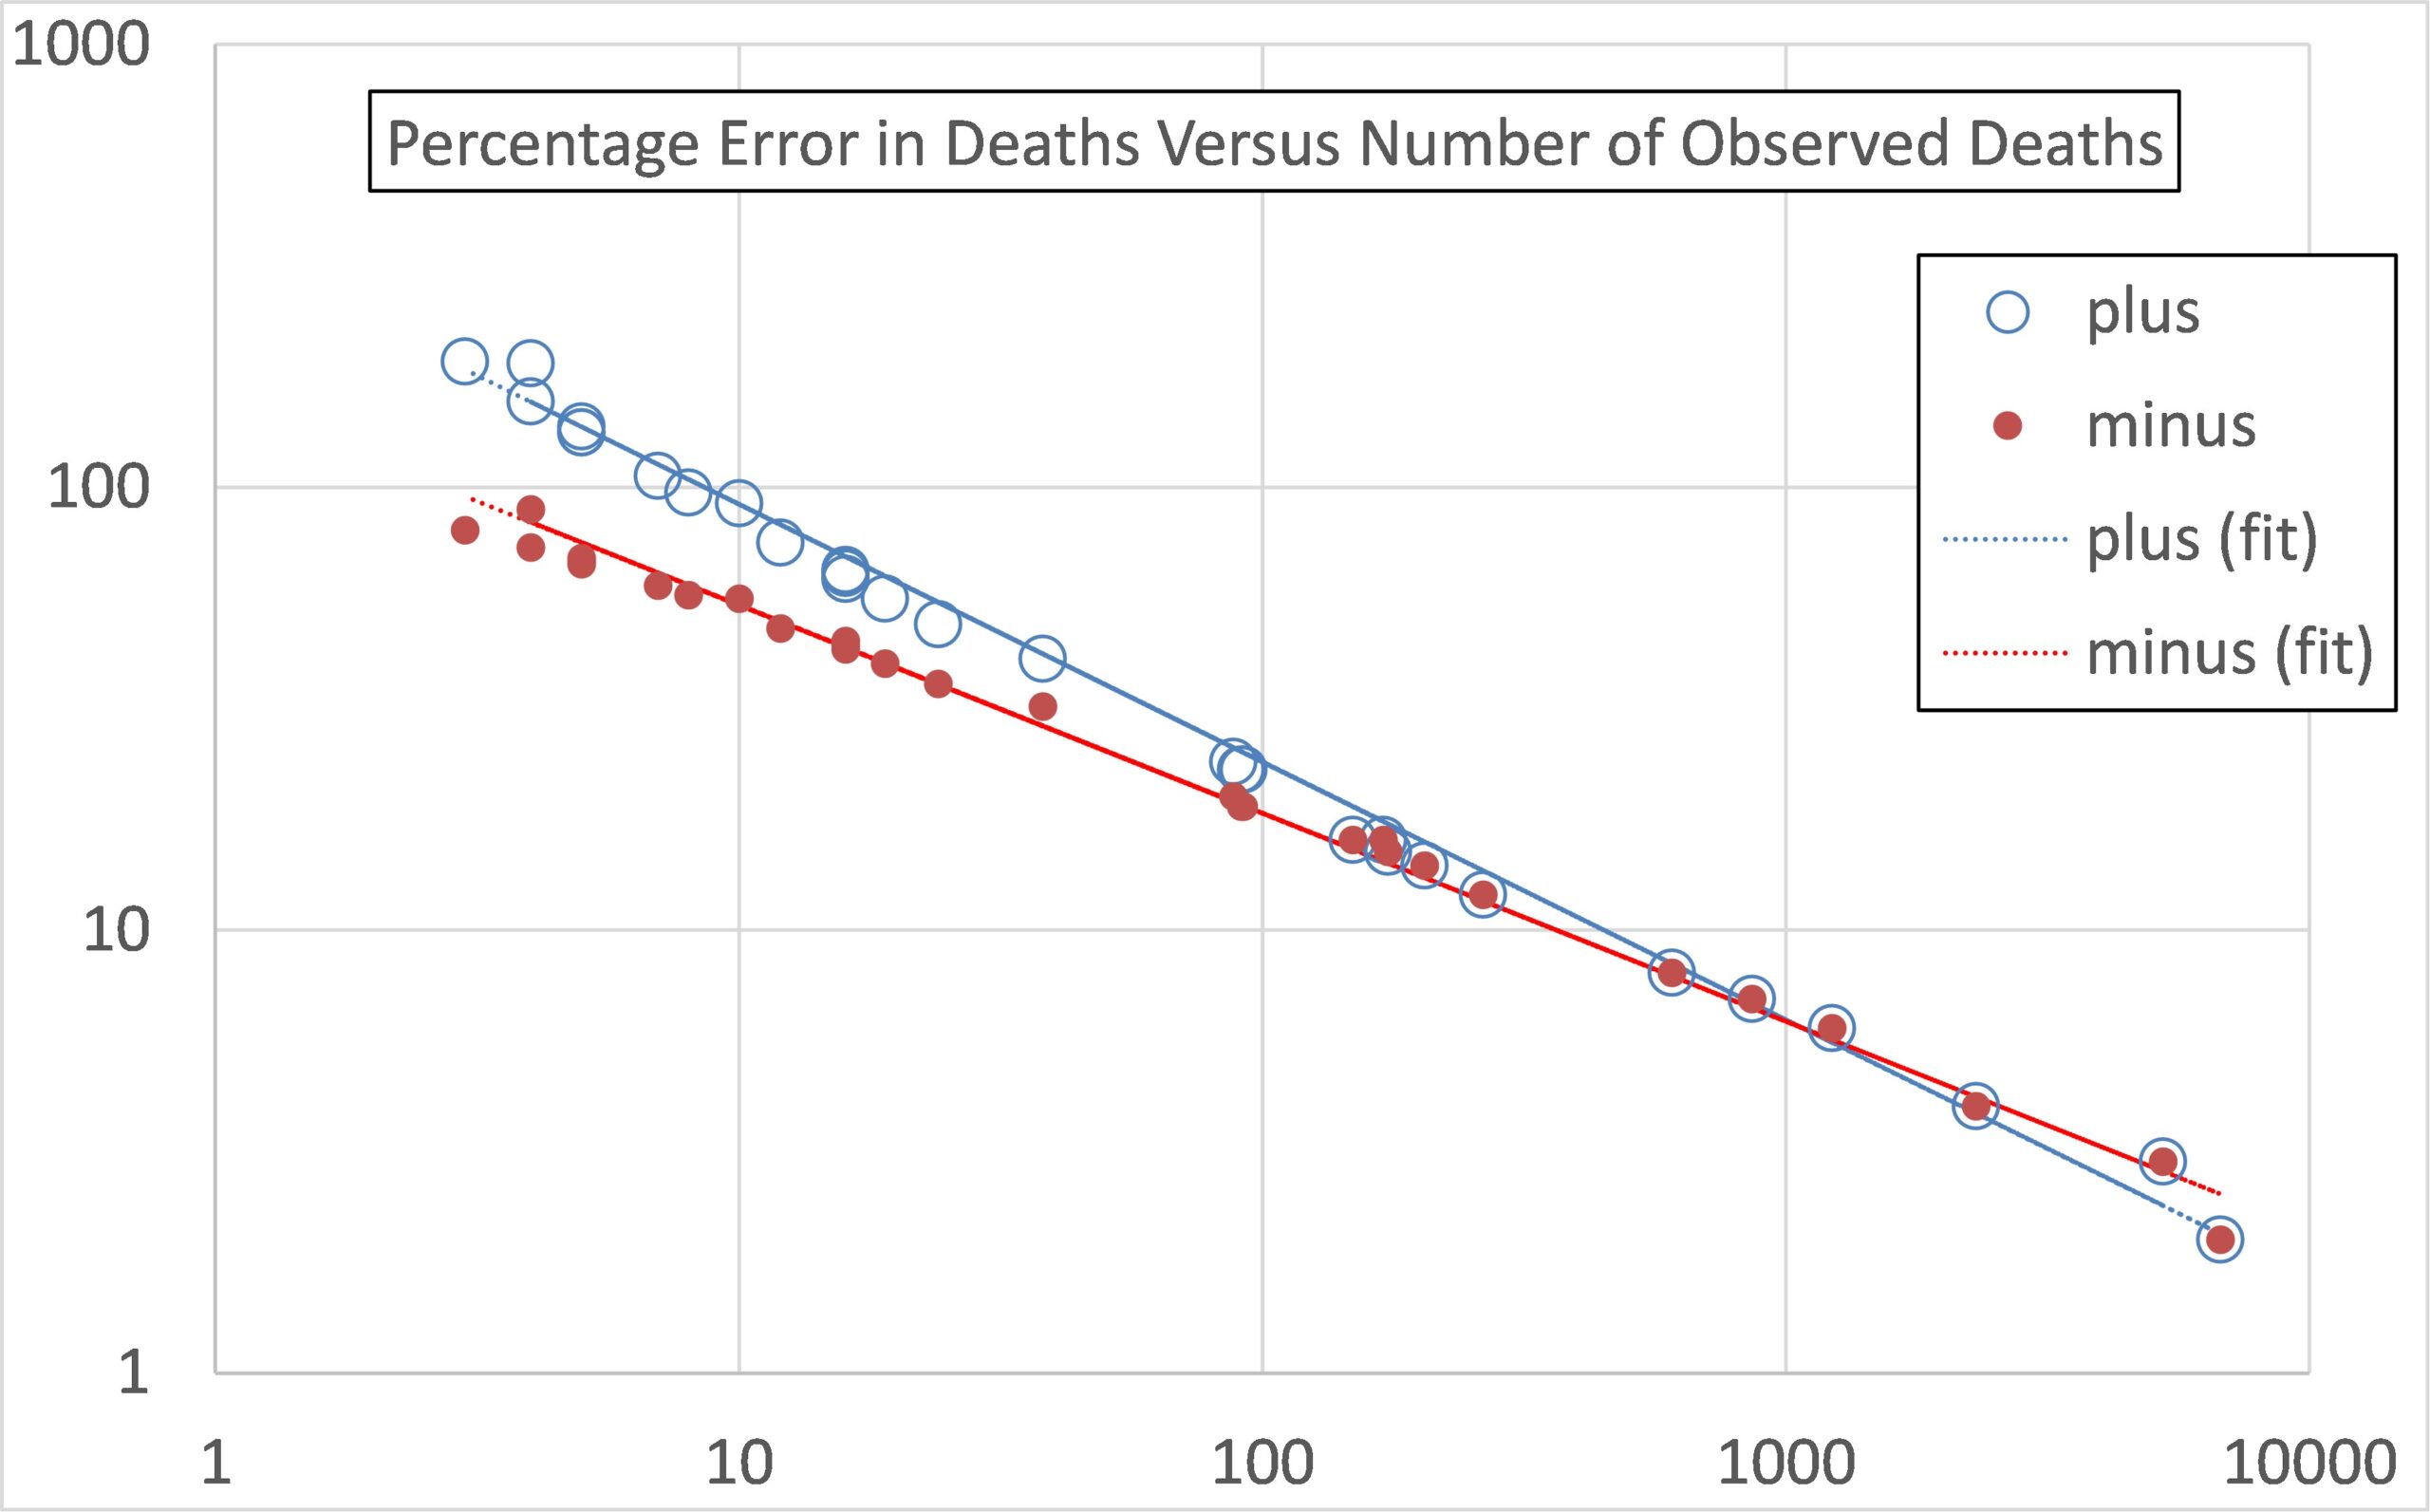
Lower and Upper Bounds in Figures 1, 2 and 3 are defined at the 95% confidence level. The full specification for their determination is given here. However, I cut through that by random sampling of the upper and lower bounds given in Table 2 of the dataset “Age-standardised mortality rates for deaths by vaccination status, England: deaths occurring between 1 January 2021 and 31 January 2022” on page “Deaths by vaccination status, England”. These I express as percentage differences from the best estimates, and then fit the resulting sampled data as a function of the observed number of deaths. Figure 5 compares the fit with the sampled data, fitting separately for the upper (plus) and lower (minus) errors. The fits are,
Percentage error (for lower bound) = -160*deaths^(-0.47)
Percentage error (for upper bound) = +350*deaths^(-0.582)
These give errors in the number of deaths. I assume the quoted person-years is correct, so the same percentage errors apply to death rates per 100,000. However, the bounds on the ratio of vaccinated to unvaccinated death rates were obtained by,
- The lower bound ratio is defined as the lower bound vaccinated death rate divided by the upper bound unvaccinated death rate;
- The upper bound ratio is defined as the upper bound vaccinated death rate divided by the lower bound unvaccinated death rate.