I hadn’t planned on doing another post on the pay gap – aren’t we all bored with it now? Unfortunately I am obliged to do so due to a blunder in a previous post. The blunder was not mine. It was entirely down to the Office for National Statistics (ONS). I will describe the blunder and then go on to present what I believe is the secure position on the key issue in question: how the gender pay gap varies with age.
The gender pay gap is invariably presented ‘gross’, i.e., before income tax. I take the opportunity to address the percentage pay gap net of income tax, which is smaller.
All data herein is derived from ASHE, the Annual Survey of Hours and Earnings. These surveys take a 1% sample of data from HMRC PAYE returns. The data refers to UK as a whole. However, since data derive from PAYE, only employees are covered. The self-employed do not feature. It should not be assumed that this excludes only high-earning business people. Many of the self-employed are tradesmen, for example, whose earnings may be precarious. Recall it is the self-employed who may legally pay themselves less than the minimum wage, and frequently do. Incorporating the self-employed in the gender pay gap is a job that needs doing, but is beyond the reach of an amateur.
A report from the Institute of Economic Affairs, published a few days ago, makes some of the same points as herein.
Contents
- 1. The Blunder – The Regression Analysis
- 2. The Gender Pay Gap – The Data
- 2.1 Gender Pay Rate Gap Versus Age
- 2.2 All-Ages Gender Pay Rate Gap
- 2.2.1 Full Time and Part Time Working Combined?
- 2.3 Full Time Pay Rate Distributions by Sex
- 3. Gender Pay Rate Gaps Net of Income Tax?
- 3.1 Income Tax Hourly Rate
- 3.2 Gender Pay Rate Gap After Income Tax
- 4. Conclusions
1. The Blunder – The Regression Analysis
In my earlier post, Pay and Employment by Sex, I originally included the following graphic,
Figure 1 – This is the INCORRECT Figure (Fig.11 from here) click to enlarge
My article was published on 12th June 2016 and the above graphic was copied directly from the 2015 ONS report, “Analysis of factors affecting earnings using Annual Survey of Hours and Earnings: 2015” (published 18th November 2015). It is still available, as I write, here, the above graphic appearing as Figure 11.
However, on 6th April 2017 (11 months after my original post), the ONS issued an updated version of their 2015 report, bearing the same title. It was headed by the following Correction statement,
“A correction has been made to Figure 11. This was due to a small error when interpreting the regression coefficients. You can see the original content in the superseded version. We apologise for any inconvenience.”
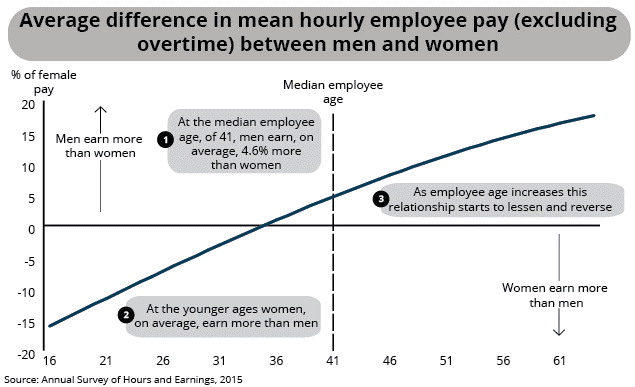
The corrected version of Figure 1 (their Figure 11) which ONS published on 6th April 2017 is shown below as Figure 2. As you can see, the description of the change as being due to a small error is hardly accurate.
Figure 2 – This is the Corrected Figure (Fig.11 from here) click to enlarge
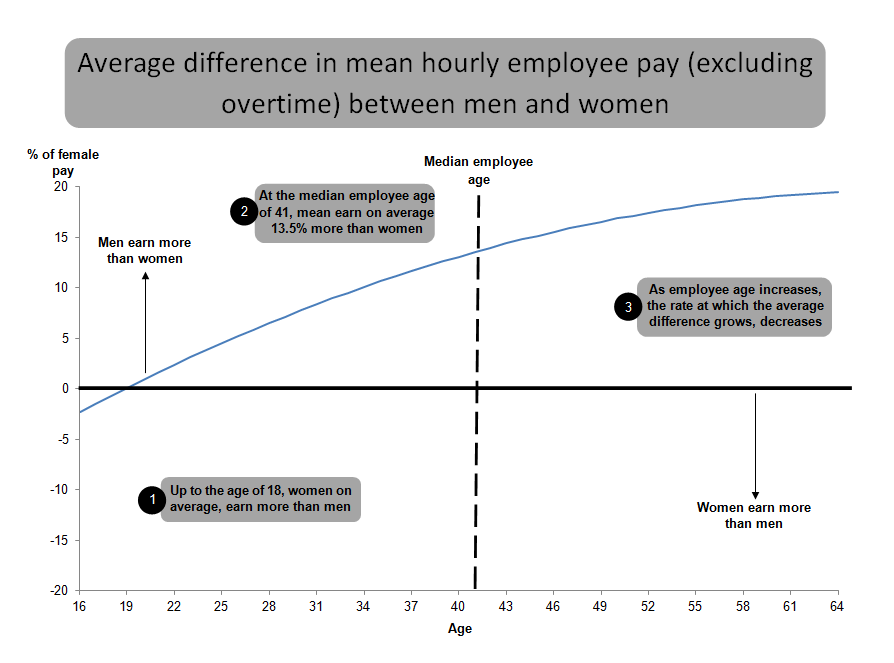
Figure 1, or its ostensibly corrected version, Figure 2, are not raw data. They are the result of a regression analysis. A regression analysis fits the raw data to a simple algebraic ‘model’. For this purpose a number of independent variables are postulated as being key to the observed variation in the dependent variable (in this case, hourly pay rate – or, more accurately, its natural logarithm). The independent variables in the ONS regression included age, sex, years of tenure in current job, employment in the private or public sector, full time or part time working, permanent or temporary employment, size of the employing organisation, a variable representing regional location, and eleven occupation classifications from ‘elementary’ to CEO level.
The ONS considered six different models. Non-linear functions of the independent variables were included in some cases, but all models were linear regressions in the sense of having linear dependency on the fitted coefficients multiplying each independent function. Only models 4 and 6 are of interest here since these were the only models to include both the sex and age variables (which are essential to isolate the gender pay gap as it varies with age).
The regression models and the fitted regression coefficients are available in this dataset for 2015: Analysis of factors affecting earnings using Annual Survey of Hours and Earnings – All reference tables (Nov’15). Curiously the same data file is linked from both the original and the revised “Analysis of Factors” links. The Excel Worksheet named “Figure 11” in this file gives, in tabular form, the original Figure 11 (i.e., Figure 1, above). ONS appear to have been content to let this incorrect version persist within the data file – rather sloppy, if indeed it is truly in error.
However, I have used the published regression coefficients to reproduce the gender pay gap versus age. I have successfully reproduced the corrected version of Figure 11, i.e., what is shown as Figure 2, above. There is a neat algebraic short-cut to do this which avoids having to recompile the entire regression model (which, for model 6, would involve an unwieldy 221 different terms). I am not about to attempt to make WordPress carry algebra, so the details can be found here.
I conclude that the ONS’s published regression coefficients are consistent with Figure 2 and inconsistent with Figure 1. It would appear, therefore, that Figure 1 was indeed just a blunder on their part.
However, this does not mean that Figure 2 is a terribly good representation of the age variation of the gender pay gap. It is not, as we shall see. The most serious problem is that the regression models include only linear and quadratic terms in the variable ‘age’. But the gender pay gap is virtually a step function at age 40, as we will see below. Consequently the regression models are inappropriate and doomed to be misleading as regards the age dependence of the gender pay gap. I suspect that ONS have come to the same view because the 2016 regression, reported in Analysis of factors affecting earnings using Annual Survey of Hours and Earnings: 2016, does not present results for the gender pay gap.
Another problem is that it appears that full time and part time working was analysed in the same model. Whilst a variable representing part time working was included, this is not the same as analysing full time and part time data separately. Joint analysis without interaction terms between part time working and age or gender means that the age variation of the gender pay gap becomes a hybrid of the full time and part time effects – which may be quite different.
A further shortcoming of Figure 2 is that it produces the mean gender pay gap. It is generally held that the median pay gap is more indicative. This is discussed further in the section 2.3, below.
Another features of Figure 2 which is rather odd is that, in this Figure, the gender pay gap has been defined as (m – f) / f , where m and f represent the male and female hourly pay rates (excluding overtime). This differs from the definition of the gender pay gap used elsewhere in the ONS reports, namely (m – f) / m.
Finally, the raw data used to fit the regression is described as “bonus adjusted hourly earnings excluding overtime”. It is not clear if this is the same data used in the main ONS reports.
These regression models are not a reliable indicator of the gender pay gap as it varies with age. It seems that the ONS are of the same opinion. After 2015, although regression analysis is still carried out, its results in term of the gender pay gap have not been presented.
However, the attempt was noble in the sense that regression is an established means of controlling for other variables. Thus, for example, does age – or sex – act as a surrogate for tenure? In principle this ‘comes out in the wash’ when tenure is included as a regression variable, and the same applies to other variables. However the step-function nature of the age dependence defeats the quadratic functions employed.
Nevertheless, there is one qualitative feature of the regression which is worth noting: the coefficient of the linear variable “male” is negative. In other words, maleness per se reduces hourly pay rate. Only the interaction term “male*age”, being positive, causes older males to achieve a higher pay rate than females.
2. The Gender Pay Gap – The Data
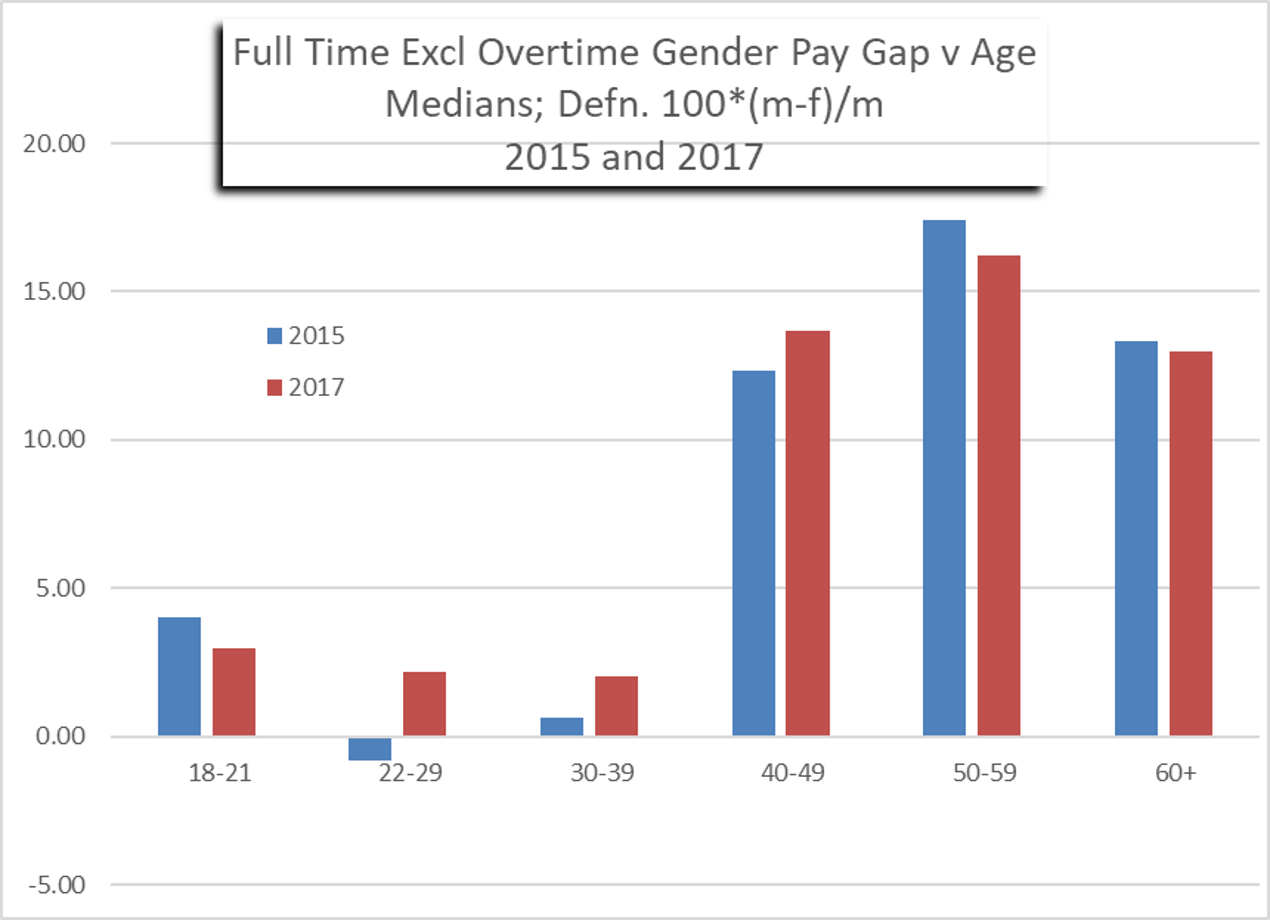
Here I go back to the published ONS data files to produce histograms of the gender pay gap versus age. I shall exclusively consider full time working with data based on hourly pay rates excluding overtime. The gender pay gap will be defined with respect to medians in each age range, and expressed as a percentage of the median male pay rate, i.e., 100*(m – f) / m.
To be consistent with Figures 1 and 2 I look first at the 2015 data, but then also at the latest (provisional) 2017 data. The 2015 final pay rate data by age group and the 2017 provisional equivalent data were both taken from this web page.
2.1 Gender Pay Rate Gap Versus Age
Figure 3 is the resulting gender pay rate gap for 2015. It is clear that both Figures 1 and 2, from the regression analysis, are very poor representations of the data. Figure 3 is what should be quoted for 2015. The salient feature is that the pay gap is negligible between ages 22 and 39.
Figure 4 shows both the 2015 and the provisional 2017 gender pay rate gaps. Between ages 22 and 39 the pay rate gap is about 2%. This is the largest the gap has been in this age range for some years, the estimates in 2013, 2014 and 2015 not exceeding 1%, and generally negative. Whether the increase to 2% is significant remains to be seen.
Figure 3

Figure 4

2.2 All-Ages Gender Pay Rate Gap
The gender pay rate gaps at different ages can be combined into an all-ages pay gap. I employ two different methods,
Method A calculates the weighted average of the median pay rates at different ages for men and women, then forms the gender gap 100*(m-f)/m from the resulting weighted averages. The weighting is based on the number of jobs in each age range.
Method B calculates the gender pay gap in each age range separately, using 100*(m-f)/m and the medians for each age range, then forms the weighted average of these individual gender gaps, the weighting being based on the number of male jobs in each age range.
Table 1 compares the resulting all-age gender pay rate gaps with the published ONS values. Given my methodological differences the agreement is reasonable.
Table 1 also includes the part-time pay rate gaps quoted by ONS (which I have not checked).
Table 1: All-Ages Gender Pay Rate Gap Based on Medians of Hourly Rates Excluding Overtime (using 100*(m-f)/m; negative, in red, implies gap in favour of women)
| Method | 2015 | 2017 |
| Method A (Full Time) | 9.5% | 10.0% |
| Method B (Full Time) | 8.0% | 8.8% |
| ONS (Full Time)(1) | 9.4% | 9.1% |
| ONS (Part Time)(2) | -6.5% | -5.1% |
2.2.1 Full Time and Part Time Working Combined?
ONS also present a pay rate gap for both full time and part time working combined (namely 18.4% in 2017). I have omitted this from consideration. In my opinion this statistic is a fine illustration of the adage “lies, damned lies and statistics”. There is a substantial pay rate premium for full time working compared with part time working. The apparently large gender pay rate gap based on all working patterns simply reflects the fact that a far larger proportion of women work part time. As such, this statistic does not measure a gender gap in pay but rather a gender gap in working hours. It is therefore grossly misleading. My suspicion is that ONS are under some pressure to include this statistic from parties with a political agenda. The ONS take some pains to head-off potential misunderstanding of this statistic, for example Figure 7 of the 2017 ASHE, which illustrates the pay rate premium enjoyed by full time workers. The point has been hammered home recently by Holbrook, drawing on the ONS’s own illustrative example.
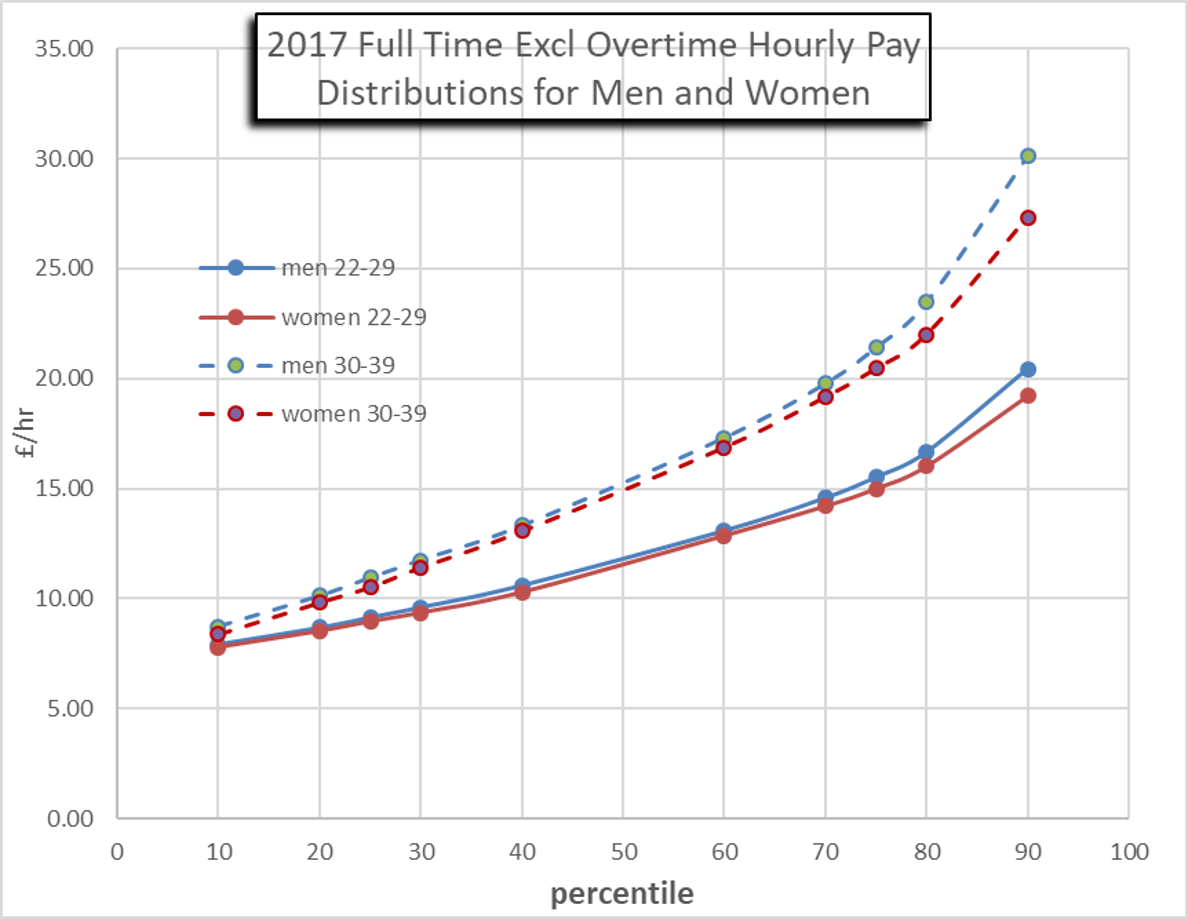
2.3 Full Time Pay Rate Distributions by Sex
In any age range, pay rates have a broad spread of values. Medians do not tell the whole story. For this reason some people quote results based on means. Unfortunately means can be sensitive to a few high lying data and medians are generally taken to be more indicative. Best of all is to look at the whole distribution.
For 2015, Figure 5 shows the distribution of pay rates against percentile in the two age ranges 22-29 and 30-39. Figure 6 is the equivalent for 2017. (All pay rates in £/hour).
As suggested by Figures 3 and 4, Figures 5 and 6 confirm there is little difference in the distributions of pay to men and women in these age ranges. There is a slight tendency for greater pay to men at the higher percentiles, but the whole distribution is very similar.
Figure 5
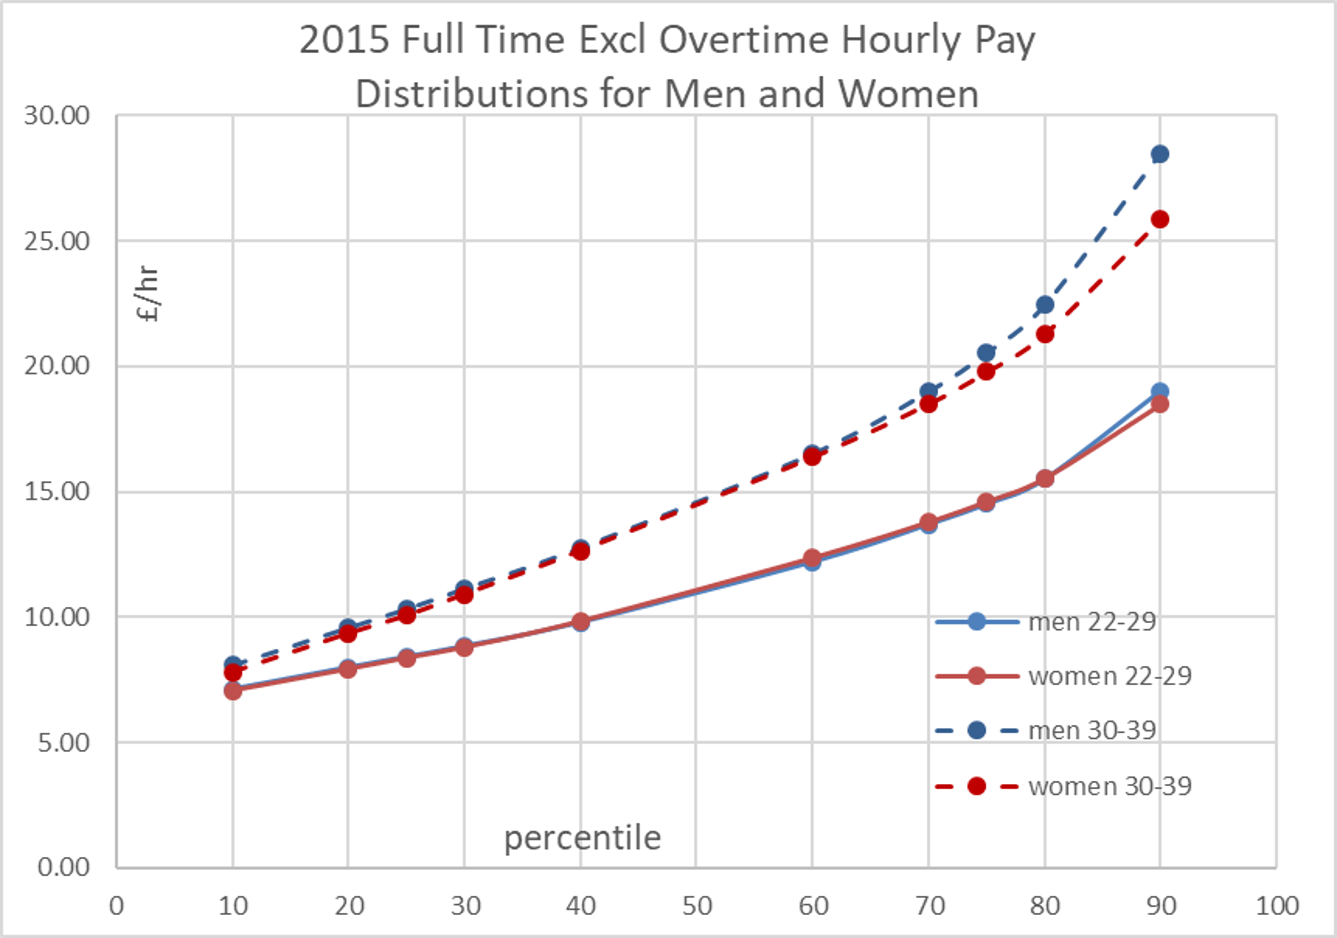 Figure 6
3. Gender Pay Rate Gap Net of Income Tax?
3.1 Income Tax Hourly Rate
UK weekly working hours averaged over financial year have been taken from here, or the equivalent ONS dataset for earlier years. Total income tax paid in the UK per year, broken down by sex, has been taken from here. Dividing the latter by the former multiplied by 52 gives the average income tax paid per hour worked for each sex. The results are shown in Table 2. Note that, because income tax is paid on all income, the total hours worked including overtime, have been used in Table 2. Men pay more income tax per hour worked than women, the difference being £1.65 (2013/14) , £1.62 (2014/15) and £1.74 (2015/16). Note that these are mean hourly tax rates, not median values.
There is no mystery as to why this is so. It is because men have higher earnings – mostly due to working longer hours, though also partly due to higher pay rates for full time workers over 40 – and higher earnings attract higher percentage tax rates, due to the operation of higher tax bands, personal allowances, etc.
You can quibble about the accuracy. Overtime is usually paid at a higher rate, and this will slightly distort the average tax rate per hour worked. Also, all earnings, for both full time and part time workers, have been included in the average tax per hour figure. However, part time workers will have a substantially lower tax rate per hour. Also, the tax data includes both employees and the self-employed, whereas the pay rate data refers to employees only. So the two things are not strictly consistent.
3.2 Gender Pay Rate Gap After Income Tax
Pay rates by sex are taken from the same data sources as above, i.e., ASHE Tables 6. For example, 2015 pay data has been taken from Excel file “Age Group Table 6.6a Hourly pay – Excluding overtime 2015”. 2017 pay data has been taken from Excel file “PROV – Total Table 1.6a Hourly pay – Excluding overtime 2017”. (Files may need to be unzipped).
Considering only full time workers, and “all ages” data, Table 3 gives the gross pay rates by sex, before tax. We wish to estimate the pay rates after tax by subtracting the hourly tax rates from Table 2 (and we shall use year 2015/16 for that purpose). But we must recognise that these hourly tax rates are mean values, not medians. It would therefore be inconsistent to subtract these mean tax rates from the median gross pay rates. Consequently we switch attention to the mean gross pay rate data, which are also included in Table 2. Note that the gender pay gap is larger when based on the mean, i.e., 14.1% rather than 9.1% when based on medians.
Table 3 therefore includes the mean pay rates net of tax. The mean gender pay rate gap of 14.1% is reduced to 5.1% (2015) or 5.7% (2017). There is still a pay gap in favour of men, but it is much reduced.
However, the accuracy of this estimate is questionable for the reasons mentioned in section 3.1. Most importantly, the hourly tax rates are averaged over both full time and part time workers. Because part time working is strongly skewed to women, this measure will probably over-estimate the gender gap in the hourly tax rate for full time workers. In any case one can argue that medians provide the better measure.
Consequently I include a rough estimate based on the median gross hourly pay rates from Table 3 in 2017, i.e., £14.48 for men and £13.16 for women. Using the average weekly hours worked by nominally full time workers, namely 39.7 hours for men and 34.9 hours for women, gross annual earnings of these ‘median’ people are found to be £29,893 (men) and £23,883 (women). For sake of argument, using the tax allowance of £11,500 applicable in 2017/18, and the basic tax rate of 20% (since our median people do not earn enough to pay at the higher rate), their net annual earnings are found to be £26,214 and £21,406 respectively. Dividing by their respective hours worked gives a net pay rate of £12.70 (men) and £11.80 (women). So our estimate of the median gender pay rate gap, net of income tax, is 7.1%.
Table 2: Total weekly hours worked and total income tax paid for the whole of the UK, and the average hourly tax paid per person
| Item | Men | Women | Ratio m/w |
| Year 2013/14 | |||
| Income tax (£M) | 120,051 | 44,650 | 2.69 |
| Hours/week (millions) | 590.4 | 379.5 | 1.56 |
| Average Tax/hour (£/hr) | 3.91 | 2.26 | 1.73 |
| Year 2014/15 | |||
| Income tax (£M) | 121,119 | 45,489 | 2.66 |
| Hours/week (millions) | 603.4 | 390.9 | 1.54 |
| Average Tax/hour (£/hr) | 3.86 | 2.24 | 1.72 |
| Year 2015/16 | |||
| Income tax (£M) | 130,000 | 48,300 | 2.69 |
| Hours/week (millions) | 610.9 | 395.4 | 1.55 |
| Average Tax/hour (£/hr) | 4.09 | 2.35 | 1.74 |
Table 3: All-ages full time pay rates (excl overtime); gross pay rates and pay rates net of income tax compared, 2016/17
| Item | Men, £/hr | Women, £/hr | Difference, m-w | Gap, (m-w)/m |
| 2015, Gross (Median) | 13.85 | 12.51 | 1.34 | 9.7% |
| 2015, Gross (Mean) | 16.96 | 14.57 | 2.39 | 14.1% |
| 2015, Net (Mean) | 12.87 | 12.22 | 0.65 | 5.1% |
| 2017, Gross (Median) | 14.48 | 13.16 | 1.32 | 9.1% |
| 2017 Gross (Mean) | 17.95 | 15.42 | 2.53 | 14.1% |
| 2017, Net (Mean) | 13.86 | 13.07 | 0.79 | 5.7% |
4. Conclusions
The ONS pay rate regression analyses are not a suitable basis for presenting the gender pay rate gap as it varies with age. ONS’s original Figure 11 (reproduced above as Fig.1) which purported to do so was in error and has been withdrawn by ONS in favour of a replacement (reproduced above as Fig.2). However, this replacement regression-based curve is grossly misleading when compared with the actual data (see Fig.3, above). I presume this is why ONS have not published a comparable Figure since 2015.
Figures 3 and 4 are the best representation of the full time gender pay rate gap as it varies with age. Between ages 22 and 39, this gender pay rate gap is negligible (between about -1% and +2%).
The all-ages ‘averaged’ full time pay rate gap in favour of men (currently a median little above 9%) occurs entirely due to a pay rate differential opening up after age 40 and applies only before tax.
For part time workers the (gross) gender pay rate gap is in favour of women by 5.1% (2017).
Men work 55% more hours than women.
Men pay 169% more income tax than women.
The all-ages pay rate gap for full time workers net of income tax has been estimated to be roughly 7% (median).