Excess Deaths: Statistical Significance and Trend (February 2023 update)

Figure 1

This is an update to my post on excess deaths to October 2022. The methodology of the analysis is the same but the latest ONS dataset (to week 5 2023) has been used, available here.

Data relate to England and Wales.

I concentrate on “non-Covid deaths”, so that any fatal effects of Covid (the disease) is removed from consideration (as opposed to the possible effects of a host of other issues related to Covid).

ONS datasets give weekly data for “deaths involving Covid” and also “deaths due to Covid”. Only the latter relate to Covid having been identified as the cause of death. (The former is likely to mean a death whose principal cause was not Covid, but the individual happened to be Covid-positive). Consequently, I define here “non-Covid deaths” as all deaths minus deaths due to Covid.

I define “excess deaths” as an excess with respect to the average of the five pre-Covid years 2015 to 2019, evaluated on a weekly basis.

Please note that ONS have now departed from this definition of their own “excess death” data. For year 2022, excess deaths reported by ONS are with respect to the average of years 2016, 2017, 2018, 2019 and 2021. For year 2023, excess deaths reported by ONS are with respect to the average of years 2017, 2018, 2019, 2021 and 2022. This is a really silly thing to do – unless it is a deliberate attempt at obfuscation. To change the baseline confuses what the “excess deaths” are supposed to mean. And the inclusion of years 2021 and 2022 in the baseline when Covid was still actively causing deaths is, frankly, bonkers – unless, as I say, if you are trying to cook the books. I hope not. But it is the wrong thing to do, anyway. I use a constant comparison standard throughout – the average of years 2015 to 2019.

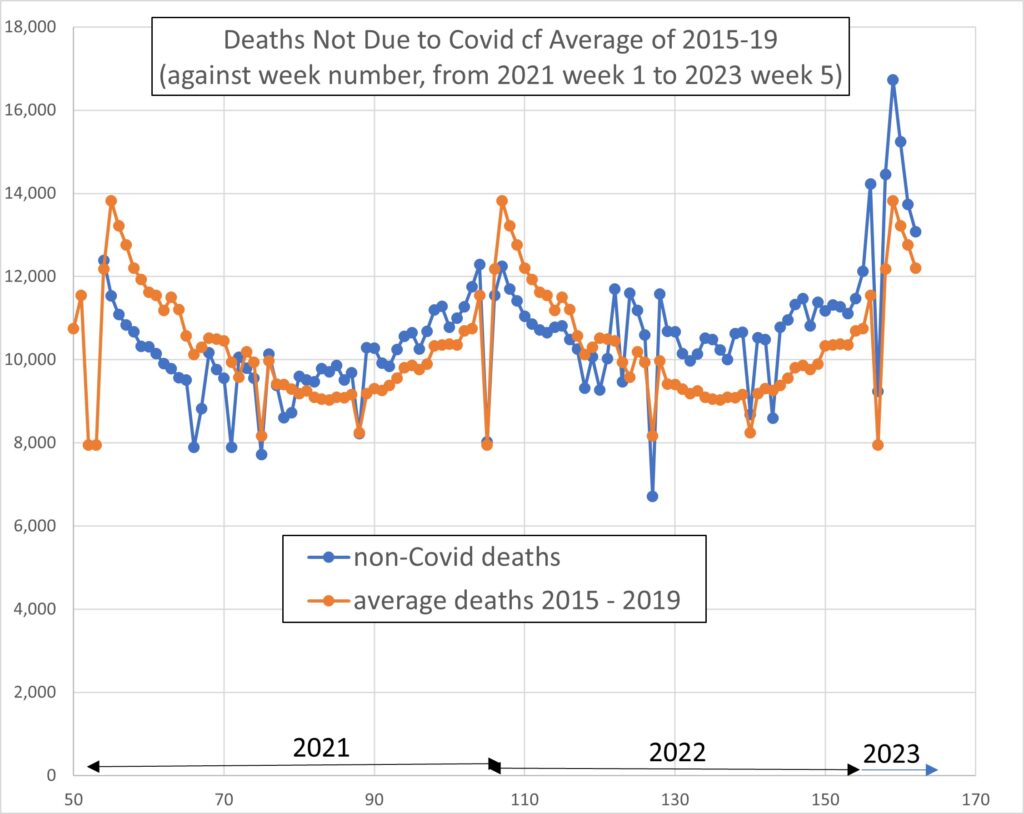
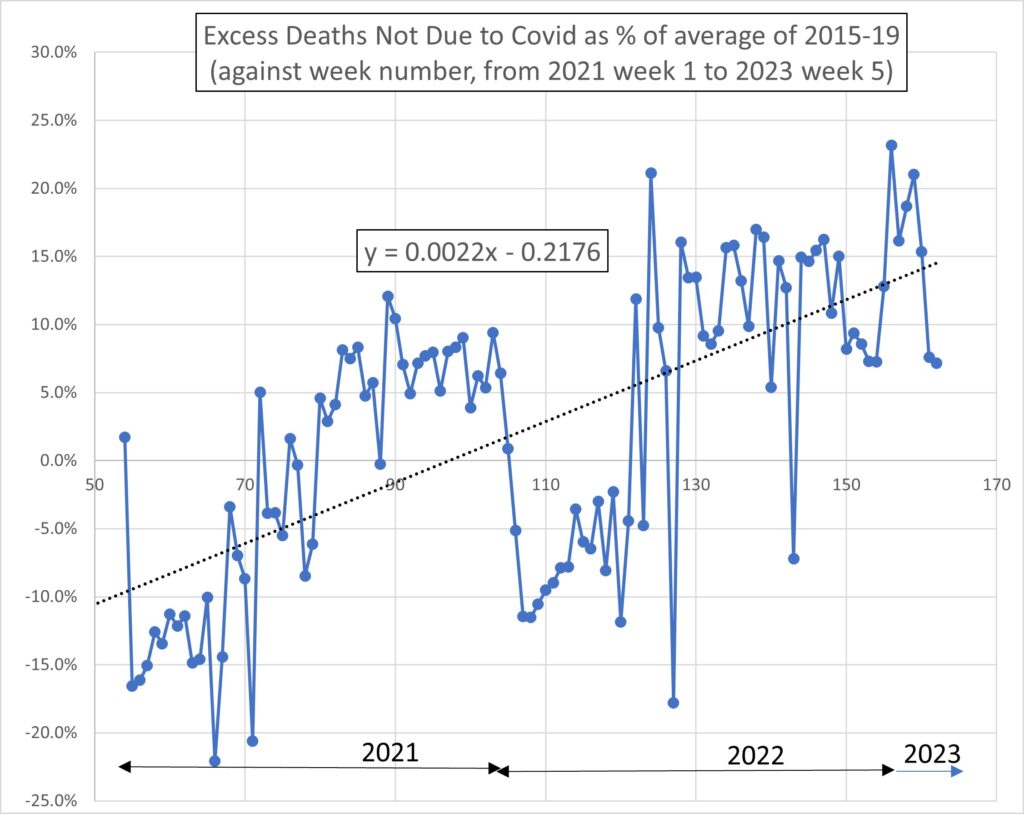
Figure 1 which heads this post shows that the inclusion of 15 further weeks data has not changed the trend compared to my October 2022 post. Based on the trend over the period from 1 January 2021, the number of excess deaths as a percentage of that expected based on pre-Covid years is in creasing at the rate of 11% per year.

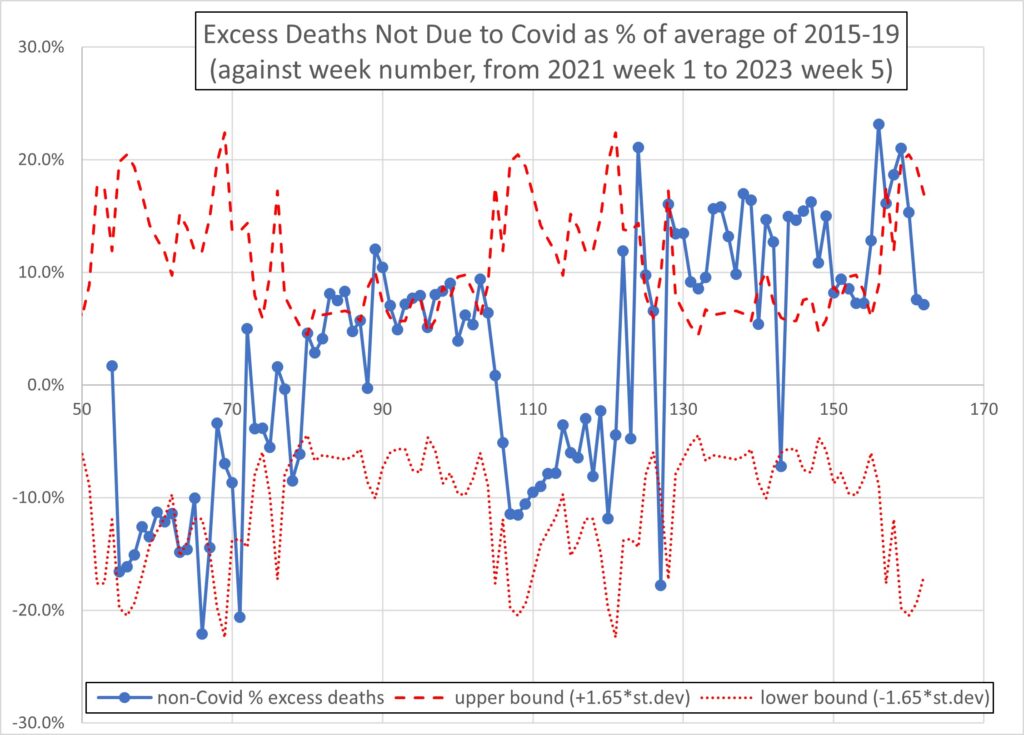
Figures 2 and 3, below, address statistical significance. Figure 2 is based on +/- 1.65 sigma (95%CL), using weekly data for the ten years 2010 to 2019 to evaluate sigma. Figure 3 is based on the largest and smallest percentage difference from the mean across the ten sampled years. These two Figures tell the same story: the excess deaths have significantly exceeded expectation almost every week for 38 consecutive weeks, i.e., they lie above the statistical ‘upper bounds’ calculated on this basis.

Figure 4 plots the absolute number of deaths, weekly, from January 2021 to present, in comparison with the average of the five pre-Covid years 2015 to 2019.

The dashed line on Figure 1 is the best-fit line, i.e., a linear regression. The significance of the temporal variation is extremely high. For the slope coefficient, t = 9.0, p = 10^-14, F = 81, F-significance = 10^-14, R-squared = 0.43.

Conclusion

This is looking very bad.
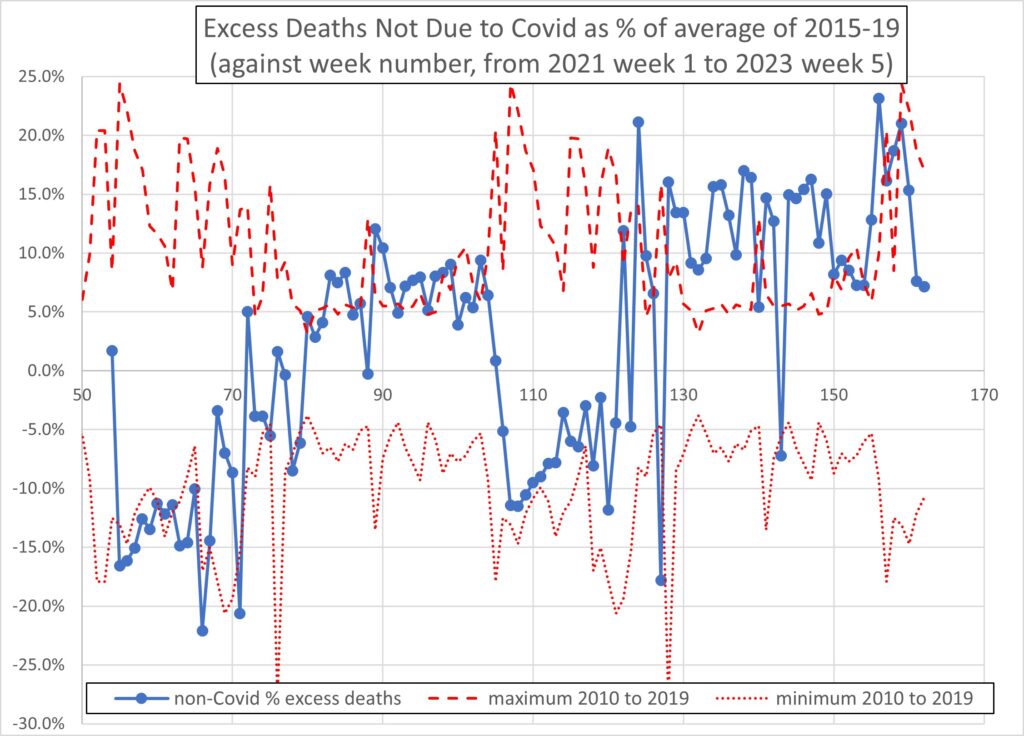
Figure 2
Figure 3
Figure 4

3 thoughts on “Excess Deaths: Statistical Significance and Trend (February 2023 update)

  1. Alan

    Slightly off topic perhaps but your post prompted me to look on the ONS site for life expectancy data.
    They have a have a section under Mortality Insights from GAD – July 2022 (figure 3)

    The Variations and changes section discusses the impact on life expectancy for males and females in different deprivation groups between 2015 to 2017 and 2018 and 2020.

    It says
    Over a typical period in time, we would expect life expectancies to continue increasing, as they have over the last century. However, the life expectancies for those in most deprived areas has seen a negative change, where these have decreased by up to 6 months.

    In contrast, life expectancies in more affluent areas have either seen no change (such as deciles 5 and 8) or a relatively small reduction for males, and an increase for females. This is illustrated in Figure 3. This suggests that the gap in life expectancies between the most and least deprived groups in England has widened over recent years.

    All very well and something worth noting but what is incredible is the same graph shows that for every deprivation group the gap between male and female life expectancy increased. Whereas female life expectancy declined for the most deprived females and increased for the rest there was no deprivation group for which the life expectancy for males increased. It leaps out of the graph as the most obvious feature. I can’t imagine how anyone can write a commentary on this graph without mentioning that men have done far worse than women.

    In fact an accurate summary of the data is:
    Men’s life expectancy for all deprivation levels declined relative to women.
    The most deprived men and women suffered the largest decreases in life expectancy.
    Women in the less deprived groups had increases in life expectancy.
    Men’s life expectancy declined in most deprivation groups with no group seeing an increase.

    I can’t believe this difference between men and women is not highlighted in something called ‘mortality insights’. It must be the result of a deliberate policy.

    Reply
    1. William Collins Post author

      This is a familiar phenomenon. I can never decide if its deliberate or instinctive. The empathy gap seems to make male disadvantage, where-ever and how-ever it appears, invisible.

      Reply
      1. Alan

        They even have a section titled ‘Will the gap continue to widen?’
        Yet only talk about the gap between affluent and deprived areas not the gap between men and women despite their data showing this to be widening.

        On whether it is deliberate I can’t see how it can’t be conscious if perhaps not official policy. I don’t work for the government but I assume that like us anything that is released is reviewed and checked before release, that doesn’t mean that we never release anything with a mistake but it beggars belief that both an author and a reviewer, perhaps several reviewers could miss this obvious feature of the data and not comment on it.

        If you are concerned with intersectionality then the very worst impact is on the most deprived men with a decline in life expectancy of 6 months in just 3 years set against what had been a trend of an increase of roughly 4 months life expectancy over 3 years.

        Reply

Leave a Reply

Your email address will not be published. Required fields are marked *