
Education and research is a huge area. It comprises schools, higher education (HE) establishments and research institutes. The people involved are school pupils, university students, school teachers and university and research institute staff. There are plenty of areas in which gender differentials are evident and should be of concern. But our society’s concerns are partisan: they focus on areas where women are under-represented only, and ignore the greater issues facing males. Here I use Athena SWAN as an exemplar of that partisan phenomenon, though in truth it is society-wide.
Athena SWAN is dedicated to advancing women’s careers in HE and research, originally in STEMM subjects but now also more broadly. After reviewing Athena SWAN and its parent organisation, I present a brief summary of the gender disparities in school pupil achievement, in HE qualifications, in school staffing and in HE staffing. The issues on which Athena SWAN focus relate to just one part of one of these four areas: the senior staffing levels in HE, especially in STEMM. By presenting the bigger picture I reveal just how partisan is this selective focus. Moreover, I shall argue that even in this selected area, the under-representation of women is not the result of inequality but of choice.
The Equality Challenge Unit
Athena-SWAN is part of the Equality Challenge Unit (ECU), whose strap line is “Advancing Equality and Diversity in Universities and Colleges”. The ECU is a registered charity. It is listed as having 22 staff in 2014, but the ECU web site at February 2015 lists 30 team members (22 women, 8 men), in addition to which there are 13 Directors/Secretaries (8 women, 5 men).
In contrast, the senior management team comprises four staff: three men and one woman. For an organisation which is all about promoting equal representation at senior levels in organisations I am bound to observe that they appear not to like the taste of their own medicine.
ECU is funded through the UK higher education funding bodies and representative organisations, including,
- Higher Education Funding Council for England
- Higher Education Funding Council for Wales
- Scottish Funding Council
- Department for Employment and Learning (Northern Ireland)
- Guild HE
- Universities UK
- Royal Society
- Biochemical Society
- Department of Health
- Scottish Funding Council
- Department for Business, Innovation and Skills
- Higher Education Authority (Ireland)
In addition the ECU receives fees from Athena SWAN member organisations, mostly universities, of which there are 122 at February 2015.
In 2014 their turnover was £1.9M (up from £1.4M in 2010). Of this, £1.16M went in salaries. There was little in the way of other outgoings. They have current net assets at the start of 2015 of about £1M, mostly in the form of cash.
The ECU states its aim as working “to further and support equality and diversity for staff and students in higher education institutions across the UK and in colleges in Scotland.” They claim that their approach is “evidence-based, using research to identify and change practices that unfairly exclude, marginalise or disadvantage people.”
The Athena SWAN Charter
The Athena SWAN Charter is the main initiative within the ECU and states that its concern is with “recognising commitment to advancing women’s careers in science, technology, engineering, maths and medicine (STEMM) employment in higher education and research. It has been developed to encourage and recognise commitment to combating this under-representation and advancing the careers of women in STEMM research and academia.”
Athena SWAN operates a system of awards at escalating standards: bronze, silver and gold. Organisations achieving these awards are encouraged to advertise the fact, e.g., on their web sites, newsletters, etc. By this means Athena SWAN promote their specific agenda as the de facto standard of correctness to be adopted by all. It is not clear (to me, at least) how, or by whom, this standard has been ratified – except by default through the existence of their funding streams.
In truth it is likely that no close inspection of the intents of the Athena SWAN agenda has been carried out, the funding bodies being brought on board via an uncritical acceptance that the initiative furthers “equality”. It is likely that the individuals within the funding bodies responsible for approving support to Athena SWAN were already committed to the “women’s equality” agenda. Such is certainly true in the case of the Chief Medical Officer, Dame Sally Davies.
But Athena SWAN, as part of the ECU, addresses only staff in HE – just one part of the whole education sector. Moreover, Athena SWAN has concerns only for women, as made explicit for example in its Awards Handbook,
While good practice benefits men and women, Athena SWAN awards specifically recognise what is being done to address the under-representation of women in STEMM, and to support and encourage their career progression. Panels expect to see some evidence of gender-specific measures if appropriate, and/or commentary and evidence on how initiatives have in particular benefited women.
Universities and research institutes are coerced into becoming Athena SWAN members by the time honoured process of shaming: they are fearful of being labelled chauvinistic if they do not. But the coercion is becoming increasingly financially legislated. In 2011 the Department of Health (specifically the Chief Medical Officer Professor Dame Sally Davies) decided to require that their funding of the National Institute of Health Biomedical Research Centre and Biomedical Research Unit would be conditional upon achieving an Athena SWAN silver award. (Note that this is not even the lowest of the Athena SWAN awards). And in 2012 this ruling was extended to patient safety research funding. Not surprisingly, Athena SWAN then saw an increase in membership from medical and dental schools. Should we expect more gun-to-head encouragement? Well, there’s this…
Research Councils UK (RCUK) have set out a Statement of expectations for equality and diversity for those receiving research council funding. RCUK expects the recipients to “provide evidence of ways in which equality and diversity issues are managed at both an institutional and department level“. Moreover, the Statement recommends that, “the evidence includes participation in schemes such as Athena SWAN, Project Juno, etc….to demonstrate departmental level action“. Bluntly put, join Athena SWAN and align with their agenda or don’t get funded.
And, of course, there are many other lobby groups pushing the same agenda and lending their weight to this same endeavour. For example, the Centre for Higher Education and Equity Research (CHEER) at the University of Sussex (whose members consist of nine women and one man). Professor Louise Morley, director of CHEER, has suggested that universities should be barred from research funding unless they can prove they are supporting female academics’ careers. She opines that, “Some type of leverage is required as it does not appear that universities will initiate change themselves“. She also suggested that, “it should be mandatory for institutions to sign up to the Athena SWAN Charter so that gender is factored into all strategic planning and processes”.
This sort of draconian coercion might just be acceptable if the objective was unambiguously beneficial. This is why the Athena SWAN agenda is presented under the aegis of “equality”, so that no one dare demur. But I seek to show here that it is not about equality at all. It is about imposing a specific socio-political programme by stealth in the guise of equality.
Although initially about STEMM subjects, in 2015 the Athena SWAN charter will be expanded to include arts, humanities, social science, business and law departments alongside the current STEMM subjects. This is particularly noteworthy in view of the emphatic dominance of these subject areas by women students, and, in some cases, dominance also by female staff (see Table 5). The focus, though, is on senior staff levels, especially professorial level. Implicitly Athena SWAN recognises that the diminishing representation of women in more senior positions is due to the fact that the number of women employed reduces with age, i.e., that women leave the profession, primarily for family reasons. Hence the Charter states,
The high loss rate of women in science is an urgent concern which the organisation will address. The system of short-term contracts has particularly negative consequences for the retention and progression of women in science, which the organisation recognises. There are both personal and structural obstacles to women making the transition from PhD into a sustainable academic career in science, which require the active consideration of the organisation.
One of the principles of the Charter is the claim that in order to tackle the unequal representation of women in science it is required to “change cultures and attitudes across the organisation“. On the contrary, the claim of the present article is that the lower proportion of women at the senior levels in academia is not due to the culture or attitudes in the universities and institutes, but due to the free choices of women themselves.
The Education and Research Background – Gender Issues
Education can be split in two in two ways: school versus higher education, and staff versus pupils/students. So there are four areas for potential concern in education as regards gender. The first is the quality of education received by male and female school pupils and their numbers. The second is the quality of education received by male and female students graduating from HE institutions and their numbers. The third is gender balance amongst school teachers. The fourth is the gender issue relating to HE staff. Athena SWAN focuses very narrowly on only the last of these four things, and, moreover, is primarily concerned only with the more senior levels and especially in STEMM. Why this narrow focus?
The answer is simply that this narrow range of interest is defined by being the only area of male dominance. The focus of concern is overtly sexist. I make some pertinent observations which will be followed by their justification,
- Boys are falling badly behind girls in school educational attainment;
- Men are falling behind women in university achievement, at both first degree and post-graduate levels, except in a few subject areas (STEM);
- School teaching at both primary and secondary level is dominated by women;
- Below senior levels, there is no significant gender gap in HE academic staff overall;
- Only in some subjects, or at senior levels, do men dominate in HE staffing numbers.
Athena SWAN chooses to focus on the only remaining area in which females are not already dominant or equal, item 5.
If motivated only by equality considerations, it would be items 1 to 3, above, which would receive more attention than 5 – if only because vastly more people are disadvantaged by 1 to 3 than by 5, namely half the population – the male half.
In contrast, item 5 affects only a relatively small number of people, a few thousand.
So why focus on item 5?
The answer is, of course, that item 5 is the only area in which it is women that are under-represented. In contrast, 1 to 3 disadvantage only men and boys.
The unavoidable conclusion is that initiatives like Athena SWAN are not motivated by concerns over genuine equality, but “women’s equality” – more properly called women’s advancement unconstrained by fairness.
Even in the case of item 5 it is not inequality which causes the reduced representation of women at senior levels but women’s own choices: women tend to leave the profession before the age at which a senior rank is achieved.
Let’s look at the evidence supporting the above contentions.
School Attainment
The gap between the percentage of girls attaining grades A*-C at GCSE and the percentage of boys is persistent and unaddressed – see Figure 1.
Figure 1: GCSE attainment, the genders compared
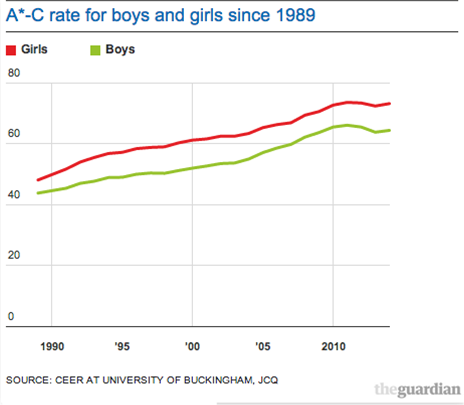
The number of boys taking A levels is smaller than the number of girls by 20%: in 2014 379,823 boys and 453,984 girls. More girls than boys got good A Levels (defined as grades A*, A or B), namely 11%, 27% and 36% more respectively.
Table 1: Numbers of A Level candidates obtaining the stated grade
| A* | A | B | |
| Boys | 32,285 | 65,330 | 93,816 |
| Girls | 35,865 | 83,079 | 127,116 |
| 100*(Girls-Boys)/Boys | 11% | 27% | 36% |
This simple fact was appallingly misrepresented in the press when the A Level results were released in summer 2014. For example, The Telegraph gave the impression that boys were catching up with girls on the basis that the gap between the percentages of those taking the exam who gained A/A* grades was improving in the boys’ favour. But this is a grossly misleading statistic as regards overall attainment.
There is a familiar phenomenon that if a gender is under-represented in a subject then a greater proportion of that gender will do well. For example, whilst only a small proportion of girls do physics A level, nevertheless a greater percentage of them will get A/A* grades than the boys. The reason is that these few girls have self-selected as being particularly keen or able at the subject, and hence do well. Similarly, whilst only a small proportion of boys do foreign languages at A level, nevertheless a greater percentage of them will get A/A* grades than the girls. Emphasising this statistic would disguise the fact that, in truth, boys dominate at physics and girls dominate at languages.
Consequently, the fact that the gender gap between the percentages of those taking the exam who gained A/A* grades has been improving in the boys’ favour in recent years may be a sign of overall diminishing attainment by boys rather than the reverse (i.e., fewer numbers of boys taking the exam). One has to be extremely careful when interpreting these statistics – especially when there is a lobby with a vested interest in hiding male disadvantage.
The blunt fact is that 11%, 27% and 36% more girls than boys are getting grades A*, A and B at A Level. This, of course, is why there are more girls going to university…..
HE Attainment
Table 2 (taken from Table 13 of HESA, the Higher Education Statistics Agency web site) shows the excess of women attaining HE qualifications in 2013/14 over men, expressed as a percentage of men, i.e., 100 x (women – men) / men. First degrees and post-graduate awards are shown separately. Salient features are,
- Combining all science-based subjects, the number of women graduates exceeds that of men at first degree level by 7%, whilst there is parity at postgraduate level. Contrary to popular belief, men do not dominate in sciences as a whole due to women’s dominance in biologically based subjects.
- In all non-science subjects, the number of women graduates exceeds that of men at first degree level by 58%, and by 56% at postgraduate level.
- Non-science subjects account for 60% of all awards.
- Over all subjects, the number of first degrees awarded to women exceeds that to men by 33% (and by 34% at post-graduate level).
- Men dominate women in just five subject areas: physical sciences, maths, computer science, engineering and architecture. These five subjects together account for just 17% of the total qualifications awarded at first degree and postgraduate levels combined.
- Hence, women dominate men in those subjects which account for 83% of qualifications gained. Generally this dominance is emphatic.
- In terms of class of first degrees attained, women obtain 28% more first class degrees and 43% more upper-second class degrees. Men get more third class degrees.
As far as I am aware, there are no initiatives to address the male disadvantage which is apparent in the above statistics. Instead the persistent focus of attention, effort and funding is to encourage more women into STEM, the dwindling island of 17% of qualifications in which men remain dominant.
This partisan focus is presented to us as being a concern over “equality”.
Table 2: HE qualifications attained 2013/14
| Excess of Females Over Males as %*Undergraduate | Excess of Females Over Males as %*Postgraduate | Total for Subject as % of All Graduates + Postgraduates | |
| Medicine & dentistry | 30 | 53 | 2 |
| Subjects allied to medicine | 328 | 204 | 11 |
| Biological sciences | 44 | 102 | 8 |
| Veterinary science | 256 | 107 | 0 |
| Agriculture & related subjects | 79 | 35 | 1 |
| Physical sciences | -30 | -27 | 4 |
| Mathematical sciences | -28 | -38 | 2 |
| Computer science | -80 | -66 | 3 |
| Engineering & technology | -84 | -68 | 6 |
| Architecture, building & planning | -53 | -27 | 2 |
| Total of All Sciences | 7 | 0 | 40 |
| Social studies | 68 | 55 | 10 |
| Law | 61 | 28 | 4 |
| Business & administrative studies | -1 | 7 | 17 |
| Mass communications | 28 | 138 | 3 |
| Languages | 128 | 120 | 5 |
| Historical & philosophical studies | 13 | 10 | 4 |
| Creative arts & design | 71 | 82 | 8 |
| Education | 355 | 165 | 10 |
| Other | 67 | 180 | 1 |
| All Non-Science | 58 | 56 | 60 |
| Total – All subject areas | 33 | 34 | 100 |
| All subjects, class of first degree | |||
| First | 28 | – | – |
| Upper Second | 43 | – | – |
| Lower Second | 11 | – | – |
| Third | -6 | – | – |
*when negative indicates an excess of males over females.
School Teachers
Key data on school employees, applicable to 2013, are as follows,
- Combining primary and secondary levels, 73.6% of teachers are female, 26.4% male.
- Female staff make up an even higher percentage of teaching assistants, 92%, and school support staff, 82%.
- In total 80% of the school workforce are female.
- In 2012, 86% of primary school teachers were women (from “School Workforce in England“, November 2012)
- One-quarter of primary schools have no male teacher at all.
There are twice as many women heads of primary schools as men. Despite this, the NUT in their “Gender and Education: An NUT Policy Statement” claim disadvantage to women in respect of the number of women primary heads, in these words,
“women are approximately four times less likely to become heads in primary schools than their male colleagues“
An object lesson in propaganda, what lies behind this grossly misleading statement is that women primary teachers outnumber men by about 8 to 1, whilst women primary heads outnumber men only by 2 to 1. The NUT’s ever-so-egalitarian position is that this is unfair to women – because women heads should outnumber men by far more than 2 to 1 – in fact, by 8 to 1. Then it would be fair in their view. This is “women’s equality”. That they should be reducing the ratio towards 1 to 1 at both teaching level and head level simply does not arise in their thinking at all.
This is odd because that is precisely what Athena SWAN are pushing for in the context of HE staff at all levels.
HE Staff Numbers and Grades
I summarise some data on HE staff numbers in the UK, taken from HESA except where noted otherwise, and relating to 2013/14.
Table 3 indicates that women dominate if both academic and non-academic staff numbers are combined. Women also dominate the part-time academic staff, but men dominate full time academic staff. Combining full time and part time academic staff, the ratio of women to men is 0.83.
So, whilst there is a greater number of male academic staff, when all subjects and all staff grades are combined, the difference in numbers is not great (45% women, 55% men).
Table 3: All HE staff by gender and employment type
| Women | Men | Women/Men | |
| Academic, Full Time | 50,590 | 77,580 | 0.65 |
| Academic, Part Time | 36,000 | 30,075 | 1.20 |
| Academic, “Atypical” | 35,260 | 39,780 | 0.89 |
| Total academic | 121,850 | 147,435 | 0.83 |
| Non-academic, Full Time | 73,515 | 61,365 | 1.20 |
| Non-academic, Part Time | 52,800 | 13,855 | 3.81 |
| TOTAL of all above | 248,165 | 222,655 | 1.11 |
Table 4 indicates the number of staff by seniority. This, finally, identifies the issue which exercises Athena SWAN & Co: the fact that men predominate at senior grades and professorial level.
Table 4: HE academic staff by seniority and sex
| Grade | Female | Male | Female/Male |
| Senior Academic | 2035 (33%) | 4100 | 0.50 |
| Professor | 4415 (22%) | 15335 | 0.29 |
| Below senior level | 80145 (48%) | 88220 | 0.91 |
| Total | 86590 (45%) | 107655 | 0.81 |
There are, of course, subjects in which the number of women HE staff exceeds that of men. These 14 subjects are listed in Table 5. I failed to find data on seniority levels (e.g., numbers of professors by gender) in these women-dominated subjects.
Table 5: The 14 out of 47 subject areas listed by HESA where the number of women HE staff exceeds that of men
| Subject | Female | Male | Female/Male |
| Clinical medicine | 11825 | 10780 | 1.10 |
| Nursing & allied health professions | 7120 | 2340 | 3.04 |
| Psychology & behavioural sciences | 3720 | 2520 | 1.48 |
| Health & community studies | 2030 | 1075 | 1.89 |
| Veterinary science | 670 | 590 | 1.14 |
| Social work & social policy | 1750 | 990 | 1.77 |
| Sociology | 1485 | 1405 | 1.06 |
| Catering & hospitality management | 385 | 370 | 1.04 |
| Education | 6205 | 3275 | 1.89 |
| Continuing education | 625 | 395 | 1.58 |
| Modern languages | 3660 | 2075 | 1.76 |
| English language & literature | 2625 | 2175 | 1.21 |
| Total academic services | 630 | 495 | 1.27 |
| Staff & student facilities | 290 | 145 | 2.00 |
Staff Age by Gender
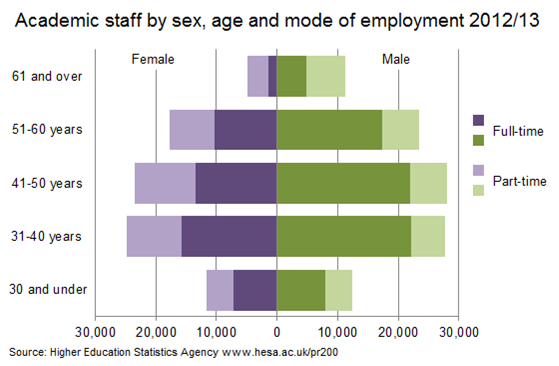
Table 6 shows how the proportion of female HE staff falls off with age compared with that of men. This, I claim, is significant in respect of the smaller number of women at senior staff grades: a smaller proportion of women remain in service long enough to reach the higher grades. The same information is shown in the graphic of Figure 2.
Table 6: Relative age distribution of the genders
| Age Group | Women / Men |
| 30 and under | 0.94 |
| 31 – 40 years | 0.90 |
| 41 – 50 years | 0.84 |
| 51 – 60 years | 0.76 |
| 61 and over | 0.43 |
Figure 2
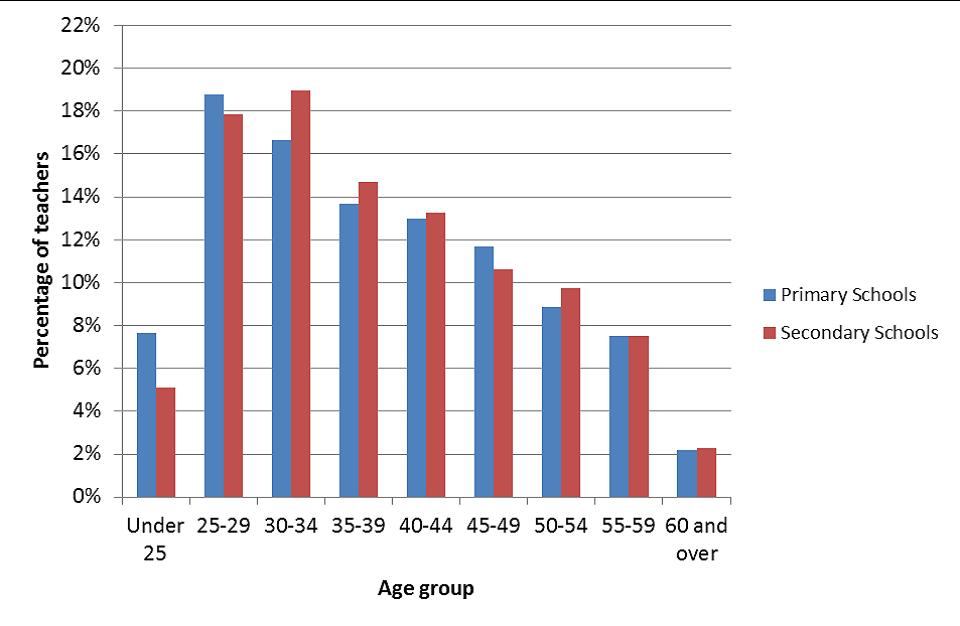
The reducing numbers of women still working at older ages is familiar from other professions. It is very clearly shown in the histogram of school teachers ages (Figure 3). Bearing in mind that three-quarters of school teachers are women (and 86% of primary teachers), this rather emphatic decline in numbers with age will mostly reflect that of women.
Figure 3: Histogram of school teachers’ ages
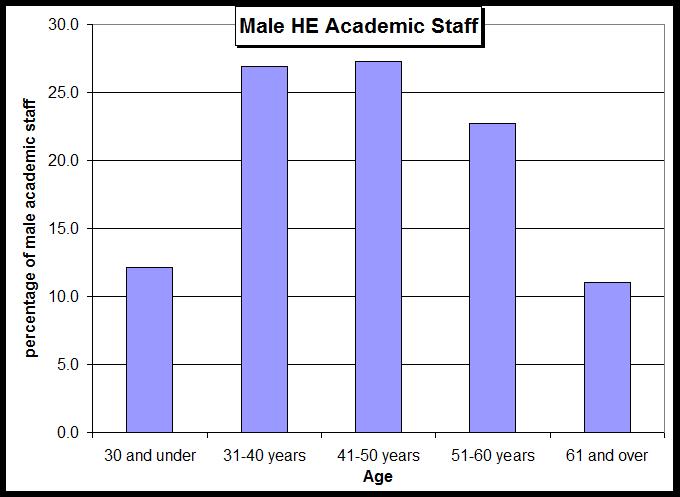
This may be contrasted with the age histogram for male HE staff, Figure 4, which shows good retention to age 60, and significant working beyond 60. This is consistent with larger numbers of men at the more senior HE staff levels, simply because they stick at it longer.
Figure 4
Despite the fewer women at senior staff grades, those women who do reach senior grades do so at an age which is the same as that of men. This is shown by Figure 5, which relates to all subject areas, and by Figure 6 which is specific to physics. Both these show that, where women achieve a given level of seniority, there is no difference in the age (i.e., the experience level) at which this is achieved between men and women.
Figure 5: HE Staff Age Histograms: All Subjects (proportions of staff of that gender at stated grade)

Figure 6: HE Staff Age Histograms: Physics (proportions of staff of that gender at stated grade)
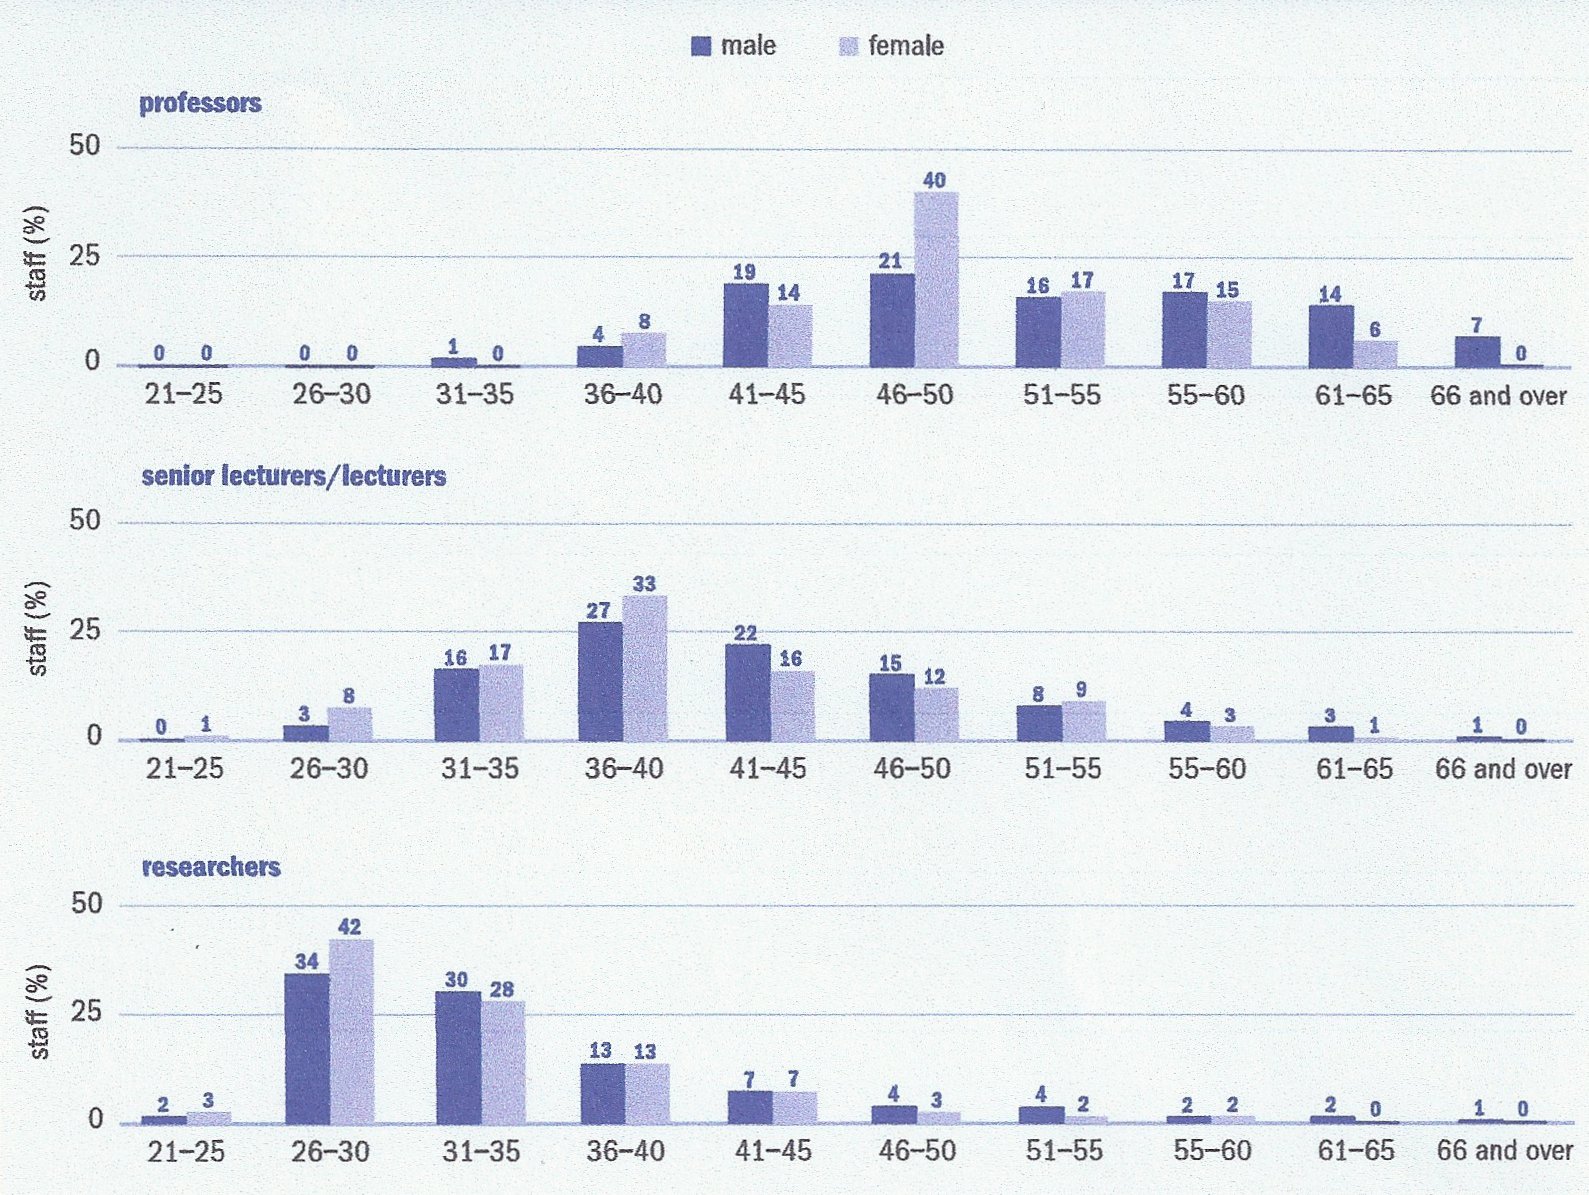
This suggests a rather fixed age-seniority relationship. This is consistent with the hypothesis that the smaller number of women at senior levels is simply a reflection of the diminishing numbers of women still employed at older ages. This is an important conclusion since it implies that the smaller number of senior women is merely a reflection of the smaller number of older women employees, and not due to “real barriers to women’s progression” within the HE institutions themselves, as is frequently claimed.
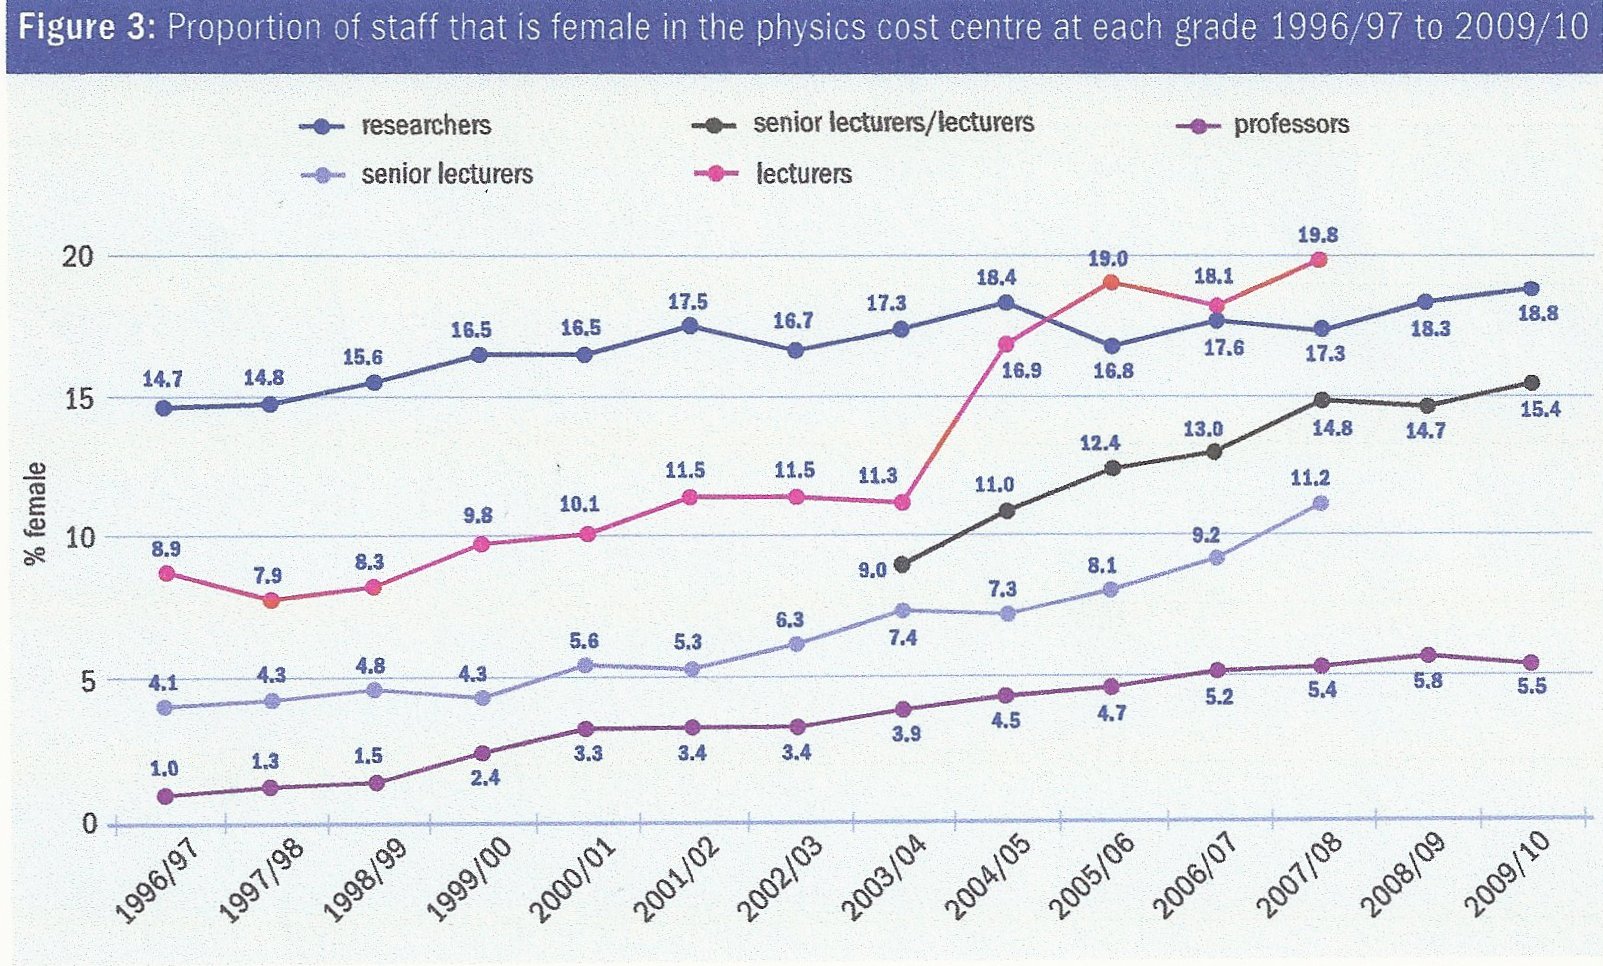
Figure 6 is particularly noteworthy since physics is the archetypical STEM subject which is frequently criticised for low numbers of women, especially at senior levels. Hence, in Figure 7 I show how the numbers, and proportions, of female staff in physics departments has been increasing over the last 15 years or so. In fact the proportion of women at senior staff grades in physics has increased faster than the proportion at junior grades, though all have increased. The proportion of women researchers / lecturers is now comparable with the proportion of females taking physics A Level and the proportion of undergraduates who are women (about 20% in each case). Figures 5 to 7 were taken from the 2012 Institute of Physics report “Academic Physics Staff in UK Higher Education“).
Figure 7: Trends in Proportion of Female HE Staff in Physics
This upward trend in female staff numbers in HE physics contrasts with the decline in the numbers of male school teachers – see Figure 8. And yet the former continues to receive all the focus of attention, concern, action and funding – and the latter non at all.
Figure 8: Trend in Male School Teacher Numbers Over Time

Medicine
An illustration of how women’s own preferences lead to differentials in numbers is provided by the medical specialisms preferred by women doctors. I have taken this graphic from Athena SWAN’s own site,
Figure 9
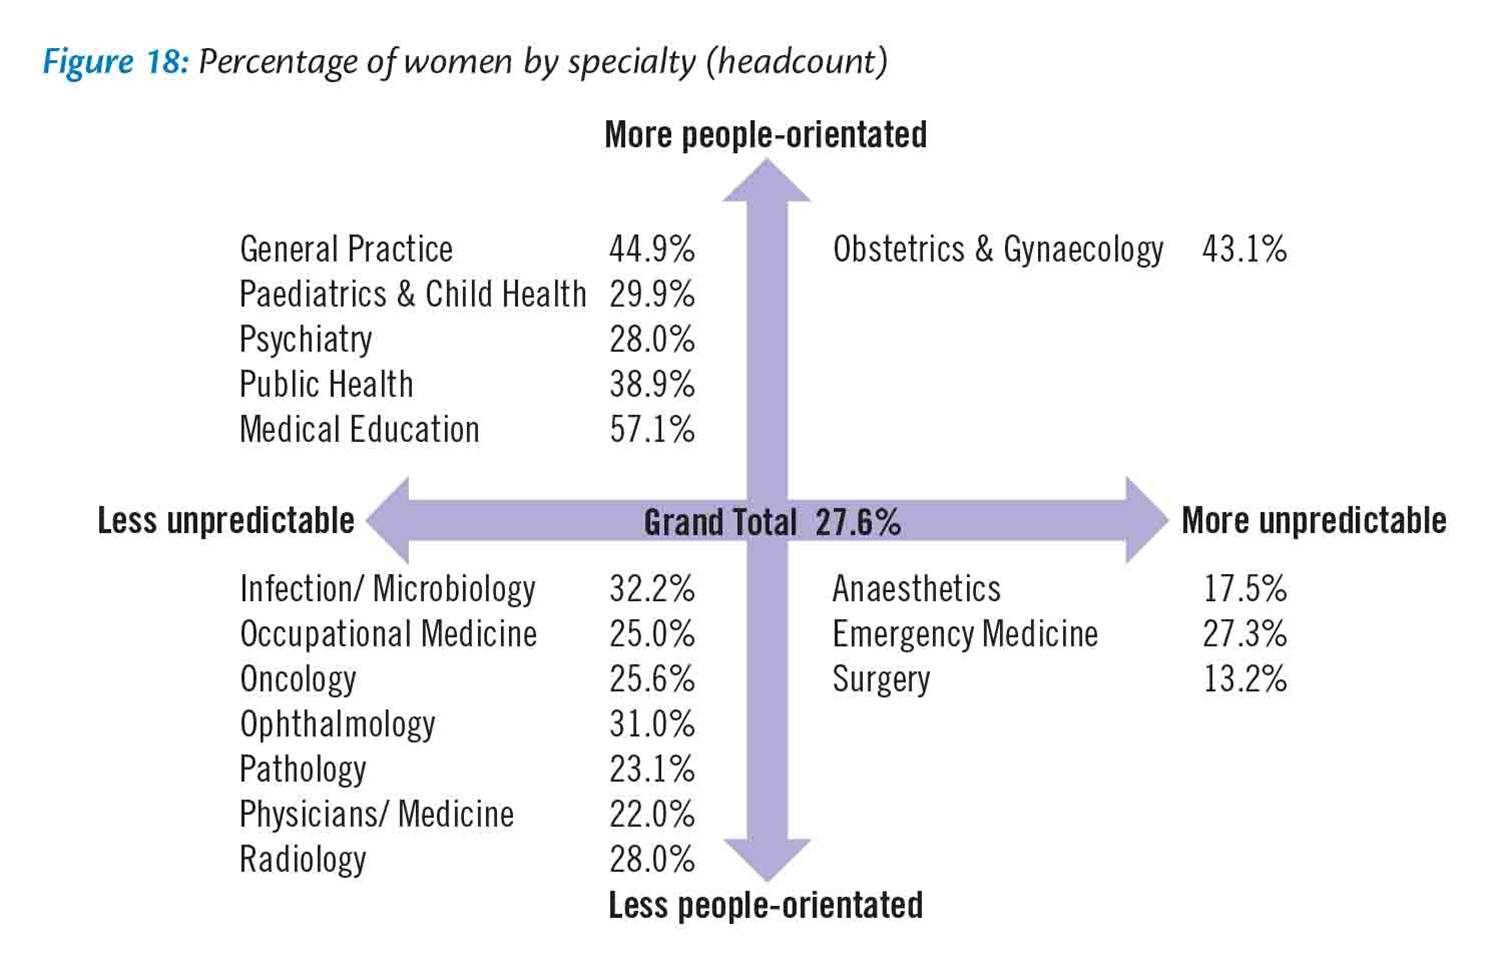
The graphic of Figure 9 must be out of date. In 2014 the proportion of GPs who are women exceeded 50% for the first time, not the 44.9% indicated.
In fact in the last 11 years there has been an increase in female GPs of 50.9% whilst male GP numbers have decreased by 1.1%. With the number of female medical graduates exceeding that of male medical graduates by 30% or more, and with women doctors being particularly inclined to go into general practice, this trend will presumably continue. Will the GP gender skew go the same way as that of teachers?
But Athena SWAN are unconcerned about you being able to find a male GP or that NHS employees are ~81% women.
And in view of the extreme pressure on A&E departments at present, what are we to make of women doctors accounting for only 27.3% of such emergency staff in an era in which there are substantially more women qualifying than men? Perhaps these things are not unrelated.
Athena SWAN make a great deal about the under-representation of women in academic medicine. They take their data from A Survey of Staffing Levels of Medical Clinical Academics in UK Medical Schools as at 31 July 2013, Medical Schools Council, by Siobhan Fitzpatrick, May 2014 . Here I hit an unresolved problem. The data on the number of clinical academic staff given in the Fitzpatrick report bear no relation to those given by HESA which I reproduce in Table 5. The two sources give, for the numbers of clinical academics,
- HESA: 11,825 women and 10,780 men (52% women)
- Fitzpatrick: about 1000 women and about 2,500 men (28% women)
This huge difference is in spite of the Fitzpatrick report stating that “the definitions are aligned to those used by the Higher Education Statistics Agency (HESA), with a view to moving to a single data collection in future“. In the Fitzpatrick report the academic numbers are presented as full-time equivalent (FTE). Just 19% of the clinical academic workforce is reported as working less than full time (34% of women and 13% of men) so any different treatment of full time and part time workers cannot resolve the problem.
Resolving this disagreement is rather important since the HESA data imply that, when all levels of clinical academic staff are combined, women outnumber men, a dramatic contrast with what Athena SWAN assert based on the Fitzpatrick report. It may be that the Fitzpatrick data presents a seriously skewed account by considering only a small subset of the total medical academic workforce. Bearing that in mind, the Fitzpatrick report gives the following data for academic medicine, relating to 2013,
- 17% of Professors are women
- 32% of Senior Lecturers are women
- 42% of Lecturers are women
- Overall 28% of staff are women.
More strikingly, though, is that the number of female medical academics, just like the number of female GPs, has been increasing very steeply. In the nine years 2004 to 2013 the increases in women staff were,
- 40% increase overall (compared with a 3% decrease in the number of men);
- 52% increase at Lecturer grade;
- 20% increase at Senior Lecturer grade;
- 82% increase at Professorial grade.
The Athena SWAN site omits to mention these latter points. Given this rapid increase in women’s representation, including at senior grades, one gets the impression that Athena SWAN are rather pushing at an open door – in fact, a door which is already swinging open wildly.
The Fitzpatrick report also states that whilst 40% of women at Reader/ Senior Lecturer and Lecturer grades work part-time, only 13% of women Professors work part time, comparable to the proportion of part time men (11%). I note that this is consistent with a simple “commitment theory” perspective on progression. Simply put, women get to be Professors by working as many hours as men.
Summary
As customers of education, males are disadvantaged compared with females at all levels: at GCSE, at A Level, at degree level and at postgraduate level.
Girls outnumber boys in gaining A*, A and B grades at A level by 11%, 27% and 36% respectively.
Whilst men outnumber women in gaining HE qualifications in STEM subjects, these account for only 17% of HE qualifications.
Women dominate, and generally emphatically dominate, in subjects which account for the remaining 83% of degrees. This female dominance is also reflected in class of degree obtained.
Three-quarters of school teachers are women. 86% of primary school teachers are women.
Numbers of male and female HE academic staff, combining all subjects and grades, are close to parity (45% women, 55% men).
Including non-academic HE staff, women outnumber men.
In many subjects, there are more women HE academic staff than men. Women dominate HE academic staff numbers in subjects which account for 37% of total HE academic staffing.
Against this background Athena SWAN campaigns for greater numbers of women in senior HE academic staff positions, especially in STEMM subjects, this being the only area where men are dominant. The smaller number of women in senior posts is likely to be largely, if not solely, attributable to the diminishing proportion of women HE academic staff working full-time in the older age range. This reflects the exercise of free choice by these women. Whilst there may be those who would dispute how free this choice is, there is no obvious support from the data for there being systemic “barriers” within the HE institutions preventing women’s progression to the most senior posts. The number of women in senior STEMM posts continues to increase, e.g., as illustrated above for physics and academic medicine. Consequently there appears to be little call for an organisation such as Athena SWAN focused on senior STEMM academic positions, for three reasons,
- Increasing numbers of female senior academic staff are arising naturally in any case;
- Any limitation on parity with men in senior positions is a result of factors lying outside the academic institutions themselves and related to choice;
- The focus on senior staff positions in academic STEMM subjects is fundamentally pernicious since it selects a shrinking island of remnant male dominance for ‘treatment’ whilst ignoring the ocean of male disadvantage in all other areas of education, especially as regards the products of education – the students – as well as school teaching.
Afterword – The Societal Context
The partisan concern over gender issues is not peculiar to education but is universal within our society. It occurs not just in education but in health policies, in the criminal justice system, in paternity rights and the handling of divorce, and in the endless obsession with ending violence against women and girls when it is males who are the majority victims of violence. How has it come about that inequitable concern is being presented as if it were a concern for equality?
The answer lies in popular perception. So ingrained has the myth of male power and male privilege been made, by constant propagandising, that men as a class are seen as undeserving of any consideration. Against this psychological backdrop any decent person will support giving assistance to the underdogs, relentlessly presented to us as being women. This leads to “women’s equality” – that mathematical absurdity, the equality of one thing – which really means maximising (apparent) advantages for women. It promotes special treatment for women – women only shortlists and quotas or targets for women – but applies this only to highly desirable, lucrative, influential occupations, not to the shitty jobs that the vast majority of men do.
Initiatives to assist women in such ways also trigger the atavistic protective instinct in men, an instinct which inclines men to protect women against other men. In this manner, a man will oppose any other men who have the temerity to point out that the proposals are unfair. The One Good Man will see this as an attack on women whom he is programmed to defend. By contrast the truth-sayers are rendered hateful.
This phenomenon is played out all the time in the press, the media, the courts, and all spheres of life. For example, the Health Secretary, Jeremy Hunt, is very happy to claim that “women make better leaders” based, apparently, on the superiority of their sex hormone. If only there was more “oestrogen to dilute the testosterone” then it would, he assures us, “bring an end to a macho and bullying culture in too many parts of the NHS“. Of course, by saying this, he is making himself an exception. There is nothing wrong with his leadership. He has his testosterone under perfect control. He is the One Good Man. Every man seeking to succeed in public life must be a One Good Man. The alternative is to be a hateful misogynist. Very few will brave this accusation, and non who do will rise high. So it is that all would-be alpha males must prove their credentials as a One Good Man. What easier way than to simply denigrate men en masse, thereby suggesting your own superiority.
There is no need for facts to make this type of negative propaganda work. There need not actually be a macho and bullying culture in the NHS, and there need not actually be any evidence that women make better leaders. You can claim anything you like, so long as it paints a positive picture of women and/or a negative portrayal of men, then people will believe it. In this case Hunt’s claim is bolstered by the existing misandric notion of testosterone, which, we are repeatedly told, results in men being aggressive and stupid. That there is no scientific basis for this (Ref.1) does not detract from its usefulness as propaganda.
The link between wanton denigration of men and the spurious legitimisation of female advantage is well illustrated by this same article in which we also find Dame Sally Davies, England’s Chief Medical Officer, criticising other high-achieving women for failing to use their position to advantage other women. Can you imagine the Education Secretary criticising male primary school heads for not preferring male applicants for teachers posts over women? What’s good for the goose is unthinkable for the gander.
References
- Robert M Sapolsky, “The Trouble With Testosterone”. Simon & Schuster (April 1998)