This is an update to my post on excess deaths to October 2022. The methodology of the analysis is the same but the latest ONS dataset (to week 5 2023) has been used, available here.
Data relate to England and Wales.
I concentrate on “non-Covid deaths”, so that any fatal effects of Covid (the disease) is removed from consideration (as opposed to the possible effects of a host of other issues related to Covid).
ONS datasets give weekly data for “deaths involving Covid” and also “deaths due to Covid”. Only the latter relate to Covid having been identified as the cause of death. (The former is likely to mean a death whose principal cause was not Covid, but the individual happened to be Covid-positive). Consequently, I define here “non-Covid deaths” as all deaths minus deaths due to Covid.
I define “excess deaths” as an excess with respect to the average of the five pre-Covid years 2015 to 2019, evaluated on a weekly basis.
Please note that ONS have now departed from this definition of their own “excess death” data. For year 2022, excess deaths reported by ONS are with respect to the average of years 2016, 2017, 2018, 2019 and 2021. For year 2023, excess deaths reported by ONS are with respect to the average of years 2017, 2018, 2019, 2021 and 2022. This is a really silly thing to do – unless it is a deliberate attempt at obfuscation. To change the baseline confuses what the “excess deaths” are supposed to mean. And the inclusion of years 2021 and 2022 in the baseline when Covid was still actively causing deaths is, frankly, bonkers – unless, as I say, if you are trying to cook the books. I hope not. But it is the wrong thing to do, anyway. I use a constant comparison standard throughout – the average of years 2015 to 2019.
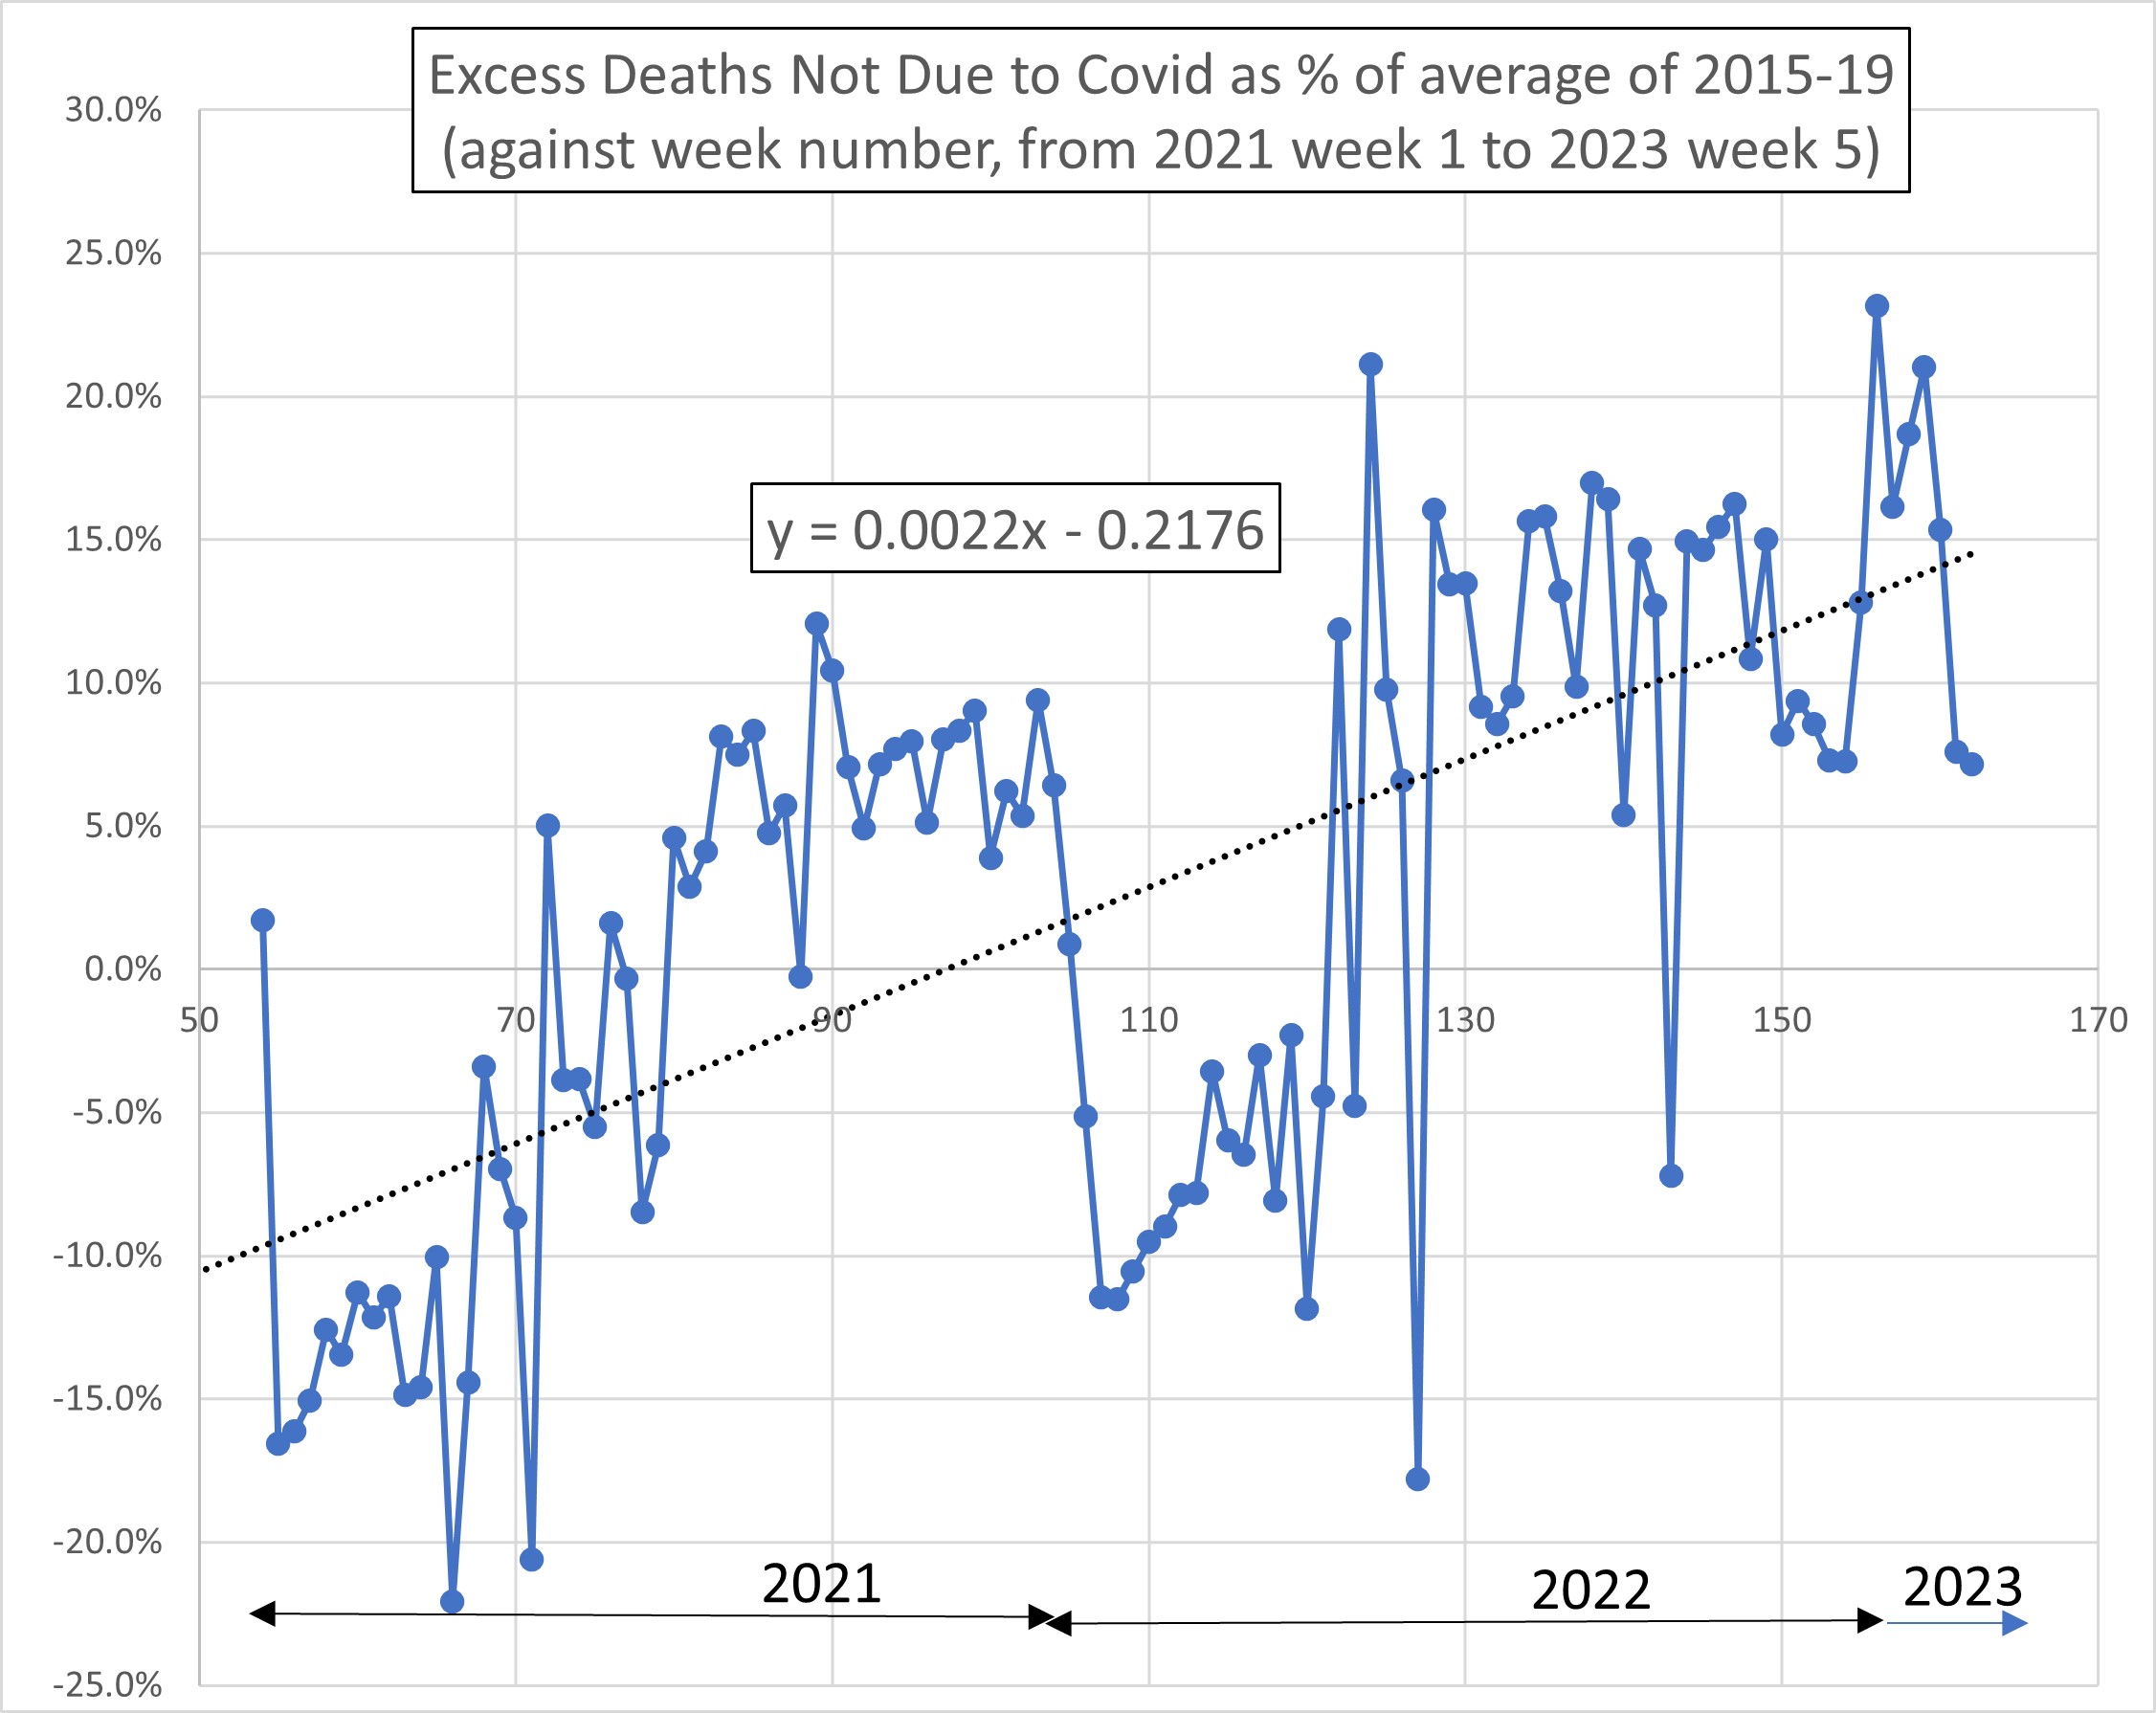
Figure 1 which heads this post shows that the inclusion of 15 further weeks data has not changed the trend compared to my October 2022 post. Based on the trend over the period from 1 January 2021, the number of excess deaths as a percentage of that expected based on pre-Covid years is in creasing at the rate of 11% per year.
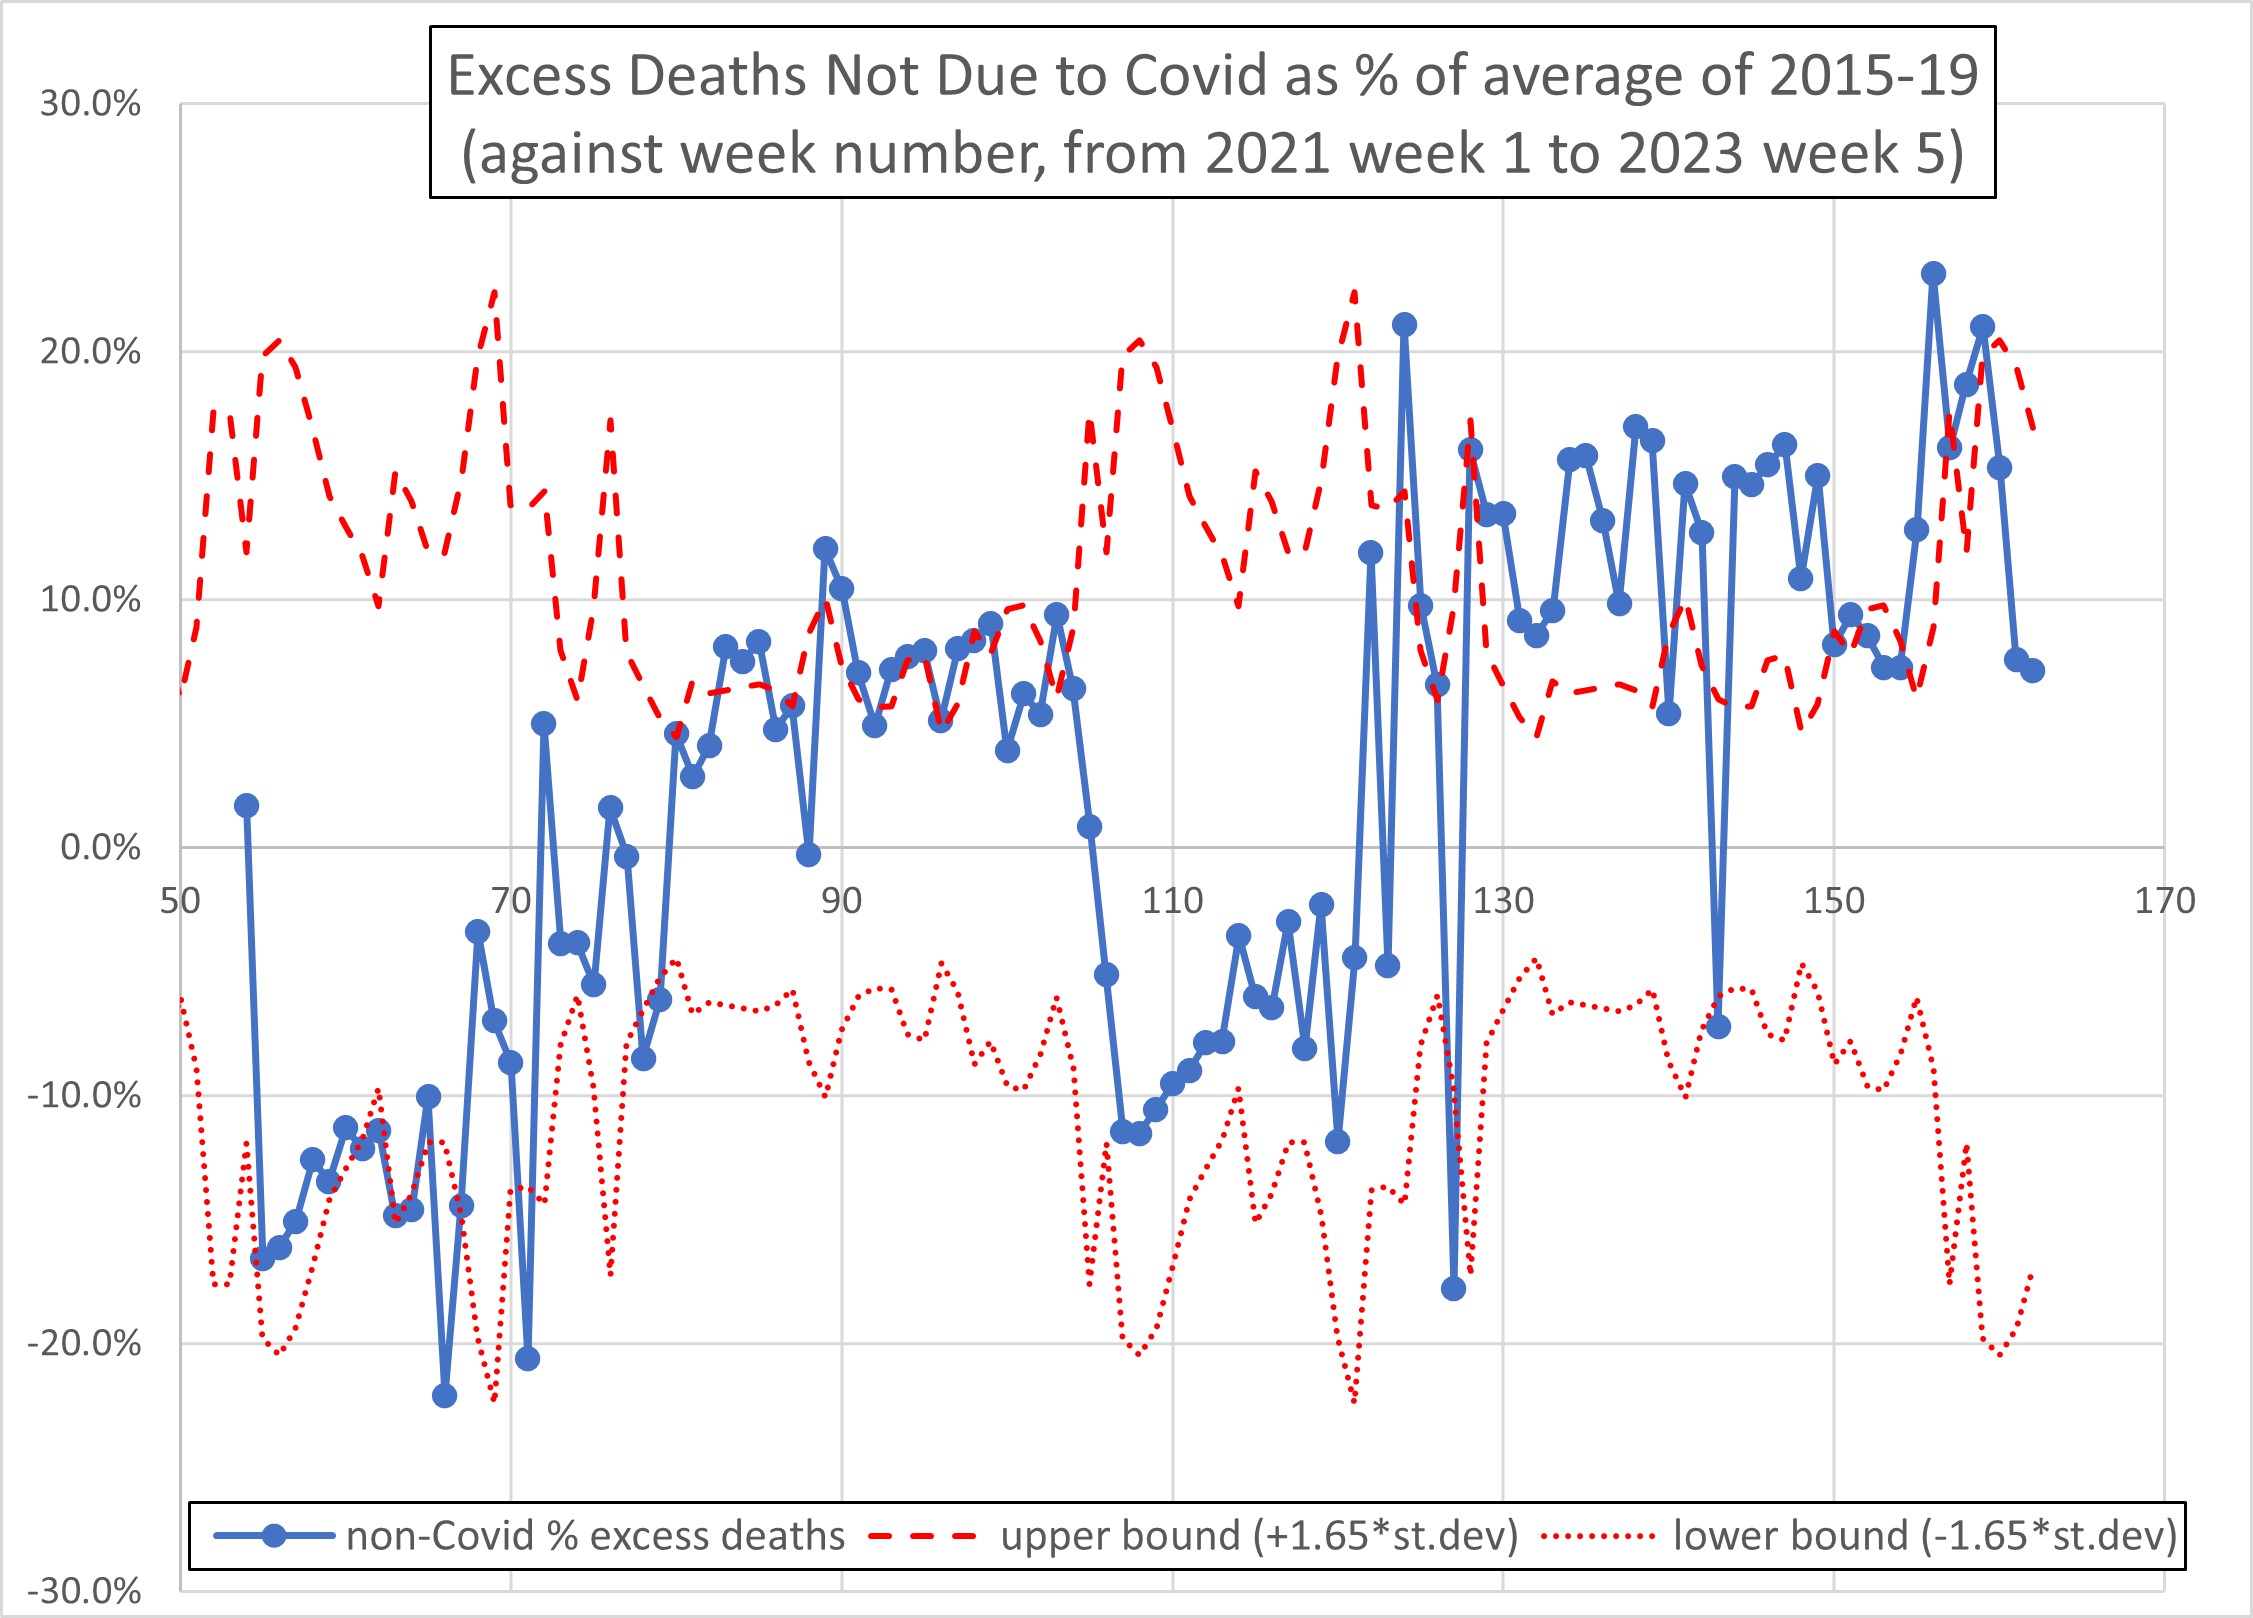
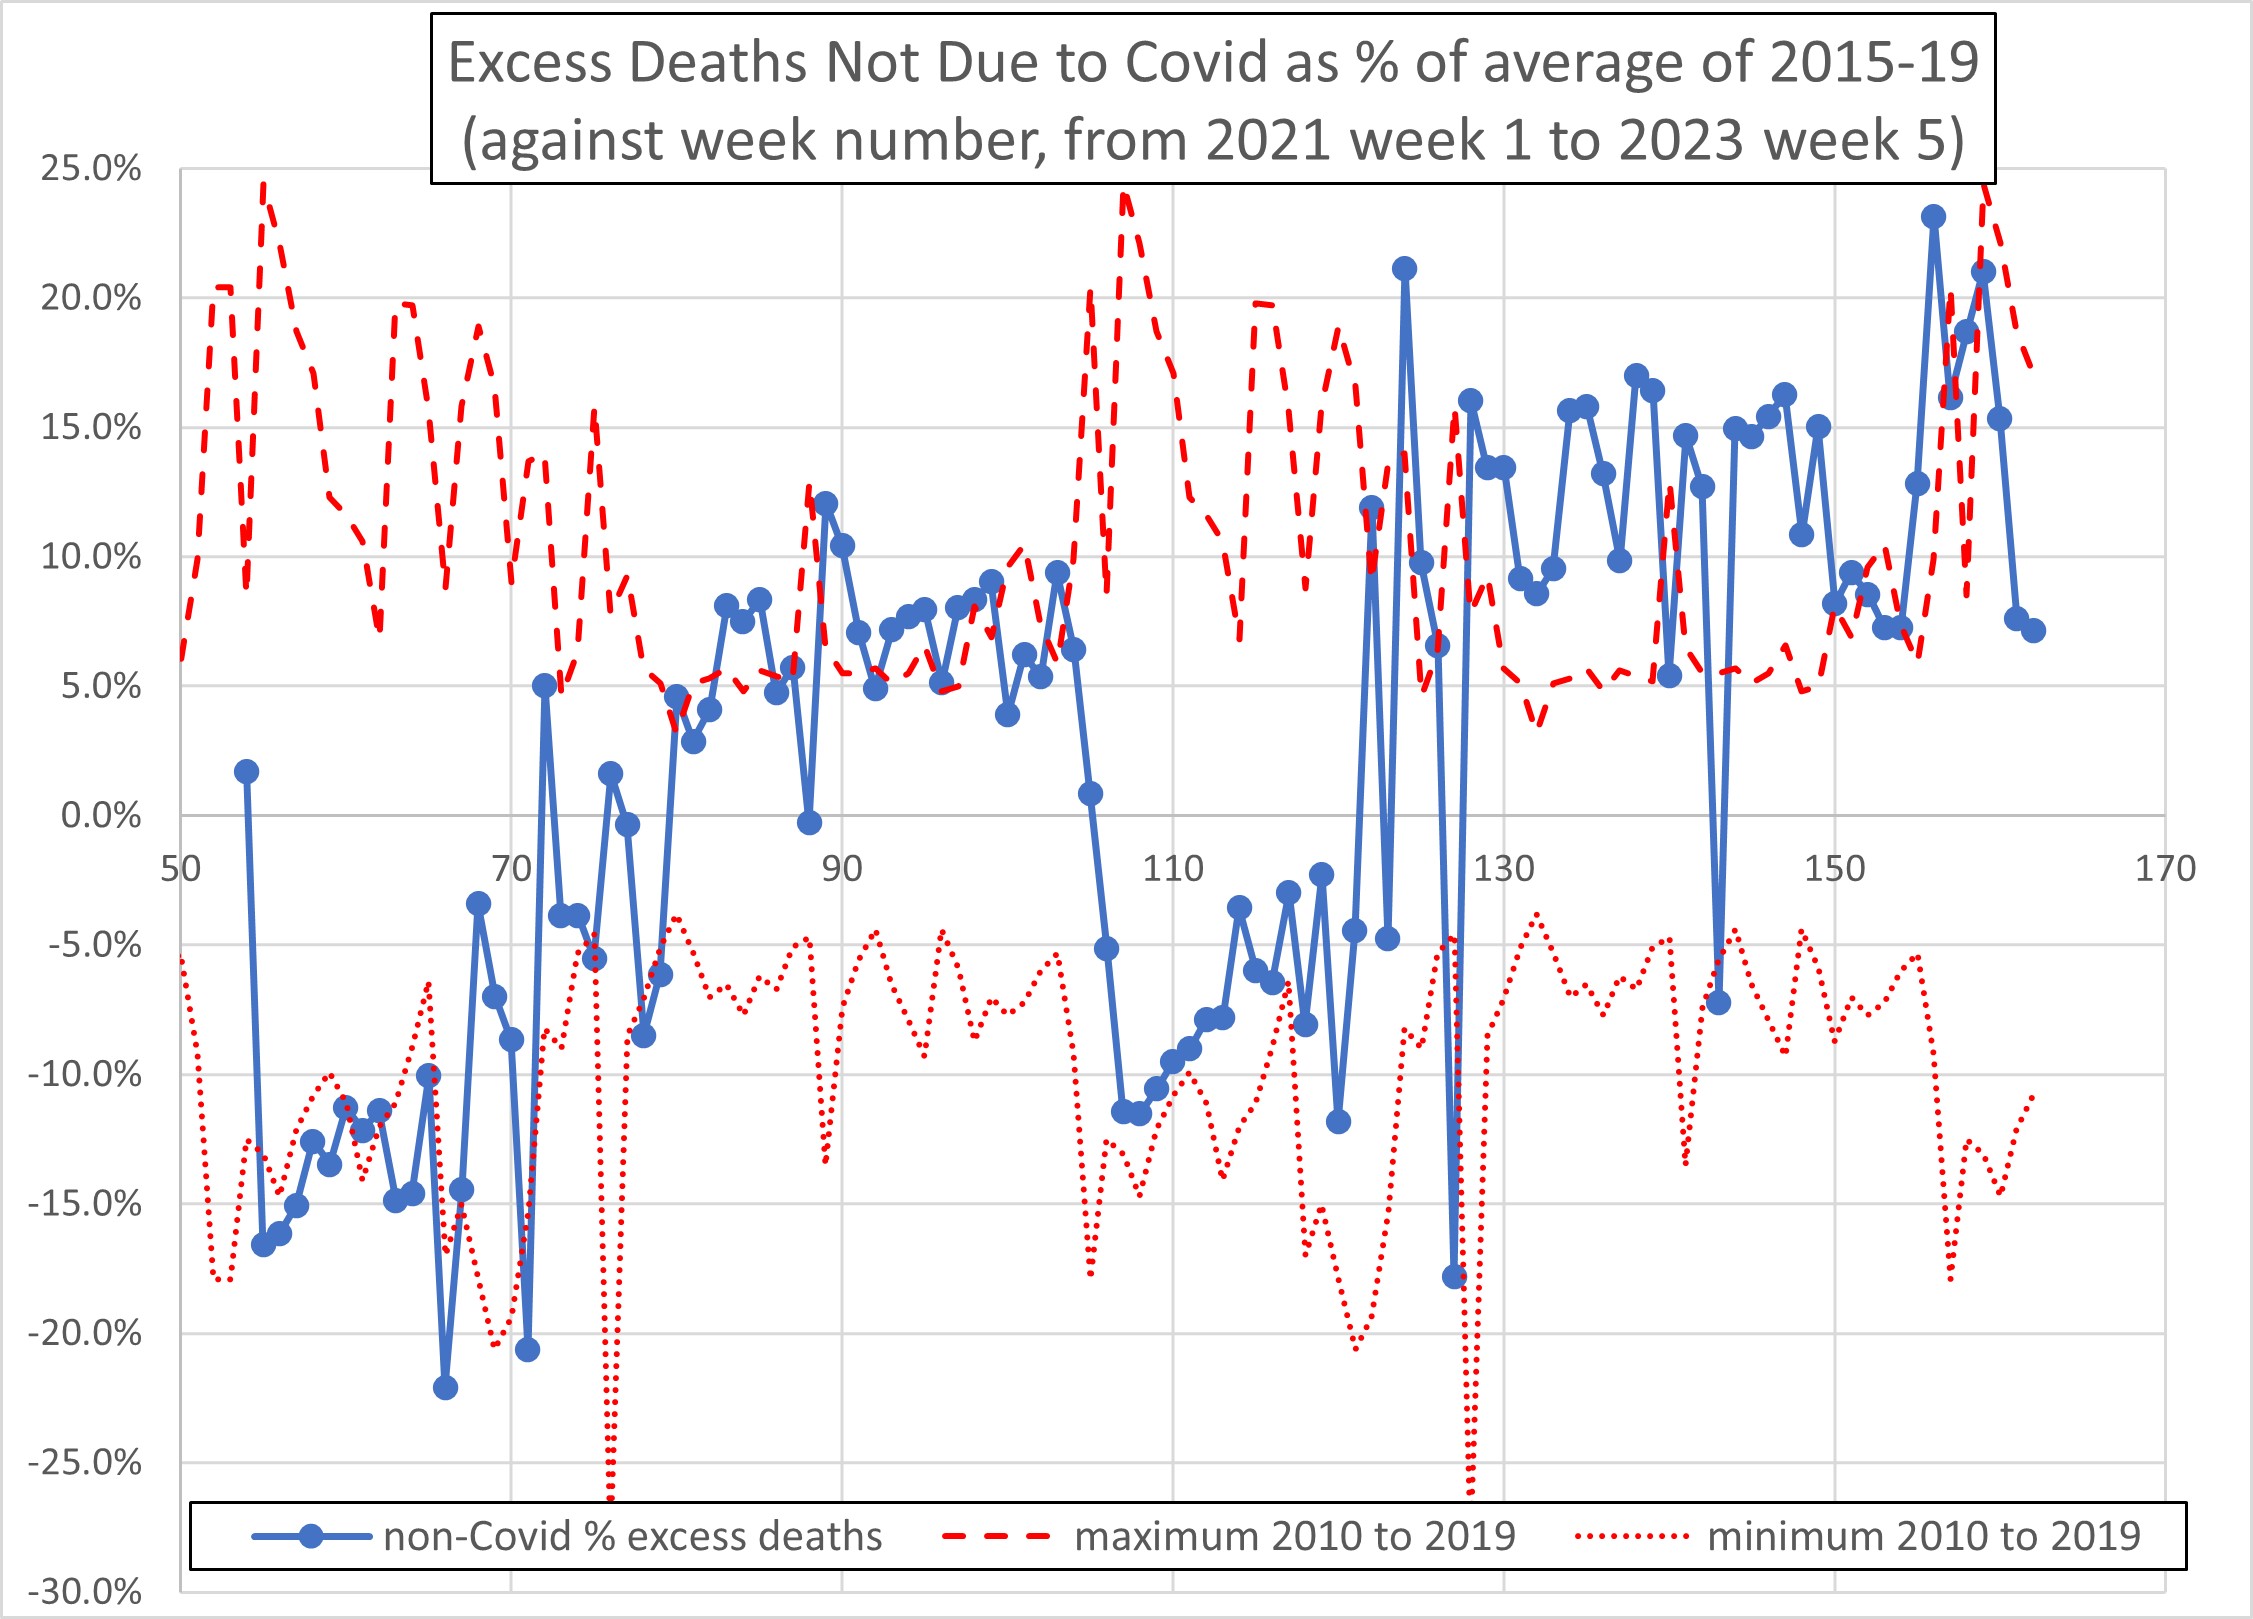
Figures 2 and 3, below, address statistical significance. Figure 2 is based on +/- 1.65 sigma (95%CL), using weekly data for the ten years 2010 to 2019 to evaluate sigma. Figure 3 is based on the largest and smallest percentage difference from the mean across the ten sampled years. These two Figures tell the same story: the excess deaths have significantly exceeded expectation almost every week for 38 consecutive weeks, i.e., they lie above the statistical ‘upper bounds’ calculated on this basis.
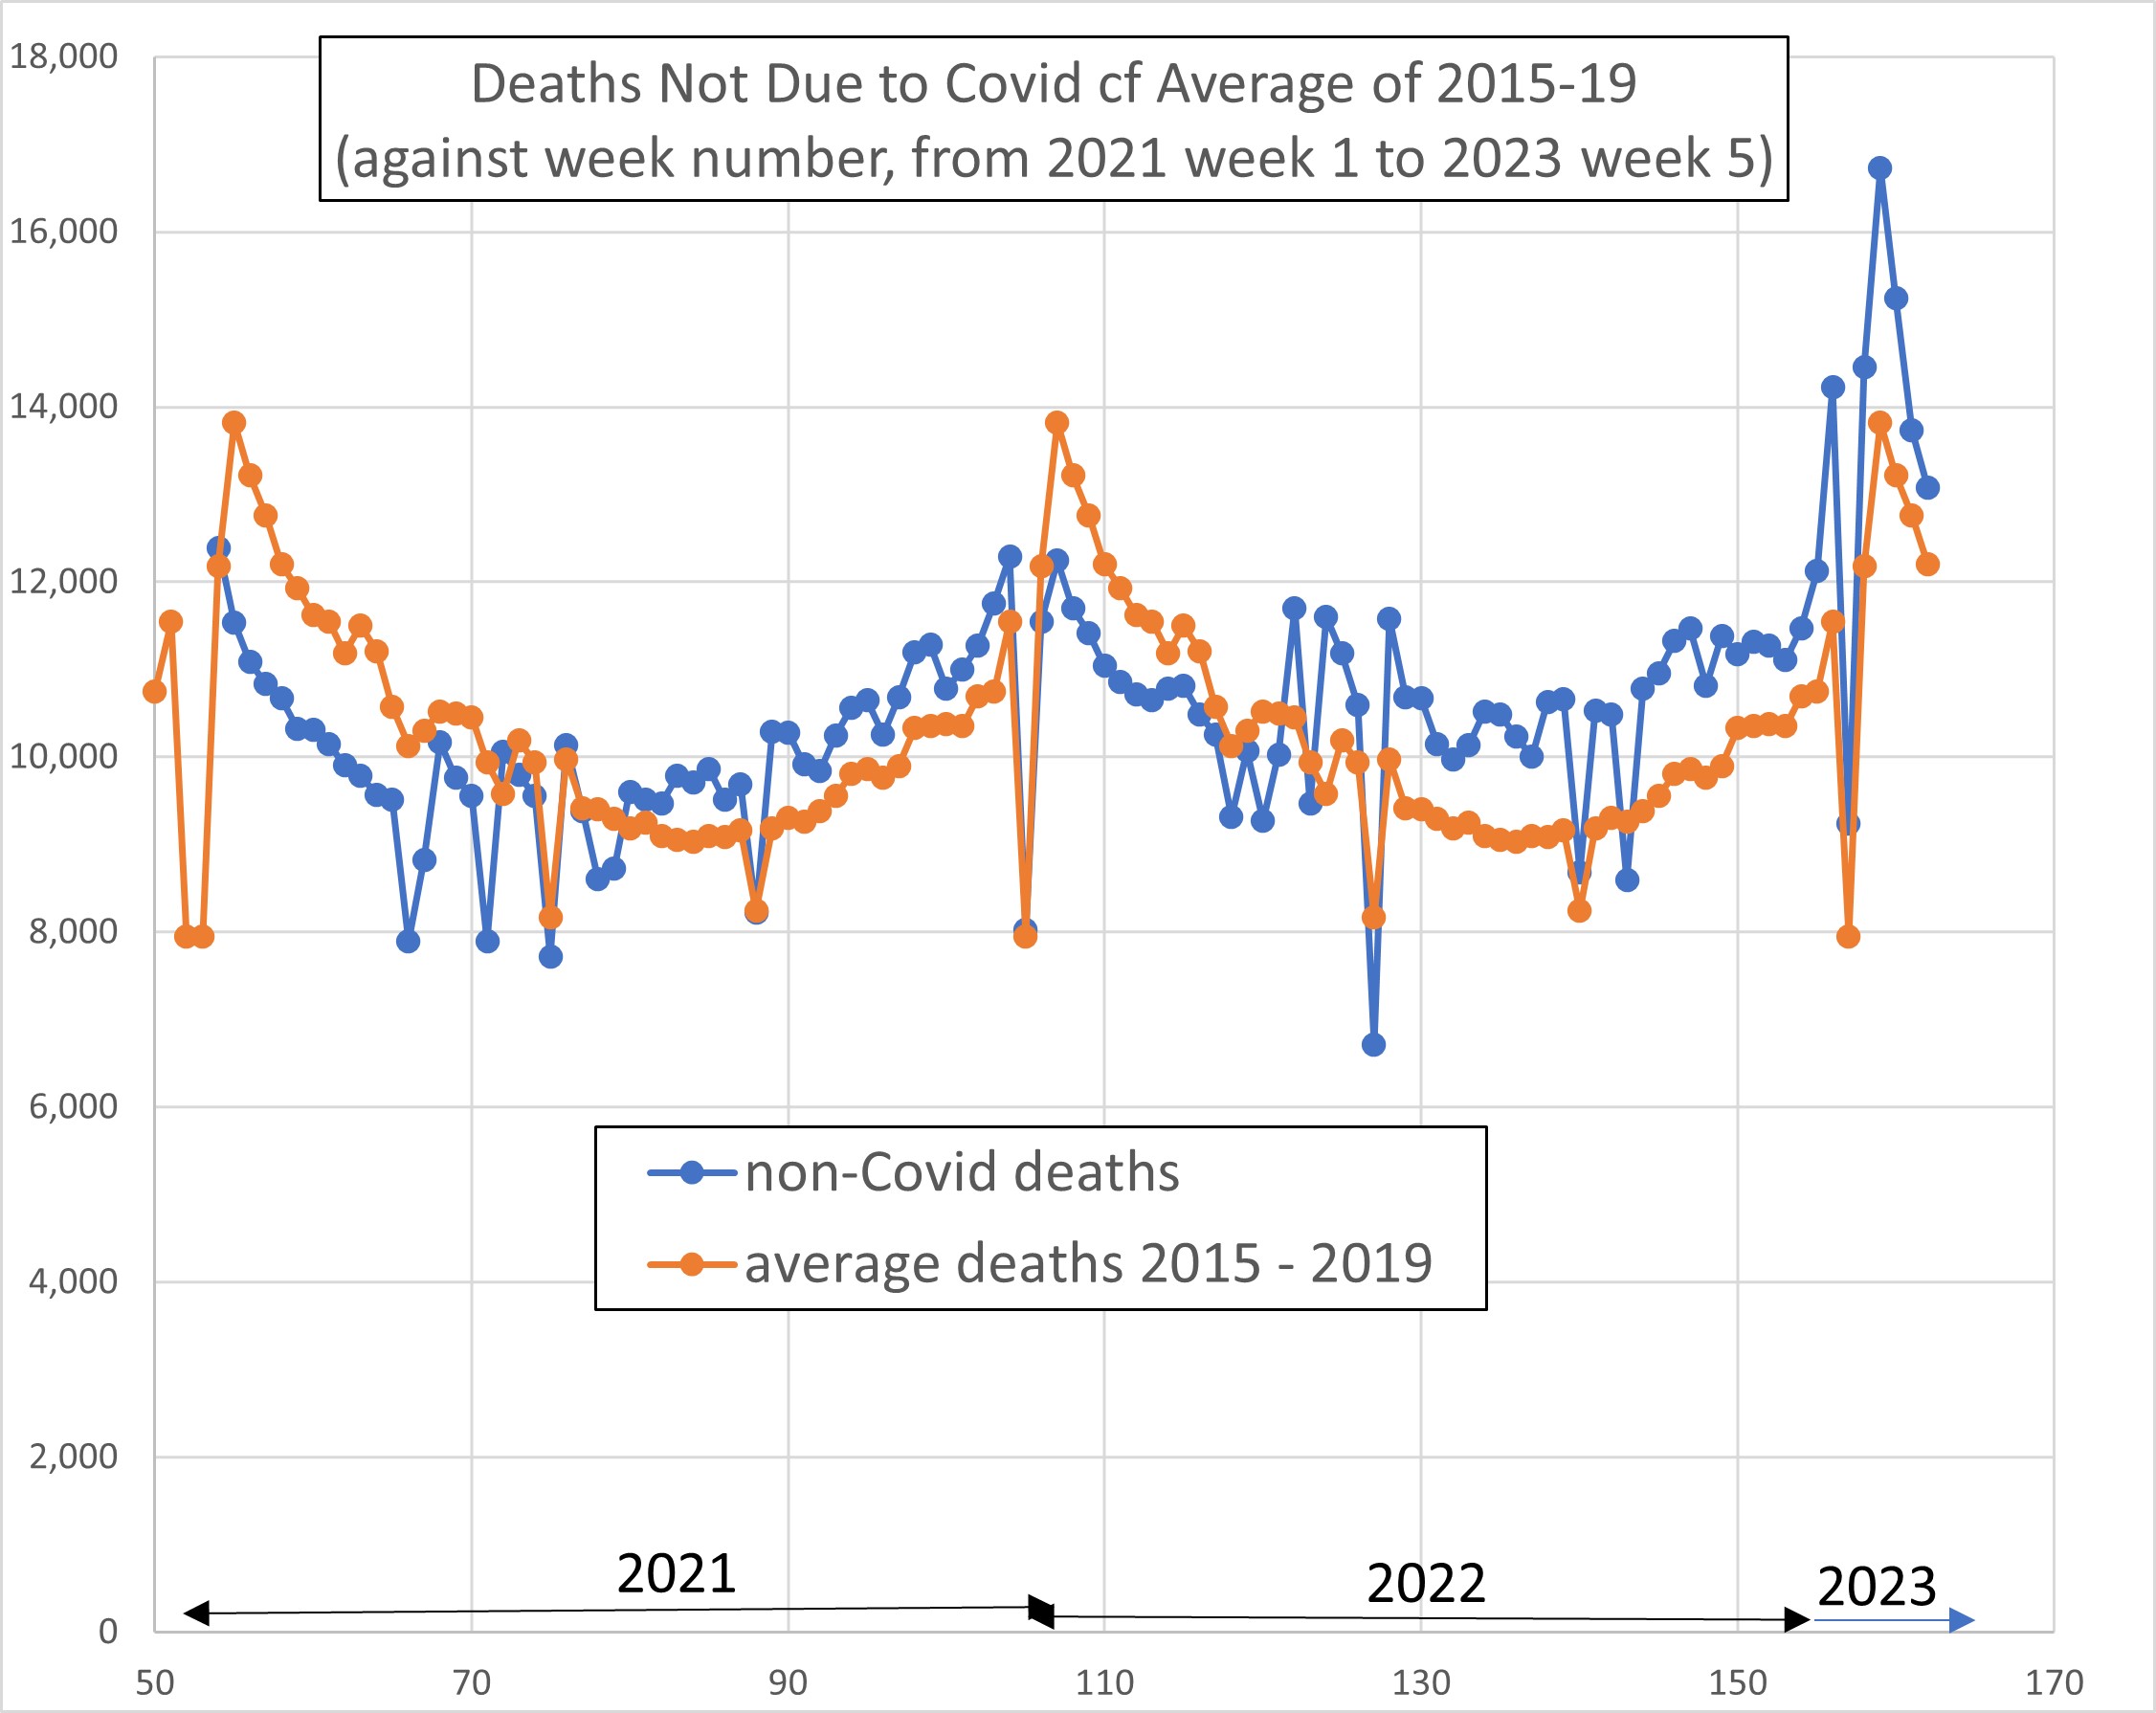
Figure 4 plots the absolute number of deaths, weekly, from January 2021 to present, in comparison with the average of the five pre-Covid years 2015 to 2019.
The dashed line on Figure 1 is the best-fit line, i.e., a linear regression. The significance of the temporal variation is extremely high. For the slope coefficient, t = 9.0, p = 10^-14, F = 81, F-significance = 10^-14, R-squared = 0.43.
Conclusion
This is looking very bad.