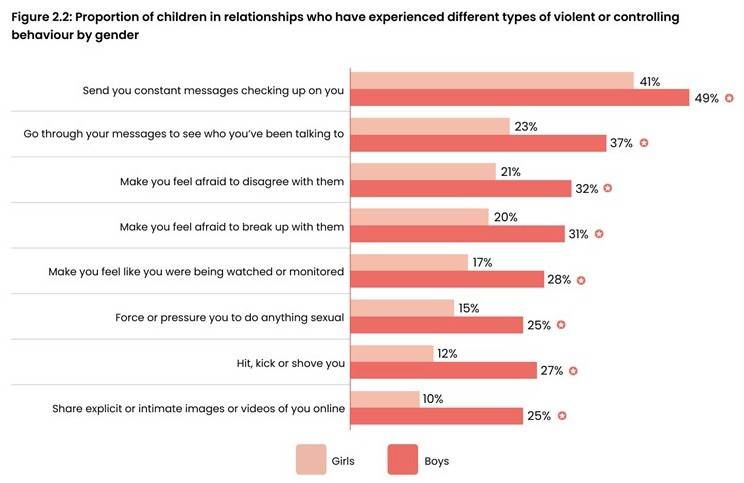
(graphic from Youth Endowment Fund 2024)
This government (and the last) are so concerned about violence against women and girls (VAWG) that the matter is being addressed in a bewildering number of different pieces of primary legislation. Here I pull together the recent vehicles used for that purpose. I address the following in turn,
- Scottish Misogyny Bill (withdrawn)
- Online Safety Act (and Ofcom guidance)
- Protection from Sex-based Harassment in Public Act 2023 (and Public Order Act 1986)
- Crime & Policing Bill (in progress)
- Terrorism Act 2000 (and Prevent)
- The actual empirical evidence about harassment and misandry cf misogyny.
The prejudice against men and boys is palpable throughout. Things are now so bad that even The New Statesman has realised that misandry is the real problem: Why do young women hate men?
1. Background
After extensive consultation, in December 2021 the Law Commission recommended that sex should not be added as a protected characteristic within hate crime laws. In April 2023 the then-Conservative government agreed, stating, “The government agrees with the Law Commission’s recommendation that sex or gender should not be added to the list of protected characteristics for the purposes of aggravated offences and enhanced sentencing”. The Conservative government’s response outlines the practical difficulties inherent in such a ruling. As will be seen below, the current Labour government do not agree and have announced their intention to add sex as an aggravating factor via the Crime & Policing Bill.
2. Scottish Misogyny Bill and the Hate Crime and Public Order (Scotland) Act 2021
I published an article on the planned Scottish Misogyny Bill in February 2025. It was shelved later that year. Ostensibly this was because of the Supreme Court’s ruling on the definition of “woman”. In truth it was an electoral problem for the SNP. In lieu of an explicitly gendered misogyny Act, the Scottish parliament has included sex as a protected characteristic within the Hate Crime and Public Order (Scotland) Act 2021.
Whether an explicit misogyny Bill returns to Holyrood – or perhaps to Westminster – remains to be seen. [Added 20/4/26: Two days after posting this article the Scottish Greens announced their intention to introduce a Misogyny Bill in the next session at Holyrood].
Meanwhile the Westminster government is determined to stamp out misogyny at its source – our schools – by suitable re-education of boys who show signs of dissent – because, as readers will agree, boys have not been vilified enough yet. I recently published an article on this. The graphic which heads that post, and this one, demolishes the government’s position.
3. Online Safety Act and Ofcom’s obligation under VAWG
I published a long, but nevertheless woefully inadequate, critique of the Online Safety Act in December 2023. A few of the highlights (i.e., lowlights) are,
3.1 Two Tier Law
Section 179 says that anyone who “sends a message” which they know to be false and which they intended to “cause non-trivial psychological or physical harm” to its recipient(s) commits an offence liable to up to 51 weeks in prison. You may think that isn’t so objectionable, but the kicker is section 180. This makes the mainstream media immune – they cannot commit an offence under section 179.
So, the rest of us are to be held to rigorous account – but not a “recognised news publisher” and not a body licenced under the Broadcasting Act. And who acts as the Government’s agent in issuing such licences? Ofcom, i.e., the government itself. The BBC, specifically their subfunction “TV Licencing”, is also involved.
You might think that it is more important, rather than less, to enforce rigorous standards on licenced or recognised news sources than upon some blogger with relatively little reach. In other walks of life, being “licenced” suggests a higher standard, not a lower one.
In terms of the prohibition on the rest of us plebs, section 182 makes clear that “sending a message” can mean anything. It can mean a private letter to one other individual. It can mean just a conversation, with no written form, if it is “sent, transmitted or published in electronic form”. It also includes forwarding, in good faith, an article, blog or tweet from another person which is false and which someone, somewhere deems to be harmful, even if you genuinely thought it was correct. The same applies to any hyperlink: you are culpable for what it contains. You may think that this is intended to discourage us plebs from ever writing or saying a word out of fear of the consequences. I couldn’t possibly comment.
3.2 Legal But Harmful
This is a masterstroke for the authoritarian. It is apparently oxymoronic. The requirements of primary legislation define the law (at least, the de jure law). Yet here we have requirements to suppress behaviours being stipulated in primary legislation which the legislation itself classifies as “legal”. Eh? What?
The concept of “legal but harmful” is a masterstroke. It allows the Government and its chosen advisors (the “usual culprits”) to decide upon what “harmful” means (as opposed to a clearly stated law). Moreover, as it is not a criminal offence, due process is bypassed. You are not charged with a criminal offence because you have not committed one, and hence there is no court procedure. Instead these same people declare your “harmful” status and shutdown your communications and perhaps impose swinging penalties upon you. All without the bother of any judicial process deciding upon your guilt. This is one of the mechanisms by which authoritarianism is enacted.
3.3 What does “harmful” mean?
Who is to define, or rule upon, the crucial issue of whether a communication is “harmful”? Section 234 of the Act does not help. It merely states that “harm” means physical or psychological harm. But it appears that the relevant Secretary of State has the power, subject to parliamentary approval, to suppress a wide range of speech and media deemed “harmful”. And who will the Secretary of State rely upon to advise on whether something is harmful? A clue comes in section 54…
3.4 Ofcom’s guidance about protecting women and girls
The Act requires Ofcom to produce guidance for providers of services which (quote) “disproportionately affects women and girls”. The guidance is required to contain advice on best practice for assessing risks of harm to women and girls from online content and advice on reducing such risks. Before producing the guidance the Act required Ofcom to consult (a)the Commissioner for Victims and Witnesses, (b)the Domestic Abuse Commissioner, and (c)such other persons as Ofcom consider appropriate.
Ofcom received 104 responses to their consultation on the guidance.
The Commissioner for Victims and Witnesses made no response to the consultation, though the Commissioner Designate for Victims of Crime for Northern Ireland did respond. The Free Speech union, the Men and Boys Coalition and the charity Parity all made responses (the links are to their responses as reformatted by Ofcom).
Responses were also received from Jess Phillips, MP, Refuge, three Women’s Aid federations (England, Wales and N.Ireland), White Ribbon UK, the Mayor of London, LinkedIn and the Chinese social media platform TikTok.
The response from the Men & Boys Coalition stated, “We fully recognise the disproportionate harm affecting women and girls online and the aims of this guidance”.
Parity’s response stated, “The consultation starts from the presumption that online harms disproportionately affect women and girls. Yet Ofcom’s own data does not support this” (followed by details, which you can find in section 4.2 of my statement on misandry).
Ofcom’s guidance was published in November 2025. It refers to “gender-based harms”. In the matter of “disproportionately affected” Ofcom wrote,
“At consultation, we acknowledged that all online harms may have a gendered dynamic in terms of how they manifest, and therefore, we narrowed in on content and activity that represents, enables or reinforces misogyny, sexism and gender-based violence. We proposed that such content and activity has either a disproportionate or a distinct effect on women and girls online.”
Choosing to “narrow” on “misogyny” will necessarily result in “a disproportionate effect on women” (in fact, 100%).
Note that Ofcom have deviated crucially from the requirements of the Act, broadening the stipulation that only issues which “disproportionately affect women and girls” should be considered to also include “content and activity” with a “distinct effect on women and girls”. The reason, one presumes, is because they know they lack empirical credibility in claiming that exposure to potentially harmful online behaviours “disproportionately affects women and girls” – that claim being refuted by their own research (see below).
4. The Protection from Sex-based Harassment in Public Act 2023
The Protection from Sex-based Harassment in Public Act 2023 established a new criminal offence for public harassment based on sex. It addressed intentional harassment, alarm, or distress caused to individuals in public spaces due to their sex or perceived sex. This Act amends the Public Order Act 1986 by introducing a new offence 4B specifically targeting sex-based harassment in public settings, such as streets, public transport, and venues.
The new offence applies if the conditions of offence 4A are met and is carried out “because of the relevant person’s sex (or presumed sex)”. The conditions for the 4A offence include,
“(1)A person is guilty of an offence if, with intent to cause a person harassment, alarm or distress, he (a)uses threatening, abusive or insulting words or behaviour, or disorderly behaviour, or, (b)displays any writing, sign or other visible representation which is threatening, abusive or insulting, thereby causing that or another person harassment, alarm or distress.”
A charter for snowflakes to criminalise people who disagree with them? Or a provision for an authoritarian State to criminalise and imprison people who disagree with them? Or both?
The new offence, where harassment is deemed as due to sex, increases the maximum sentence from 6 months to 2 years.
The equal rights charity Parity requested the opportunity to comment on the proposed Statutory Guidance before issue. To that end on 2/3/26 Parity sent a polite, informed and well-argued letter to 18 Peers. Concern was expressed that the law would not be implemented in a gender-neutral manner because its introduction within a wider policy framework explicitly oriented around misogyny and Violence Against Women and Girls (VAWG) creates a significant risk of asymmetrical enforcement. Hence there was a very real risk that enforcement structures shaped by sex-specific mandates would produce unequal outcomes. Parity asked to be consulted about what will appear in the Guidance.
Parity received no replies to their letter and did not have the opportunity to comment on the all-important Statutory Guidance which decides on how key terms like “harassment, alarm or distress” are to be interpreted. It was published on 1/4/26. It states,
“The introduction of the new section 4B offence aligns with the Government’s mission to halve violence against women and girls (VAWG) in the next decade. Public sexual harassment is prevalent, and women are disproportionately more likely to be victims than men. This makes the 2023 Act an important part of the protection of women in public places.”
This confirms Parity’s concerns regarding the skew in likely implementation.
The guidance includes this,
“To determine whether the section 4A or 4B offence has taken place, officers must take into consideration the circumstances of each individual case and engage with the victim to understand the impact on them and gather sufficient evidence”. Here “victim” should be “complainant”. The guidance does not mention engaging with the accused to gather evidence.
The offence requires intent to cause harassment, alarm or distress. The guidance states, “Intent is inferred from the evidence, including the words used…(amongst other things)”. It adds, “A person’s intent does not depend on their own characterisation of their language or behaviour”. This means that a person’s intent can be established by someone else’s characterisation of their language or behaviour.
The guidance includes a section “Supporting Victims” stating, “Officers should refer victims to support within 2 working days of a crime being reported…”. What victim? There is only a complainant. When did police officers become social workers? The accused, who is facing a trial and possibly two years in prison, is not mentioned.
The guidance contains no explanation of what the key words “harassment, alarm or distress” mean. The nearest approach to it is this: “As the offence requires proof that harassment, alarm or distress was in fact caused, officers should take all reasonable steps to obtain evidence demonstrating the impact of the alleged conduct on the victim directly. Alongside this, there may be available evidence from witnesses who observed the effect of the behaviour”. In the absence of genuinely unbiased witnesses this suggests that “harassment, alarm or distress” could be adequately established by the complainant’s claims.
At the risk of stating the obvious, there is no objective criteria for harassment, alarm or distress. Moreover, whether an offence has occurred at all depends upon how sensitive is the person in question. What might cause alarm or distress to one person of fragile demeanour might be water off a duck’s back to many others. Having crimes defined by such subjective features provides an ideal opening for prejudice and authoritarianism.
The guidance gives some examples of what behaviours might be indicative of the offence, including “uninvited deliberate touching”.
5. Crime & Policing Bill
The Crime & Policing Bill was advertised by the government as being to, “tackle the epidemic of serious violence, child sexual abuse and violence against women and girls that stains our society, equip the police and others with the powers they need to combat antisocial behaviour, crime and terrorism, and to rebuild public confidence in policing and the wider criminal justice system”. The Bill has passed the Committee stage and had its 3rd reading in both Houses of Parliament and amendments are now (at 18/4/26) being considered.
The government have published their intention to make amendments to the Bill including,
“In our manifesto we committed to “protect LGBT+ and disabled people by making all existing strands of hate crime an aggravated offence” and in response to an amendment tabled at Commons Report stage by Rachel Taylor, the then Minister for Policing and Crime, committed to bring forward an amendment in the Lords to deliver on the manifesto commitment. This new clause does just that. Indeed, it goes further and extends the ambit of the racially and religiously aggravated offences in sections 29 to 32 of the Crime and Disorder Act 1998 not just to cover hostility related to disability, sexual orientation or transgender identity but also hostility motivated by a person’s sex. This change will ensure that tackling misogyny is part of the government’s approach to tackling hate crime. It also ensures it can be embedded within the government’s mission to halve violence against women and girls in the next decade.”
The Bill also addresses the protocols required for recording non-crime hate incidents, another instance of addressing in primary legislation things which are not crimes – and so giving the imprimatur of primary legislation to a pejorative label attached to an individual without any mechanism for his defence. The use of the police in this manner is again a mechanism of authoritarianism.
The Bill also addresses aspects of terrorism, stating that the Secretary of State may by regulations designate a group as an Extreme Criminal Protest Group (“ECPG”) where the Secretary of State reasonably believes that they intend to carry out or promote violence, riot, damage to property or interference with the use or operation of key national infrastructure.
The terrorism part of the Bill may have a gender aspect also, by virtue of…
6. The Terrorism Act 2000
Originally, terrorism was defined as “the use of violence for political ends and includes any use of violence for the purpose of putting the public or any section of the public in fear.”
The 2000 Terrorism Act (plus the 2008 Counter-Terrorism Act) made the definition of terrorism far broader, thus: “an action or threat which is made for the purpose of advancing a political, religious, racial or ideological cause AND involves violence, or serious damage to property, or endangers life, or creates a serious risk to the health or safety of the public or a section of the public, or is designed seriously to interfere with or seriously to disrupt an electronic system.”
Under this definition, hackers might be prosecuted as terrorists though that would require a political, religious, racial or ideological motivation to be demonstrated. Of more concern is the potential for people holding anti-feminist views to be prosecuted as terrorists, because anti-feminism is often conflated with misogyny and “extreme misogyny” (whatever that is) has been suggested to fall within this broad definition (presumably because it is deemed as representing a risk to the safety of women). However to-date (17/4/26) no one in the UK has been prosecuted for misogyny under the terrorism laws (though they have in Canada, so this may be the ultimate direction of travel). Foreign Secretary and then Home Secretary, Yvette Cooper, originally appeared to favour categorising misogyny as extremism, but later backed away from the idea.
The concern that anti-terrorism laws could be used against people who are critical of feminism is not entirely fanciful.
6.1 Prevent
The purpose of the Prevent programme is to prevent terrorism in the UK. In his 2023 report, William Shawcross advised that,
“Prevent must return to its core mission – countering all those ideologies that can lead people to committing or supporting acts of terrorism. … It is correct for Prevent to be increasingly concerned about the growing threat from the Extreme Right. But the facts clearly demonstrate that the most lethal threat in the last 20 years has come from Islamism, and this threat continues”. He then itemised the six terrorist attacks which occurred in the previous three years – all Islamist. Shawcross also emphasised that “Prevent was not doing enough to counter non-violent Islamic extremism”.
Shawcross observed that, “At present, 80% of the Counter Terrorism Police network’s live investigations are Islamist while 10% are Extreme Right-Wing. The fact that only 22% of Prevent referrals for the year 2020-21 concerned Islamism suggests a loss of focus and failure to identify warning signs”.
Shawcross did not consider it appropriate to refer incels to Prevent. He was also critical of the fact that some fairly mainstream conservative commentators and journalists were being referred to Prevent, apparently because being “actively patriotic and proud” or a supporter of Brexit (i.e., most people) was deemed by those making referrals to be sufficient to be labelled “associated with the far-right”.
In his July 2025 review of Prevent, Lord Anderson had a different view on incels, though his report notes that only 1% of Prevent referrals were incels. Lord Anderson also notes that in 2023/24 only 13% of referrals to Prevent were Islamists, an even lower percentage than Shawcross identified and of which he was so critical. Consequently, Shawcross’s concern about Prevent’s loss of focus remains valid. In contrast, 19% of referrals were classed as “extreme right-wing”. And yet the empirical evidence, based on Home Office Statistics on Terrorist-Related Arrests, is that,
- It is highly likely Extreme Islamist Terrorism will remain the predominant terrorist threat to the UK and makes up the majority of terrorism related prisoners in the previous year. Figures published by the Home Office in September 2023 indicated that operations to counter Extreme Islamist Terrorism accounted for approximately three quarters of MI5’s case work between 2018 and 2023.
- The majority (63%) of those in custody (for terrorist offences) were categorised as holding Extreme Islamist ideologies, while a further 28% were aligned with Extreme Right-Wing ideologies.
- The government list 84 proscribed terrorist groups or organisations (not including Northern Ireland) of which 63 (75%) are Islamist, 10 (12%) are left-wing extremist, 9 (11%) are right-wing extremist and 2 (2%) are Sikh groups. Of the right-wing extremist groups, 2 are based in the USA, 2 in Russia, 1 in Germany, 1 in the UK, and 3 unclear/transnational.
I mention these rather off-topic issues to indicate that Prevent is still not working to meet its actual purpose and that there are voices arguing to extend its remit beyond that initial purpose, as follows,.
Lord Anderson’s report focus’s on two recent cases, (i) Ali Harbi Ali, the Islamist terrorist who murdered Sir David Amess MP in October 2021 and had been referred to Prevent by his school in 2014, and, (ii) Axel Rudakubana who killed three young girls and injured many other people in a dance workshop in Southport in July 2024, when he was 17. He was not sentenced as a terrorist but had been referred to Prevent by his school three times between 2019 and 2021.
Anderson uses the Rudakubana case to argue for an extension of Prevent’s remit beyond those with an ideology. He wrote, “Linked to the case of Rudakubana is a policy issue of considerable importance for the future: whether “violence-fascinated individuals” or VFIs, who have no particular ideology but may have the potential to commit crimes with strong similarities to acts of terrorism should continue to be accommodated within Prevent. I explore this issue at 5.4-5.29, and conclude that they should.”
That might be so, but my concern would then be where the line would be drawn, and this is my purpose in raising these matters. There are concerning elements in Anderson’s report which are relevant to this post. He wrote, “Male-on-female attacks are motivated in often unknowable proportions by violent pornography, normalised misogyny, incel ideology, family dynamics and personal rejection”. Here there is a footnote which one hopes would provide empirical evidence for those claims, but unfortunately we read this,
“Many of these themes feature in the fictional 2025 Netflix series Adolescence. The series has increased adult awareness but seemed behind the curve to a CSO representative conducting school outreach around the country, who commented to me: “Youth are buying Airbnbs from the proceeds of money muling … creating horrible AI porn. They will not wait around while adults learn about incels and become social media literate”. “We are probably bitter and twisted”, she added, “but this is an epidemic.”
I will resist the temptation to comment further. I will just add that I am personally far more worried about the views implicit in the above – the establishment perspective – than I am about terrorism.
Empirical evidence on harassment and misandry cf misogyny
My own personal statement on misandry includes data from many surveys on harassment, domestic abuse and sexual assault by sex, as well as academic publications on misandric and misogynistic attitudes among adults and children of both sexes. Importantly, the impact of misandry on men and boys is also addressed.
This is augmented by an even more extensive set of relevant academic publications relating to the above issues and including in-group versus out-group preference, gender attitudes and typecasting as villains or victims (gamma bias)
I cannot summarise those links due to their shear volume – and that is part of the message. I would urge you to flick through them, especially the second. As noted above, Ofcom’s own surveys are inconsistent with their claim that exposure to potentially harmful content online “disproportionately affects women and girls”. Ofcom reports from 2022 and 2024 both conclude that men were more likely than women to have experienced potentially harmful online behaviour or content.
The studies show the same broad tendencies in children and adolescents as is found for adults, i.e., women/girls tend to have a negative attitude towards men/boys whereas men/boys tend not to have a negative attitude towards women/girls. The graphic which heads this post suggests that boys may be subject to more controlling behaviours in their relationships than are girls. Data from the USA indicates that boys and girls experience similar rates of potentially harmful sexual material, behaviours and exploitation online.
As I noted at the start, things are now so bad that even The New Statesman has realised that misandry is the real problem: Why do young women hate men? In April 2025 Erica Coppolillo published an article in Nature’s Scientific Reports “Women who hate men: a comparative analysis across extremist Reddit communities”. Her conclusion: “The performed analyses reveal that no systematic differences can be devised across the misogynistic and misandric communities”.
All these findings, on children and adults, are opposite to the dominant sociopolitical narrative. The academic papers also shed light on the psychological reasons why the government and their advisors are inclined to focus concern and protection on women and girls but only condemnation on men and boys, despite this being in conflict with the evidence. The reason is gamma bias…or the empathy gap, if you prefer.