Headline finding: 5,446 more girls do maths A Level than boys do physics A level.
******************
I concentrate on the top grades, A*, A and B. Data is taken from Brian Stubbs site.
Across all subjects, female A level candidates outnumbered male candidates by 22.1% (360,623 male cf 440,379 female, counting each subject separately).
Across all subjects, boys obtained a higher percentage of the top A* grade, but girls obtained a marginally higher percentage if grades A and A* are combined, and a higher percentage of grades A*, A and B combined (Table 1).
Table 1: All Subjects – Percentage of Candidates of Same Sex
| grade | A* | A | B |
| Boys | 8.2 | 17.2 | 24.4 |
| Girls | 7.5 | 18 | 27.5 |
Adding the number of candidates in the three physical sciences (biology, chemistry and physics) there were more female than male candidates (84,111 cf 83,133). Adding the number of awards at grades A*, A or B in these three physical sciences, the total was greater for girls than boys (41,029 cf 40,620). As noted for the O Level results, this is consistent with women having been dominant in the pure sciences as university undergraduates for many years.
The most popular subjects for girls, in order, were,
- English (61,730)
- Psychology (48,098)
- Biology (43,555)
- Maths (35,605)
Girls were 39% of candidates in maths.
The most popular subjects for boys, in order, were,
- Maths (56,290)
- Economics (30,841)
- Physics (30,159)
- Chemistry (27,333)
Note that there are substantially fewer boys taking Physics than girls taking Maths. So why the angst about girls and maths?
Boys were barely more than one-quarter (25.9%) of candidates in English, English Language and English Literature. This account by a young man studying English A Level may help explain the subject’s lack of popularity with males.
Results can be expressed in two ways,
- in terms of the percentage of candidates of each sex being awarded each grade, or,
- in terms of the number of candidates of each sex being awarded each grade.
Both are important. [1] indicates the quality of the candidates. But the quality is of little significance if the quantity is woeful, the quantity being measured by [2]. I address quantity first…
Quantity
Table 2 (relegated to the Appendix at the end of this article) lists 27 subjects and gives the percentage excess of girls over boys who were awarded grades A*, A or B in each subject, i.e., 100(g-b)/b, where g and b are the numbers of girls and boys respectively being awarded the grade in question. Negative values indicate an excess of boys over girls. The Table does not cover every A Level subject but I believe I have captured all the major subjects. Figures 1 and 2 are more easily digested.
Figure 1 shows the data of Table 2 in histogram form for the first 17 subjects, and Figure 2 is the same for the last 10 subjects. The first 17 subjects plotted in Figure 1 were chosen so that the excess of girls over boys does not exceed 100% (at least, not by much). In contrast, the ten subjects plotted in Figure 2 all have more than 100% more girls than boys achieving grades A*, A and B.
Figure 1:
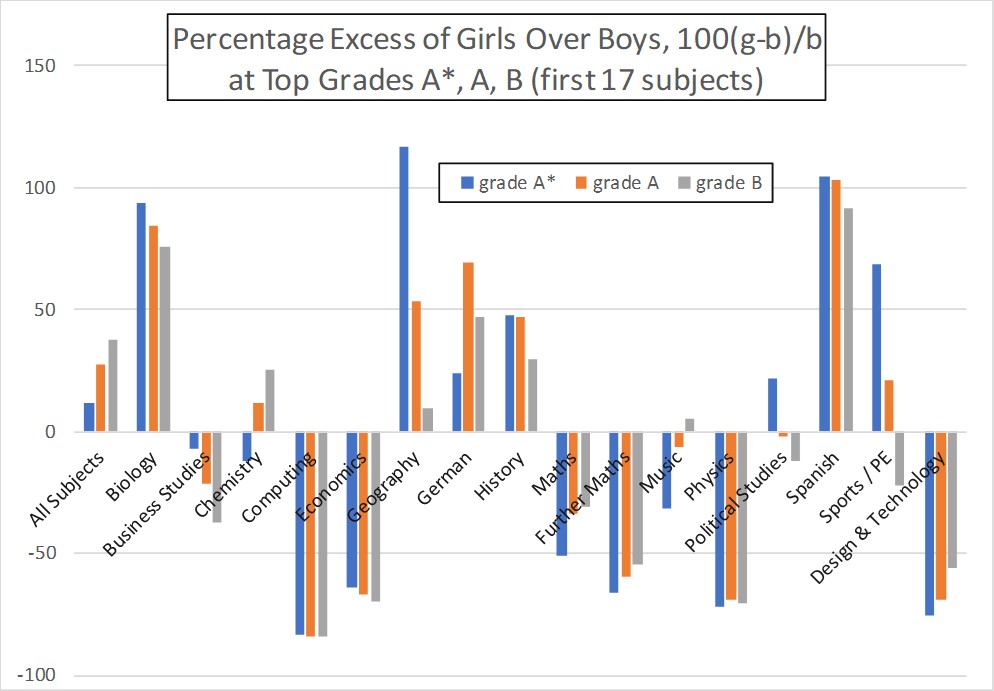
Figure 2:
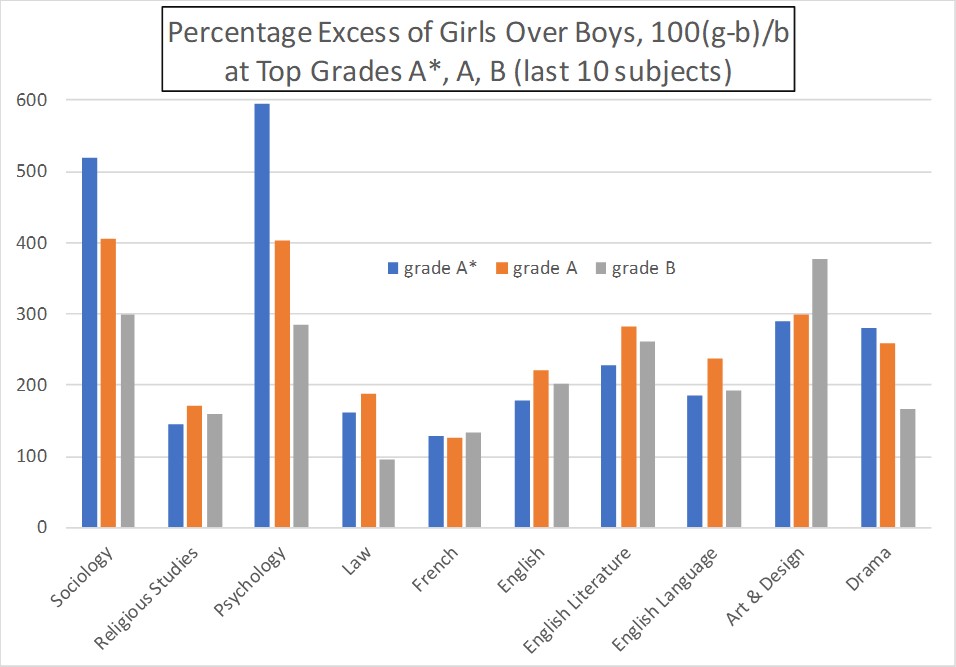
Six times more girls than boys achieved a grade A* in sociology, and seven times more in psychology.
More than twice as many girls as boys achieved each of grades A*, A and B in Religious Studies, Law, French, English, English Language, English Literature, Art & Design, Drama and Spanish. Biology is also close to having twice as many girls obtaining top grades.
Girls also outnumber boys in the top grades in German, Spanish, Geography, History and Sports / Physical Education.
Subjects which are borderline in terms of numbers of each sex obtaining top grades are Chemistry, Music and Political Studies.
There were 7 subjects out of 27 in which the number of boys obtaining the top grades exceeded the number of girls. These were Business Studies, Computing, Economics, Maths, Further Maths, Physics and Design & Technology.
Across all subjects, girls were awarded 12% more A* grades, 28% more A grades and 38% more B grades. This is the measure of female dominance in terms of quantity.
Quality
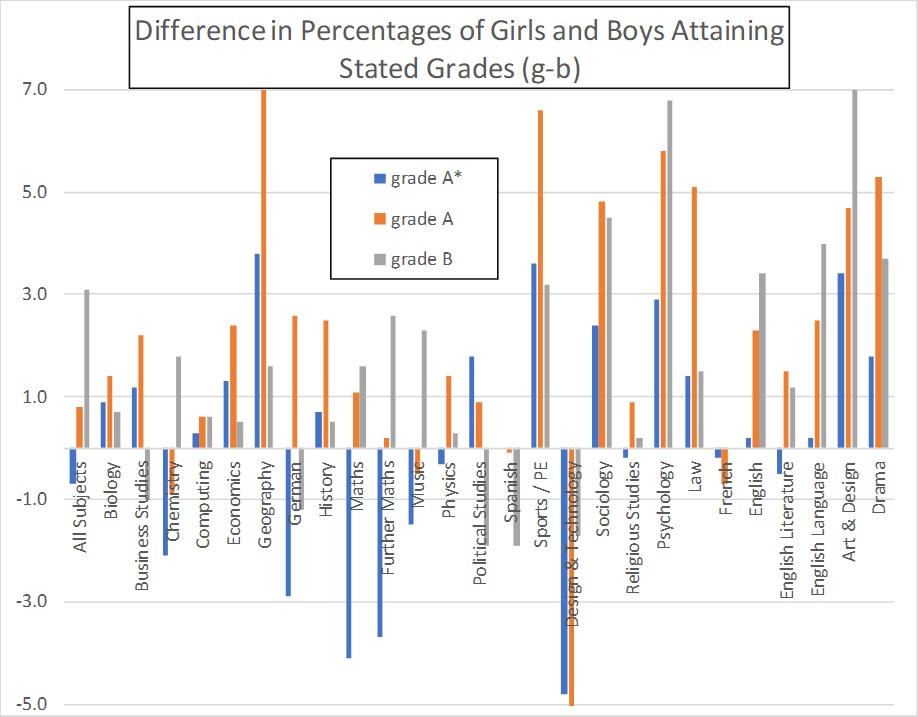
Table 3 (in the Appendix) lists the same 27 subjects giving the percentage of candidates of the same sex attaining grades A*, A and B. The difference in this percentage, (g-b),is plotted as a histogram by subject in Figure 3. Positive values indicate that girls perform better than boys; negative values indicate that boys perform better than girls. Blue bars indicate grade A*, orange grade A and grey grade B. A glance at Figure 3 reveals that,
- Girls generally outperform boys (far more positive bars);
- But, where boys do perform better, they tend to do so at the top grade A* (negative bars are predominantly blue).
To quantify the latter observation,
- Boys do better at grade A* in 11 of the 27 subjects (i.e., not far off half);
- Boys do better at grade A in only 5 of the 27 subjects;
- Boys do better at grade B in only 5 of the 27 subjects;
Hence, girls also outperform boys as regards quality of result, as well as in quantity. However, at the highest grade (A*), there is near-parity in terms of quality.
Figure 3:
Appendix
Table 2: Percentage excess of girls over boys obtaining stated grades
| % excess of girls, 100*(g-b)/b | |||
| A* | A | B | |
| All Subjects | 12 | 28 | 38 |
| Biology | 94 | 84 | 76 |
| Business Studies | -7 | -21 | -37 |
| Chemistry | -12 | 11 | 26 |
| Computing | -83 | -84 | -84 |
| Economics | -64 | -67 | -69 |
| Geography | 117 | 53 | 10 |
| German | 24 | 69 | 47 |
| History | 48 | 47 | 30 |
| Maths | -51 | -34 | -31 |
| Further Maths | -66 | -60 | -55 |
| Music | -31 | -6 | 5 |
| Physics | -72 | -69 | -70 |
| Political Studies | 22 | -2 | -12 |
| Spanish | 104 | 103 | 91 |
| Sports / PE | 68 | 21 | -22 |
| Design & Technology | -75 | -69 | -56 |
| Sociology | 520 | 405 | 299 |
| Religious Studies | 146 | 171 | 159 |
| Psychology | 594 | 403 | 284 |
| Law | 161 | 189 | 96 |
| French | 128 | 126 | 132 |
| English | 178 | 221 | 203 |
| English Literature | 227 | 282 | 261 |
| English Language | 185 | 238 | 192 |
| Art & Design | 290 | 298 | 378 |
| Drama | 280 | 258 | 167 |
Table 3: Percentages of candidates of same sex awarded stated grades
| percentages of those graded | |||
| A* | A | B | |
| All Subjects | |||
| Boys | 8.2 | 17.2 | 24.4 |
| Girls | 7.5 | 18 | 27.5 |
| Biology | |||
| Boys | 6.4 | 16.3 | 20.4 |
| Girls | 7.3 | 17.7 | 21.1 |
| Business Studies | |||
| Boys | 2.8 | 10.6 | 29.5 |
| Girls | 4 | 12.8 | 28.5 |
| Chemistry | |||
| Boys | 8.7 | 22 | 22.2 |
| Girls | 6.6 | 21.1 | 24 |
| Computing | |||
| Boys | 3.4 | 14.4 | 22.3 |
| Girls | 3.7 | 15 | 22.9 |
| Economics | |||
| Boys | 6.3 | 21.5 | 28.7 |
| Girls | 7.6 | 23.9 | 29.2 |
| Geography | |||
| Boys | 3.5 | 14.8 | 28.6 |
| Girls | 7.3 | 21.8 | 30.2 |
| German | |||
| Boys | 14.7 | 26.7 | 25.3 |
| Girls | 11.8 | 29.3 | 24.1 |
| History | |||
| Boys | 4.5 | 16.3 | 31.2 |
| Girls | 5.2 | 18.8 | 31.7 |
| Maths | |||
| Boys | 18.1 | 24 | 17.5 |
| Girls | 14 | 25.1 | 19.1 |
| Further Maths | |||
| Boys | 25.8 | 28.7 | 19.4 |
| Girls | 22.1 | 28.9 | 22 |
| Music | |||
| Boys | 5.2 | 15.2 | 25.7 |
| Girls | 3.7 | 14.7 | 28 |
| Physics | |||
| Boys | 8.8 | 18.8 | 22.5 |
| Girls | 8.5 | 20.2 | 22.8 |
| Political Studies | |||
| Boys | 5.9 | 18.8 | 30.6 |
| Girls | 7.7 | 19.7 | 28.7 |
| Spanish | |||
| Boys | 10.1 | 25.2 | 30.5 |
| Girls | 10.1 | 25.1 | 28.6 |
| Sports / PE | |||
| Boys | 2.5 | 8.8 | 24.8 |
| Girls | 6.1 | 15.4 | 28 |
| Design & Technology | |||
| Boys | 10.2 | 23 | 28.4 |
| Girls | 5.4 | 15.3 | 26.7 |
| Sociology | |||
| Boys | 2.9 | 9.8 | 25.5 |
| Girls | 5.3 | 14.6 | 30 |
| Religious Studies | |||
| Boys | 4.5 | 16.9 | 28.5 |
| Girls | 4.3 | 17.8 | 28.7 |
| Psychology | |||
| Boys | 2.1 | 8 | 21.5 |
| Girls | 5 | 13.8 | 28.3 |
| Law | |||
| Boys | 3.3 | 8.9 | 22.8 |
| Girls | 4.7 | 14 | 24.3 |
| French | |||
| Boys | 10.2 | 27.2 | 30.5 |
| Girls | 10 | 26.5 | 30.5 |
| English | |||
| Boys | 5.5 | 11.8 | 26.7 |
| Girls | 5.7 | 14.1 | 30.1 |
| English Literature | |||
| Boys | 9 | 14.3 | 28 |
| Girls | 8.5 | 15.8 | 29.2 |
| English Language | |||
| Boys | 1.7 | 7.7 | 28.1 |
| Girls | 1.9 | 10.2 | 32.1 |
| Art & Design | |||
| Boys | 9.6 | 12.2 | 20.1 |
| Girls | 13 | 16.9 | 33.4 |
| Drama | |||
| Boys | 3 | 10.5 | 30.5 |
| Girls | 4.8 | 15.8 | 34.2 |
a