
1. Introduction
In the preceding post I pointed out that the number of homicides without a suspect soared between 2008 and 2018. My original intention was to get the latest partner homicide data. I discuss that here, and also the rest of the homicide data as it applies to adult victims. I shall address child victims in a third post. Data on child victims and their killers seems shrouded in obfuscation.
Here I take data from the three ONS sources,
- Focus on: Violent Crime and Sexual Offences, year ending March 2016 – Appendix Tables (Table 2.06)
- Domestic abuse in England and Wales – Appendix tables (to March 2018) (Tables 15 and 16)
- All data related to Domestic abuse prevalence and trends, England and Wales: year ending March 2019 (Tables 20 and 21)
By way of a taster for my third post, I draw your attention to a curious fact. Refs.[2] and [3], above, give a great deal of information about the homicides of adults, breaking the data down in many ways, including into domestic and non-domestic homicides (and various sub-categories of both), and by sex of victim and sex of suspected killer. But when it comes to child victims (under 16), whilst the total number of victims is given, there is no further information. In Refs.[2,3] there is no breakdown into domestic and non-domestic categories of child homicides (though Ref.[1] has some such data). Moreover, the information on the sex of suspects relates to adult victims only. One can easily be misled. Many Tables refer to victims who are the “son/daughter” of the suspect. But these Tables generally relate to “victims 16 and over” and so relate to adult offspring, not children. It is curious that references which are specifically focussed on domestic abuse appear to hide away child victims of domestic homicide. One wonders why. More of that in the third post. For now I focus on adults.
2. All Homicides of Adults
See Figure 1. I have converted 3 year period data from Refs.[2,3] to annual data to plot this Figure. After a dip, total homicide rates are rising towards where they were in 2006-8, though still a little lower as of 2018. These data include homicides without a suspect.
Figure 1

3. Partner Homicides
I was interested initially in the latest partner homicide data. But immediately I hit an inconsistency between Ref.[1] and Ref.[2]. Ref.[1] gives the number of male victims of partner homicide in years 2014/15 and 2015/16 to be 19 and 28 respectively. But Ref.[2] tells us that the total male victims of partner homicide in the three years 2014/15, 2015/16 and 2016/17 was only 45. This seems to imply that there were no male victims of partner homicide in 2016/17, and two earlier victims were resurrected. To be more serious, something has happened to the data between Ref.[1] and Ref.[2] which renders them incompatible, but I have failed to identify what this may be. Taking the data at face value, Figure 2 plots the number of male partner homicide victims, using all three of Refs.[1,2,3], and plotting numbers over 3 year periods to avoid the problem of negative annual numbers! Taken at face value, the number of male partner homicide victims fell to half its 2008 level by 2018.
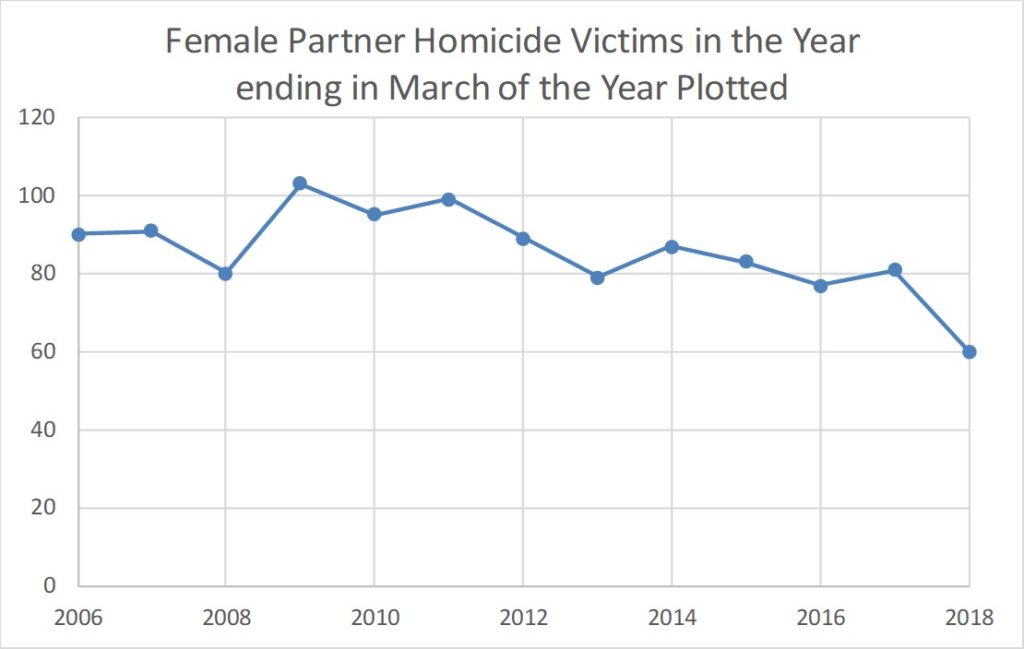
The number of female partner homicide victims has also fallen over this period, the number in 2017/18 being about two-thirds that in 2007/8 (Figure 3, which plots annual numbers). The oft-claimed “two women per week” is looking increasingly inaccurate.
The ratio of female to male victims of partner homicide has varied from about 3:1 to about 5:1 over this period, with an average of about 4:1.
However, there is some significant doubt as to whether the downward trends evident in Figures 1 and 2 represent a real reduction in the prevalence of partner homicide. In order for a homicide to be classed as a partner homicide (or a domestic homicide more generally) there must be an officially recognised suspect. But between 2008 and 2018 the annual number of homicides without a suspect increased by over 90 (over 270 in a three year period). If only a small fraction of such cases were actually partner homicides, the downward trends in Figures 1 and 2 could be obliterated.
Figure 2
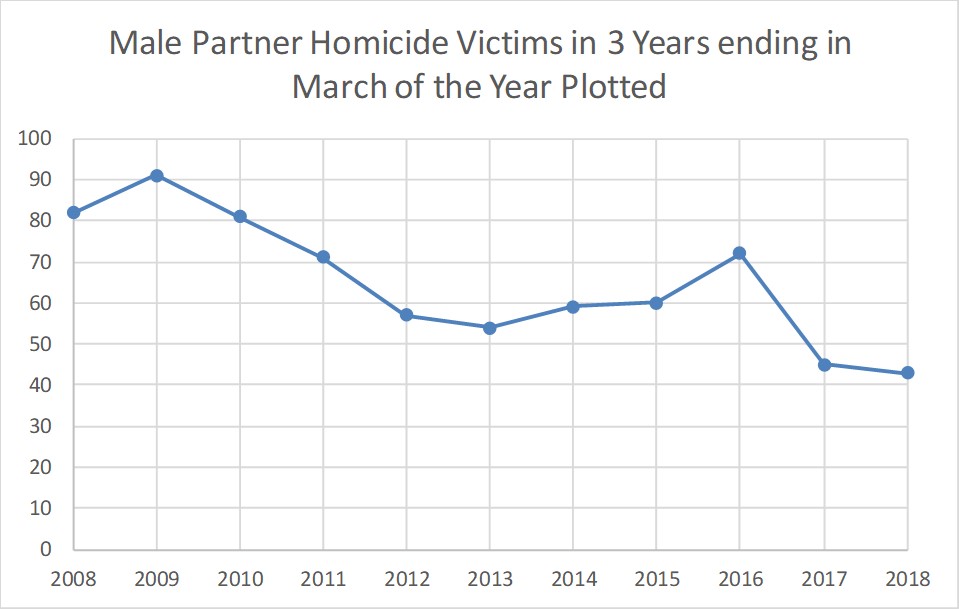
Figure 3
3. All Domestic Homicides (of Adults)
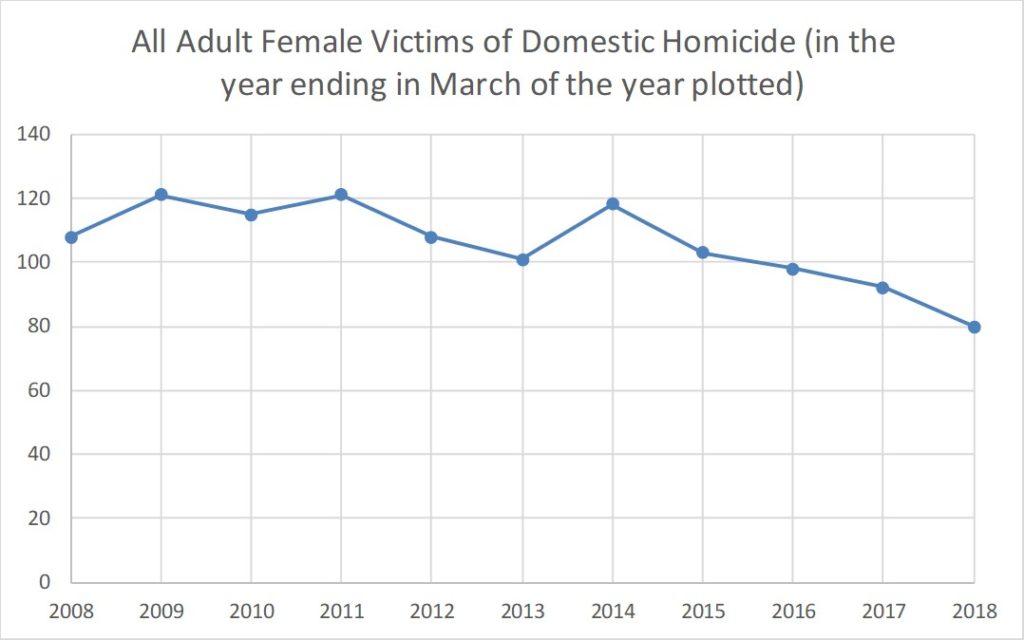
Figures 4 and 5 are the equivalents of Figures 2 and 3 but including all domestic homicides. (Figure 4 for male victims again uses 3 year periods to avoid wild annual swings, whereas Figure 5 for female victims gives annual data). The same proviso regarding the reliability of the reductions seen in Figures 4,5 applies as for Figures 2,3.
The ratio of female to male adult domestic homicide victims has varied between 2:1 and 3:1.
Figure 4
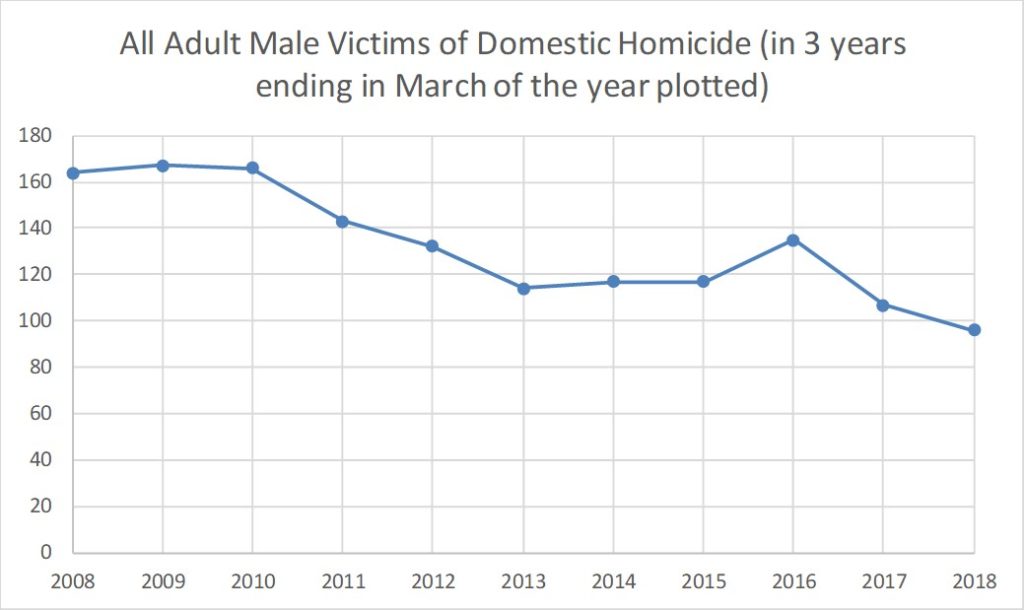
Figure 5
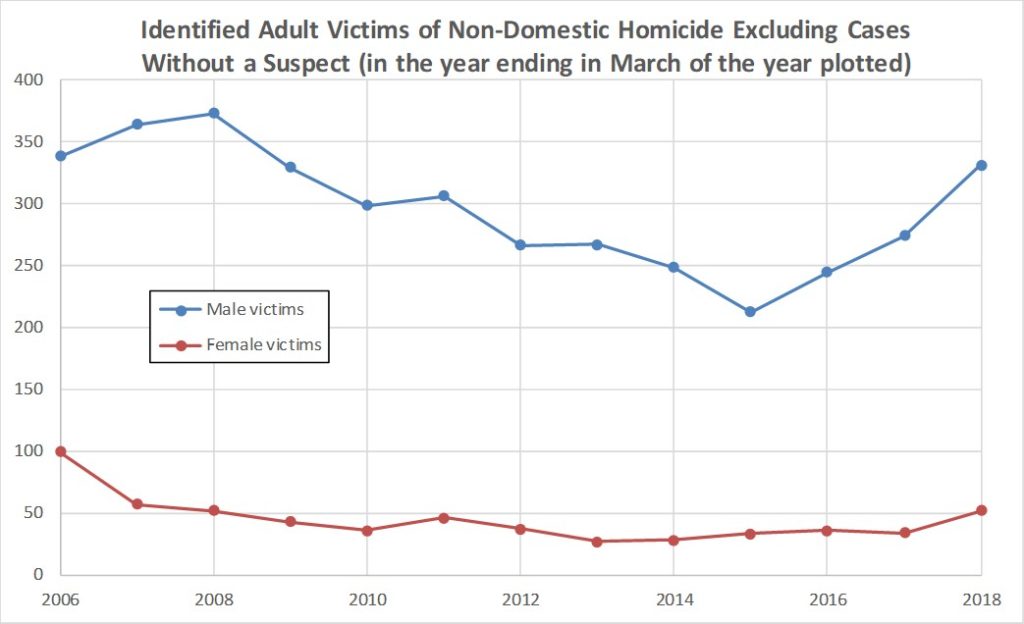
4. Identified Non-Domestic Homicides (of Adults)
Figure 6 plots the annual number of non-domestic homicides of men and women (16 and over) separately. These data are cases identified as non-domestic, i.e., Figure 6 excludes homicides without a suspect (as do Figures 2-5, only Figure 1 includes cases with no suspect). There has been a fall in the number of identified non-domestic homicides between 2006 and 2018. However, the reality of this is subject to doubt in view of the increased number of cases without a suspect – and hence which have not been assigned to either the domestic or non-domestic categories.
The ratio of male to female adult victims of (identified) non-domestic homicide varies between 3:1 and 10:1 with an average of 7:1.
Figure 6
5. Trends: Real or Not?
Table 1 is an attempt to give a crude indication of how the various categories of homicide have changed between 2006-8 and 2018. The exact numbers depend on precisely what base data you take, so it is possible to get slightly different values. However, the differences 2006-8 minus 2018 look roughly like Table 1.
| Category | Men Victims | Women Victims |
| Domestic* | -23 | -24 |
| Non-Domestic* | -75 | -28 |
| No Suspect | +70 | +23 |
*excluding cases with no suspect
Overall there has been a fall in numbers of homicides, consistent with Figure 1.
What cannot be determined from the data is how the increased number of “no suspect” cases split between the domestic and non-domestic categories. Because of this one cannot be certain that the reductions in domestic homicides indicated by Figures 2-5 are correct.
However, a credible interpretation is that the additional “no suspect” cases are overwhelmingly non-domestic cases. This is reasonable as suspects in domestic cases will be far easier to identify in general. If true, this suggests that the fall in domestic homicides (especially partner homicides) is genuine. On the other hand, it also suggests there has been no great change in non-domestic homicides over this period (though the current trend is upward).
However, it is worth pointing out that the formal identification of a suspect requires the person in question to be charged with homicide, and this decision lies with the CPS. Thus, for example, if in some domestic cases the CPS declined to charge some women with homicide (either not charging at all or charging with a lesser offence) then these cases would regress to the “no suspect” category and not figure in the domestic/partner homicide statistics. I have no evidence that this is happening, but in principle it provides a mechanism by which the CPS can influence the apparent prevalence of domestic homicides.