The Usual Misinformation About A Levels

Exactly one year ago to the day I posted “Boys Beating Girls in A-Levels? – Err, No” pointing out how grossly misleading were the newspaper headlines in respect of A Level results, e.g., in the Telegraph, “Boys beat girls to top grades for first time in 17 years”.

The statistical sleight of hand which is being pulled here relates to focussing on the percentages of each sex gaining top grades, as opposed to the absolute number of each sex gaining top grades – see the previous post for details.

The misinformation continues again this year. For example, the headline in today’s Times is, “A levels: Boys benefit from new regime as A*s soar and pass mark falls“, and tells us that, “boys outperformed girls at the top end” because they were “awarded a higher proportion of A*s and As for the second year in a row“. Whilst The Guardian informs us that, “Boys led girls in the top grades for the second year running. The proportion of boys who got A or higher was 26.6%, 0.4 percentage points higher than girls (26.2%)“.

You may find the absolute numbers hard to get hold of – the newspapers will not help you. I have used this source as the basis of the Figures below – which speak for themselves. Data is for England and Wales.  (Click Figures to enlarge).

Salient points for 2018, across all subjects,

  • There were 80,986 (22.2%) more graded A Level entries by girls than by boys;
  • At grades A*, A and B the excess of girls over boys was 2,866, 16,890 and 33,638 respectively (a total of 53,394 across the three grades);
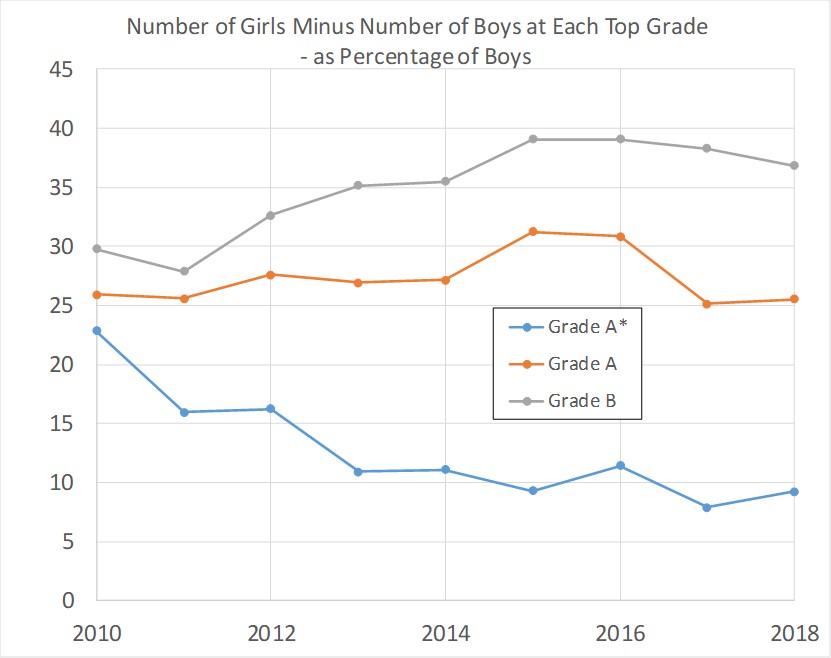
  • At grades A*, A and B the excess of girls over boys, expressed as a percentage of boys, was 9%, 26% and 37% respectively. 

Across all subjects, boys are not doing better than girls at any of the top three grades, nor for all grades together. The only positive feature of the results for boys is that the girls’ lead at the top A* grade is diminishing.

It’s almost as if the newspapers don’t want to expose the true position, as shown by Figures 1 to 4, below.

Figure 1: Excess of girls over boys (all subjects, all graded entries) – click to enlarge

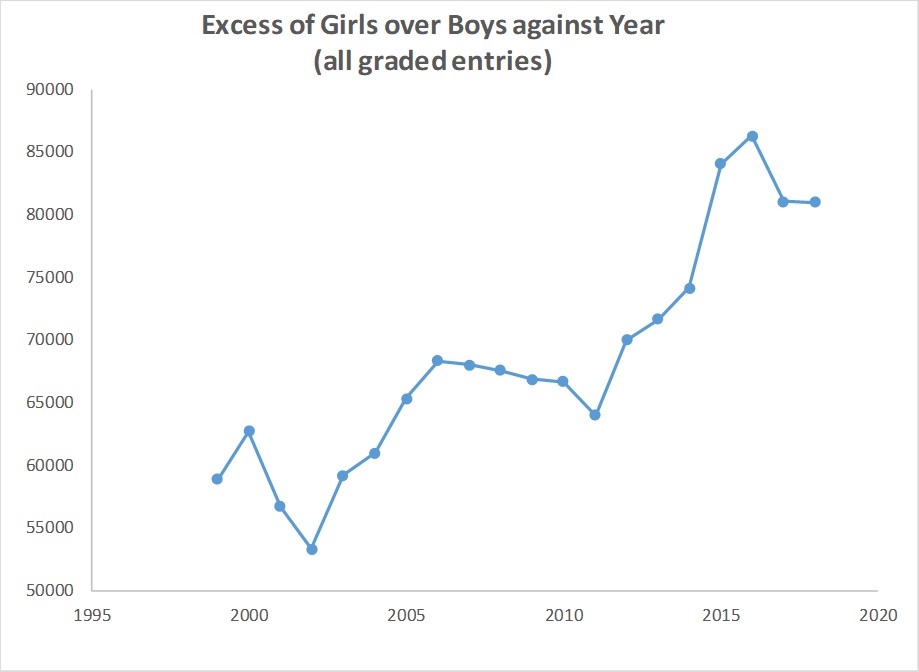
Figure 2: Excess of girls over boys as a percentage of boys (all subjects, all graded entries)

Figure 3:  Excess of girls over boys, grades A*, A and B separately (all subjects)

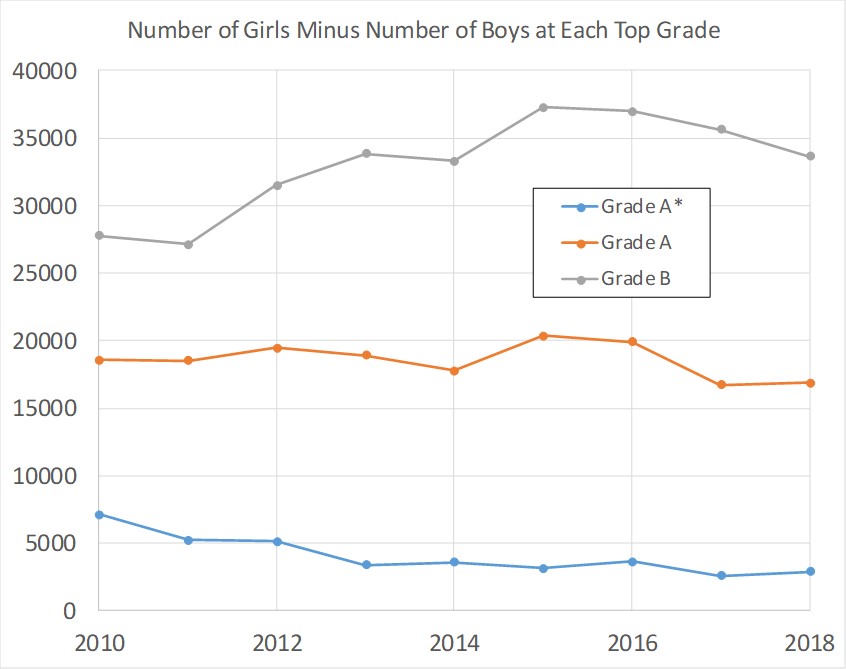
Figure 4:  Excess of girls over boys as a percentage of boys, grades A*, A and B separately (all subjects)


8 thoughts on “The Usual Misinformation About A Levels

  1. paul parmenter

    Keep this article to hand for this time next year, William. Nothing will change, so it will save you the trouble of writing anything new; just update the figures and the newspaper headlines.

    Reply
  2. Joseph

    Thank you William for your research.

    The Guardian is a newspaper which has adopted a strong feminist bias, and which has a policy of minimising, supressing or distorting any information which shows men or boys are being disadvantaged.

    Their strategies include:

    1. Routinely linking men with negative images “white males who needs them” ; ridiculing male health concerns ” male declining fertility: pigs produce more sperm then men” etc.
    2. Routinely running articles which laud women, or show them as victims.
    3. Doing this so persistently year after year that the average Guardian Reader ends up absorbing their ideology, biases and gender hatred.

    In this respect the Guardian must be seen as the mirror image of Fox news, equally toxic in it’s own right.

    Reply
  3. John Allman

    Would it be right to say that girls are doing better than boys on average, at sitting A-levels, because a larger number of boys than girls who aren’t sitting A-levels at all pulls the boys’ average down more than the girls’, but that of those who actually sit A-levels, boys are doing better than girls on average? If so, perhaps the news that the move away from continuous assessment to examination only has stopped disadvantaging boys, will encourage more boys in future to bother taking A-levels.

    Reply
    1. AJ

      I am not at all convinced. That fewer boys take a levels at all mean that those that do are probably a subset who will do better than the average of all boys. If only half as many boys took a levels those that did would be expected to do even better but that would not be evidence of boYstrad benefitting from anything.

      Not a sex ism related issue but there is something wrong with an exam and marking system where so many get the highest mark. It means there is little discrimination between levels of achievement especially at the top level.

      It is always hard to judge but I looked at one further maths a level papers and they seem very easy. I should also look at some physics papers. The issue is that my memory of paper difficulties in the 70s may be faulty.

      Where this becomes a problem for boys is the most able and gifted are no longer being stretched. I remember this was a problem even in the 70sbut perhaps even more of a problem now.

      Reply
      1. William Collins Post author

        Re: your first point – yes, this is a familiar self-selection effect. Hence, the small number of girls who do physics tend to do particularly well, and the small number of boys who do languages tend to do particularly well.

        Across all subjects in 2018, the percentages of girls getting A*, A and B grades were 7.6%, 18.6% and 28.0%. The corresponding percentages for boys were 8.5%, 18.1% and 25.0%. So, whilst the self-selection effect may operate at A* grade, it does not do so at grades A and B. In other words, boys are (in that sense) doing even worse than it appears.

        Maths may have maintained its standards better than physics. Further maths, at least the Board I’ve seen, can have 5 different ‘pure’ papers, of increasing difficulty. The last begins to require engaging brain to a degree (though I’m in my dotage and nowhere near as sharp as I was 45 years ago).

        However, physics A Level has changed out of all recognition. You can find a 1962 paper linked near the end of this post http://empathygap.uk/?p=379 and a 2008 exam is linked for comparison.

        Reply
  4. Groan

    Very informative. One may presume from this that the “gender gap” in University Entry will be as large as in previous years. I doubt the papers have massaged the figures to give the impression boys are generally doing well. I’d level that at the authors of the Press Release. From my experience journalists simply reproduce Press Releases and add the odd impression. It is the officials who have presented the figures so as to conceal the continuing failure of our system to educate boys.

    The latest UCAS report Jan. 2018 shows little has changed other than a greater increase in female applicants. “In England, 43.3 per cent of 18 year old women applied to higher education in 2018, an increase of 0.6 percentage points (1.5 per cent proportionally) since 2017. In comparison, 31.8 per cent of men applied, a 0.2 percentage point increase from 2017 (0.8 per cent proportionally). The pattern of increases in 2018 result in the percentage point difference in application rates between 18 year old women and men increasing to 11.5 percentage points, meaning women were 36 per cent more likely to apply to higher education at age 18 than men. In 2017, the gap was 11.1 percentage points, with women 35 per cent more likely to apply to higher education at age 18 than men.!
    I expect this to be reflected when , or indeed if , they publish the final data for this years intake to University.
    https://www.ucas.com/data-and-analysis/undergraduate-statistics-and-reports/ucas-undergraduate-analysis-reports

    Reply
    1. William Collins Post author

      Yes indeed – female entry to UK HE institutions exceeded male entries by 36% in 2017. I expect it will be no smaller, and perhaps a percent or two larger, this year. Definitive “acceptance” data is usually published late December.

      I agree that the ‘spin’ comes from the suppliers of the data, rather than the newspapers. It is not as easy as one would expect to get hold of the absolute numbers, as opposed from percentages.

      Reply
      1. Groan

        I used to work in Local Gov. and we were very careful not to publish “raw” data. I presume the Civil Service nationally is equally versed in clever use of Stats. I presume this is why the ONS Stats are so rarely used by Civil Service Departments, as they frequently don’t set the right “political tone”.
        I don’t know whether its “tradition” or culture but there is a sense by which “officers of the council” sort of manipulate information to the desires of their politicians even prior to the politicos asking for it. Some years ago a colleague from Italy noted this strange process.
        Years ago there was a super little book “How to Lie with Statistics” by Darrell Huff. Really good for the non mathematical to read.

        Reply

Leave a Reply

Your email address will not be published. Required fields are marked *