The Increasing Socio-Economic Marriage Gap (click to enlarge)
Following the earlier post on marriage statistics, here are some bald statistics on families, divorce and cohabitation in the UK. It is primarily intended for the mhrm.uk Wiki but I thought I’d post it here first. I also revisit the theme of the Marriage Gap because it is so important.
Unless otherwise stated the data on families and households relate to the whole UK, whereas the data on divorce relate to England & Wales. Throughout “children” is used as a shorthand for “dependent children”. The ONS documents are not explicit regarding what constitutes dependency. The term “divorce” is used to include both decrees absolute and decrees of nullity.
Families and Households 2015 (UK)
Data is from this ONS publication. The following Figures and Table are self-explanatory.
Table 1: Families by family type, 1996 – 2015 (with and without dependent children)
| Thousands | 1996 | 2005 | 2015 |
| Married couple, with children | 5223 | 4732 | 4704 |
| Married couple, without children | 7418 | 7546 | 7760 |
| Cohabiting couple, with children | 540 | 902 | 1254 |
| Cohabiting couple, without children | 934 | 1547 | 1924 |
| Lone parent family, with children | 1631 | 1883 | 1963 |
| Lone parent family, without children | 814 | 814 | 1059 |
There are more of all types of family than 20 years ago, except for married couples with children of which there are fewer.
Figure 1: Families by family type, 1996 – 2015 (with and without dependent children) – click to enlarge
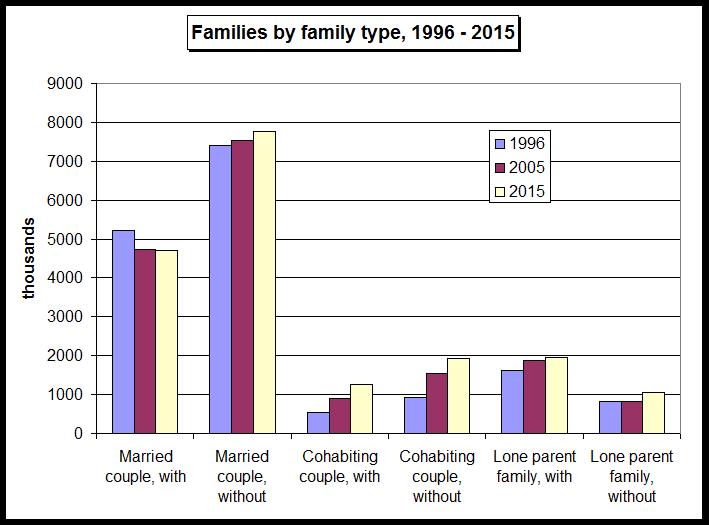
Figure 2a: Percentage of dependent children by family type, 2005 – 2015

Figure 2a shows the percentage of dependent children by family type over the ten year period 2005 – 2015. Children living with cohabiting couples have increased as a proportion of the total number of children, at the expense of children living with married couples. The proportion of lone parent families has not changed significantly over the last 10 years (accounting for about 23% of children).
However, Figure 2a does not faithfully represent the current rate of births into the different family types – because it is an integrated statistic, i.e., many of the children in question in Figure 2a will have been born some time ago when birth rates inside marriage were higher. The percentage of births within marriage is shown against year from 1980 in Figure 2b (taken from the trend away from marriage, Harry Benson, April 2015). The births outside marriage are split into sole registrants, i.e., when a (nominal) father is not named on the birth certificate, and dual registrants, when one is (though not married). Note that many of the dual registrants will not be living together (or claiming not to be living together).
Figure 2b illustrates the massive social change which has taken place over the last 36 years. In 1980 little more than 10% of children were born outside marriage, whereas by 2012 this had reached nearly 50%. This is due both to doubling the number of lone parents over this period (see Figure 7) and a huge increase in cohabitation.
In fact, if it were not for women born outside the UK, the percentage of children born within marriage would already be well below 50%. Figure 2c shows that the percentage of children born within marriage to women born within the UK was only 45% in 2014.
Figure 2b: Birth rates inside and outside marriage, since 1980
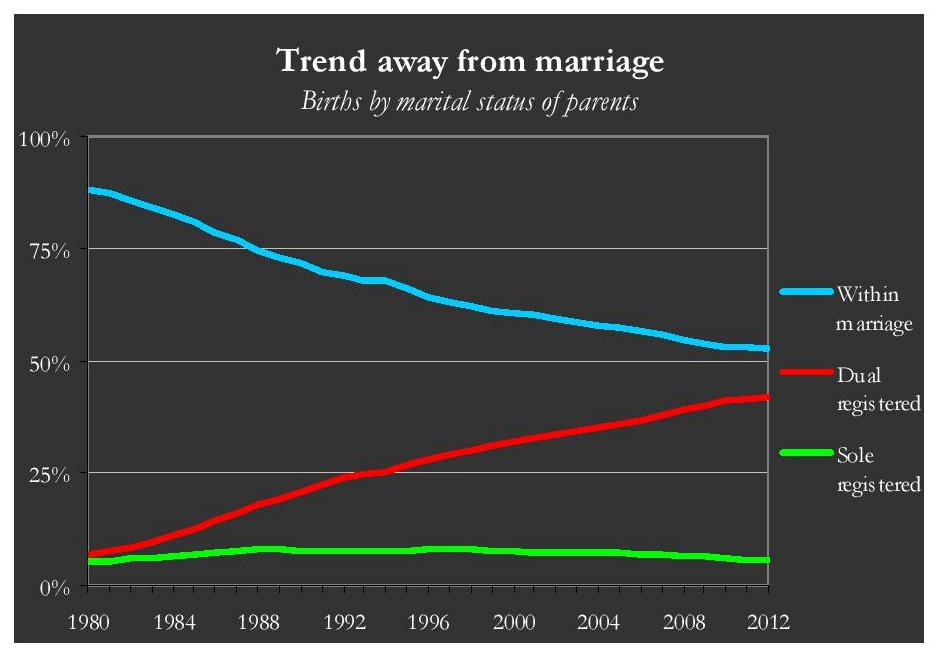
Figure 2c: Percentage of live births in England & Wales to couples within marriage/civil partnership, by country group of birth of mother, 2014 (taken from this ONS data)
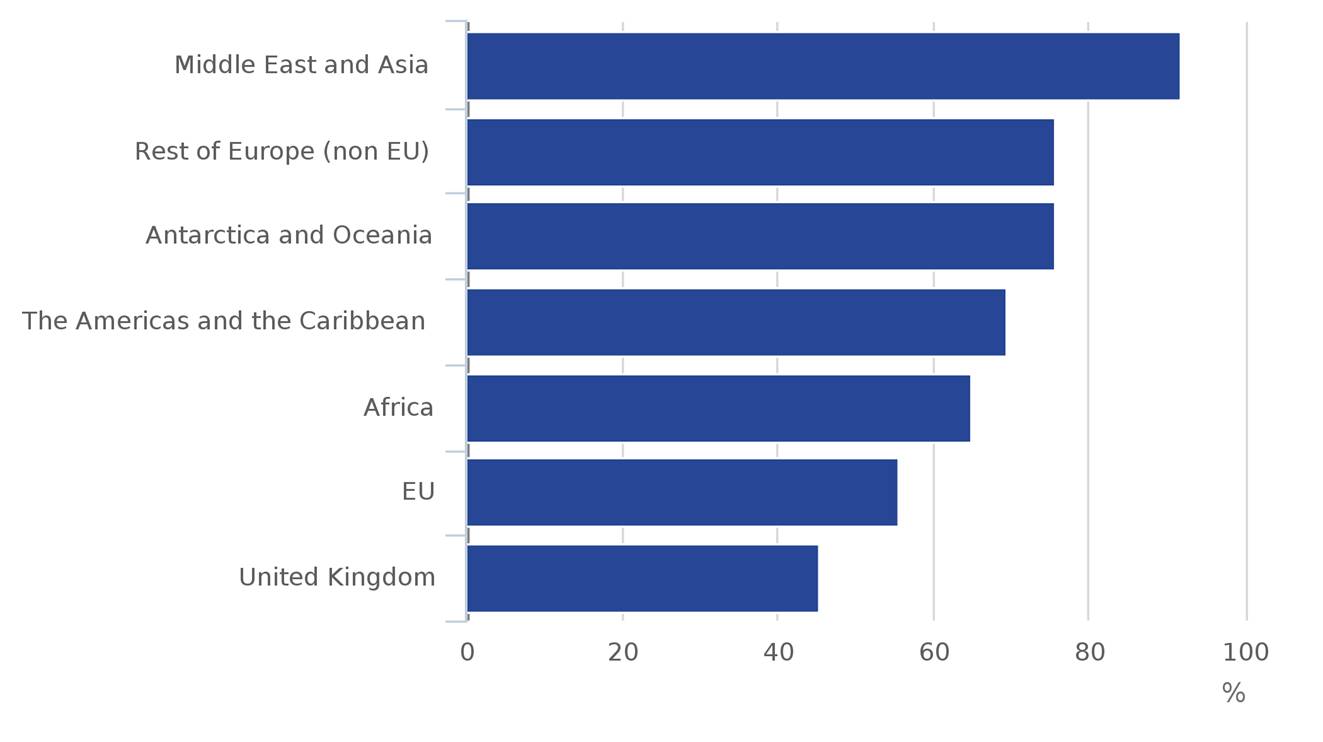
Figure 3: Number of children by family type. Note that these percentages are of the total for that particular family type. Do not misinterpret this as indicating that most single-child families are single parent families. You should also take cognisance of the data being a snap-shot in time, so some of the single child families will later become families with 2 or more children.

Figure 4: Young adults living with parents
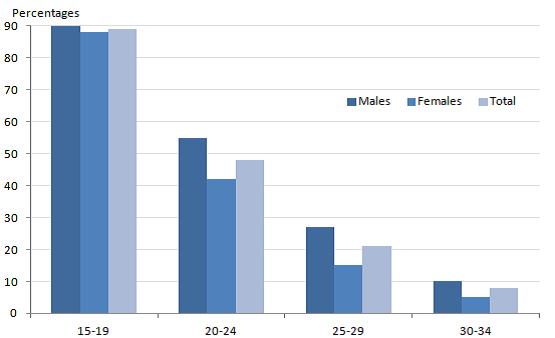
A larger percentage of males live with their parents than females in every age range. (This may be due to the larger number of single males, see Marriage). There are about a million more young adults living with their parent(s) than twenty years ago: in 1998 there were 5.5 million young adults livings with their parent(s), whilst in 2015 there were 6.6 million. This probably reflects the tendency to marry later, or not at all. Whether economics also plays a part is not clear.
Figure 5: Percentage of households by household size in 2015

Note that 2 people may mean a single adult and one child, or two adults. In 2015 some 29% of households were people living alone (up from 17% in 1971). Again this may be partly a result of the tendency to marry later. However, the age range at which lone-living is most common is 45 – 64, suggesting that divorce, partnership breakdown or never having married are the most significant causes.
Figure 6: Age of people living alone

Lone Parents
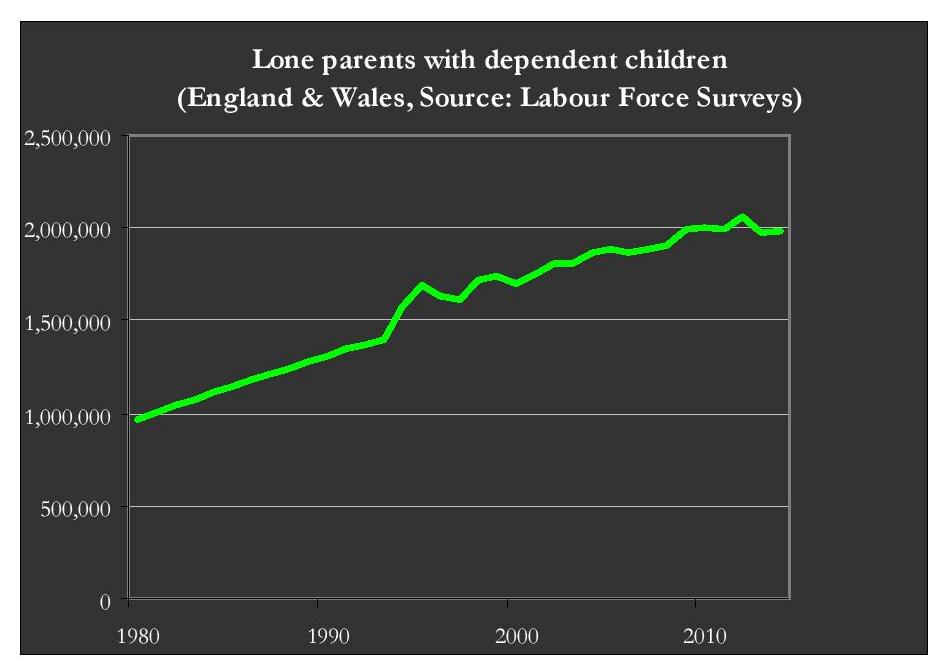
- In 2015 there were 1.99 million lone parents with dependent children in the UK according to ONS data. This has increased from 1 million in 1980 – see Figure 7.
- It is worth noting, however, that, in 2013, “the number of lone-parent tax credit beneficiaries total 2.226 million, according to HM Revenue and Customs data” (taken from the Marriage Foundation). This implies that about a quarter of a million couples with children are pretending to live apart in order to claim lone-parent benefits.
- In 2015, lone parents with dependent children represented 25% of all families with dependent children. This has increased from 22% in 1996.
- Women account for 90% of lone parents with dependent children.
- 60% of lone parent families receive housing benefit compared to 10% of couple
families (from the Marriage Foundation’s Marriage Gap report). This is the “State as husband”.
Figure 7: Increase in Number of Lone Parents
Divorce (England & Wales)
Except where explicitly noted the data on divorce is taken from this ONS report referring to 2013.
Figure 8 shows the number of divorces per year from 1933 to 2013 in comparison with the number of marriages per year. It is striking that the number of divorces per year is such a large proportion of the number of marriages (roughly half).
Figure 8: Number of divorces and marriages per year

The number of divorces per year has declined over the last decade. It is tempting to attribute this simply to the declining number of married couples. However, Figure 9 shows that the divorce rate (defined as the number of divorces per thousand married people) has also declined over the last decade. But this may be misleading because the reduced marriage rate has not yet had time to work through to a new, lower, percentage of married couples. As the percentage of people who are married continues to fall, the divorce rate, defined as above, may increase again.
Figure 9: Divorce Rate per 1000 Married Couples
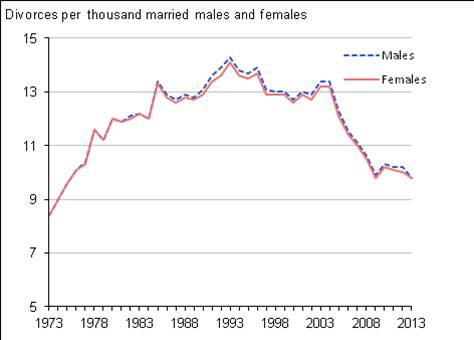
Whilst the divorce rate is at its lowest for 40 years, the interpretation of this statistic in this article is dubious. It claims that the increased tendency for cohabitation before marriage has strengthened marriage and that the reduced divorce rate offers evidence that younger couples who do marry are now less likely to divorce than their parents generation. Whilst these interpretations might be true, the divorce rate statistic is not a sound basis for such a conclusion due to the very long time lag between marriage and divorce rates and the number of married couples in the population. Moreover, even if previously cohabiting couples who marry are indeed less likely to divorce, this obscures the ~75% of cohabiting couples who have no intention of marrying and whose relationships are far more fragile.
In fact, only one-quarter of cohabiting couples have plans to marry. So the view of cohabitation as a sort of trial marriage is mostly spurious. The mechanism by which cohabitation may make marriages more secure is more likely to be by self-selection: those couples who marry are the ones who are committed – the less committed now cohabit instead. This is confirmed by the far higher rate of partnership break-up amongst cohabitees (see below).
Figure 10 is a histogram of age at divorce. People in their forties are the commonest divorcees. The mean age at divorce is 45 for men and 43 for women. This has increased by 8 years over the last 30 years, reflecting the tendency for later marriage. (I believe Figure 10 includes second, third, etc, divorces, not just the first divorce).
Figure 10: Histogram of Age at Divorce

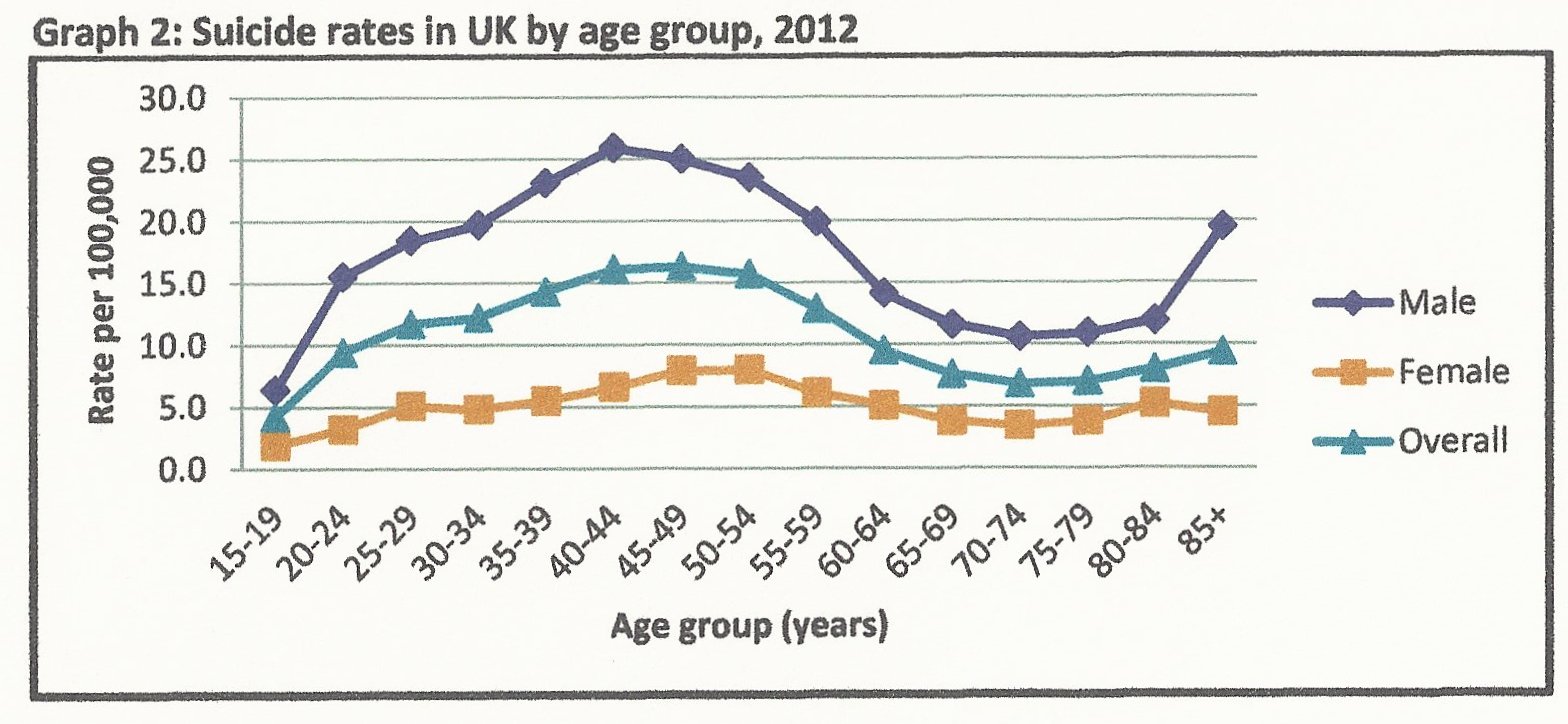
The reader may wish to compare Figure 10 with Figure 11 which shows the suicide rate of men against age. Both peak for men in their forties. Many have suggested that there may be a causal relationship between these two phenomena, but the research required to confirm or refute the suggestion has not been done.
Figure 11: Suicide rate per 100,000 (UK)
Salient divorce facts
- For divorces in 2013, and excluding joint awards, 65% were initiated by (“granted to”) the wife.
- The median duration of marriages ending in divorce in 2013 was 11.7 years. (Note that this is not the median duration of all marriages, which will be substantially longer due to marriages which do not end in divorce).
- The percentage of marriages ending in divorce by 2011 was 42%. This has decreased from 45% in 2005. A fall in the divorce rate (as a percentage of marriages) is to be expected as the marriage rate falls and cohabitation rates rise, i.e., the less stable relationships might reasonably be expected to polarise into the cohabitation camp.
- 48% of couples divorcing in 2013 had at least 1 child aged under 16 living in the family. Where there were dependent children in a family undergoing divorce, the average number of dependent children was 1.71, the total number of affected children being 94,864. 64% of these children were under 11; 21% were under 5.
Cohabitation Dissolution and Affected Children
Bad though the effect of divorce is on children, the divorce statistics omit a crucial issue which is approaching dominance: the break-up of cohabiting couples with children. Whilst cohabiting couples account for only ~15% of dependent children, cohabiting couples are far more likely to split than married couples. In fact ~50% of family breakdowns relate to cohabiting couples. Cohabiting couples with children have slightly fewer children on average than married couples with children. Consequently, it is likely that the majority of children affected by family breakdown still relate to divorces – but only just. In the near future it may be that the majority of children affected by family breakdown will be from cohabitees’ families. However, these observations regarding ‘family breakdown’ neglect lone parent families. Far more children fail to live with both parents as a result of the combined effects of lone parenting and cohabitation break-up than the result of divorce (see below).
If we turn this around to look at children who grow up with both their parents until they are adult, the distinction between married couples and cohabiting couples is stark. “Almost no couples with children who stay unmarried stay together” ran the headline in a Telegraph article. A Marriage Foundation review in 2013 concluded that,
Figure 13: Number of children affected by family breakdown versus year. From the top down the four bands are: (i) sole registrants (lone parents); (ii) dual registrants but unmarried; (iii) Birth-then-marry couples; (iv) Marry-then-birth couples.

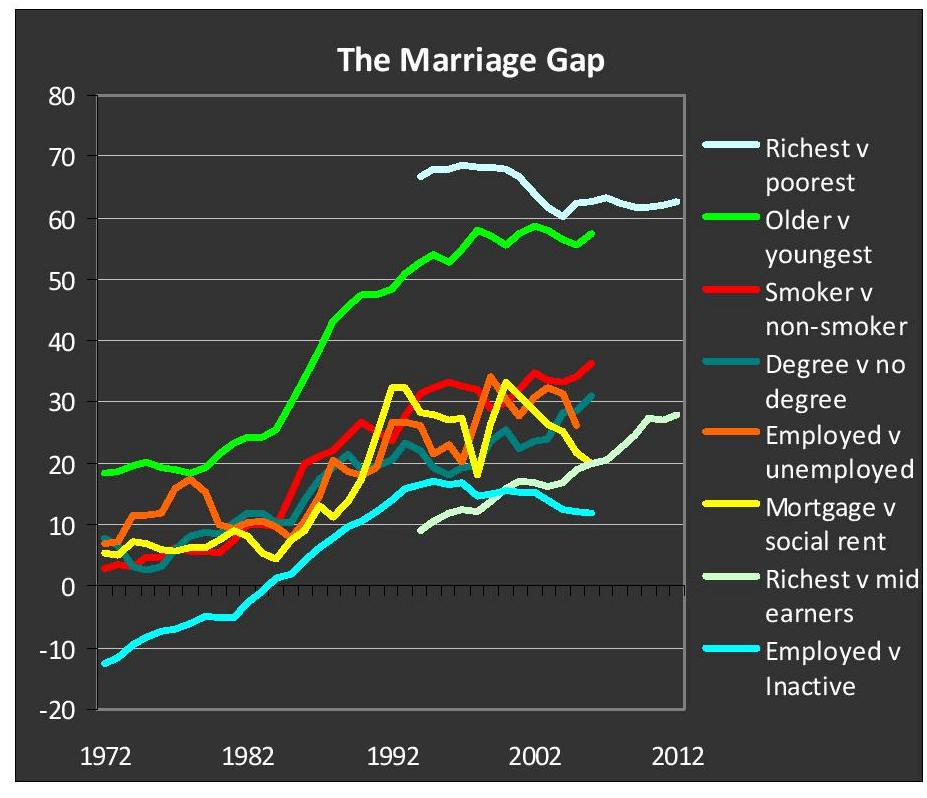
The Marriage Gap
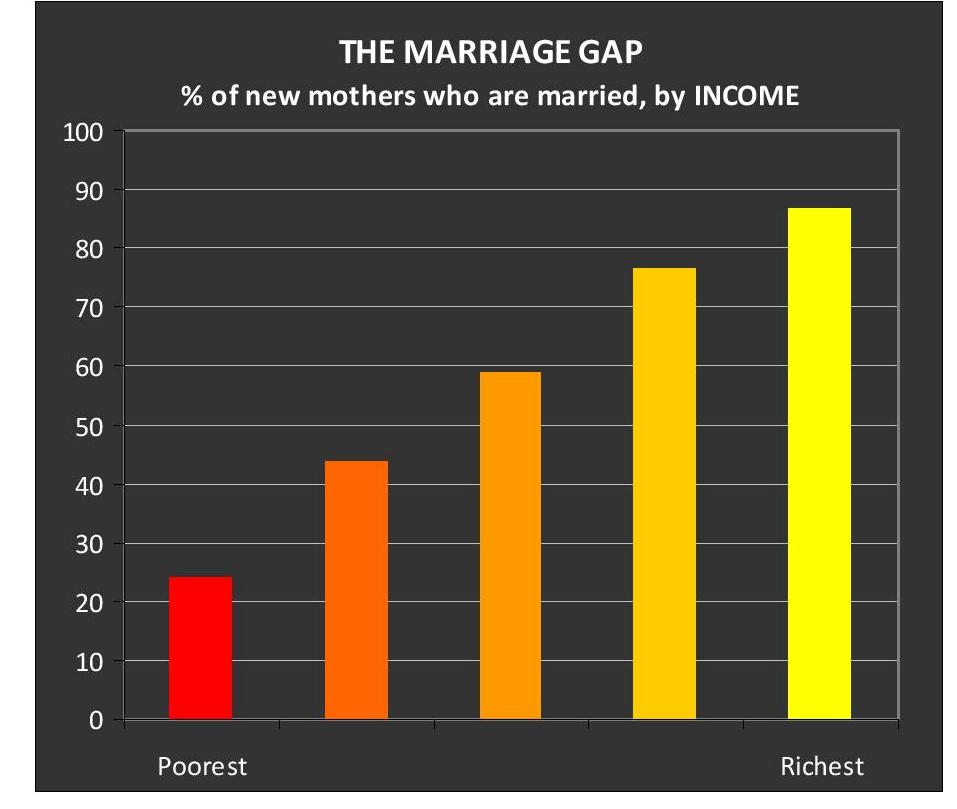
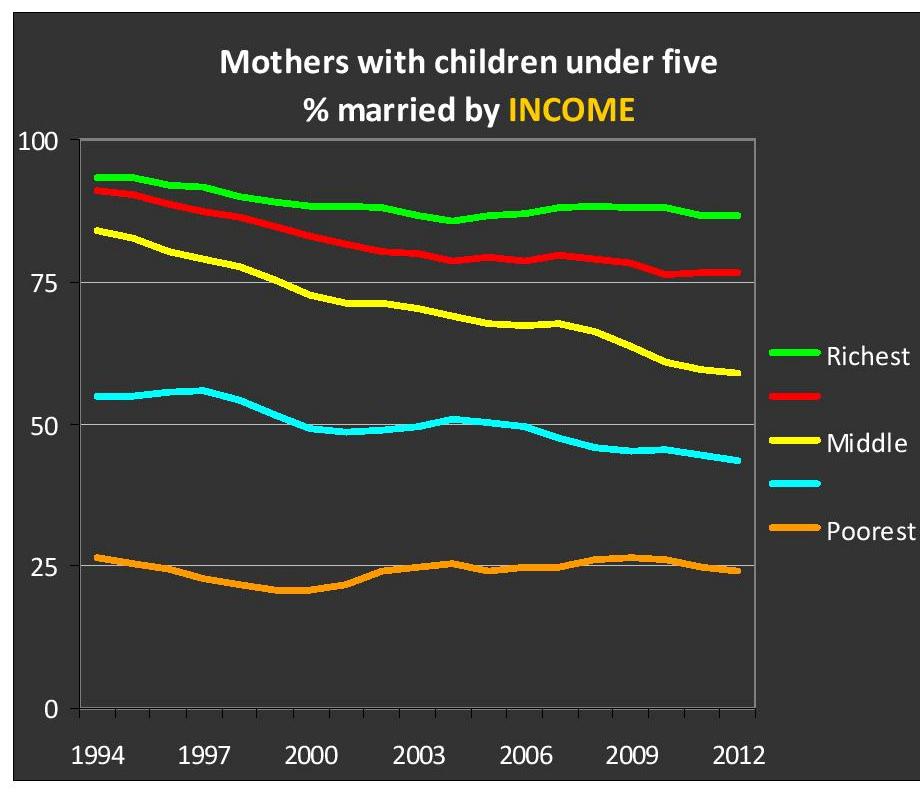
The socio-economic marriage gap was touched upon in Marriage. Harry Benson and Stephen McKay of the Marriage Institute have looked at this phenomenon in more detail and I reproduce below several Figures from their report The Marriage Gap, August 2015. Figure 14 shows the huge dependency of the marital status of new mothers on the household income. Figure 15 shows that it is families in the middle income range whose likelihood of being married has reduced most markedly over the last twenty years.
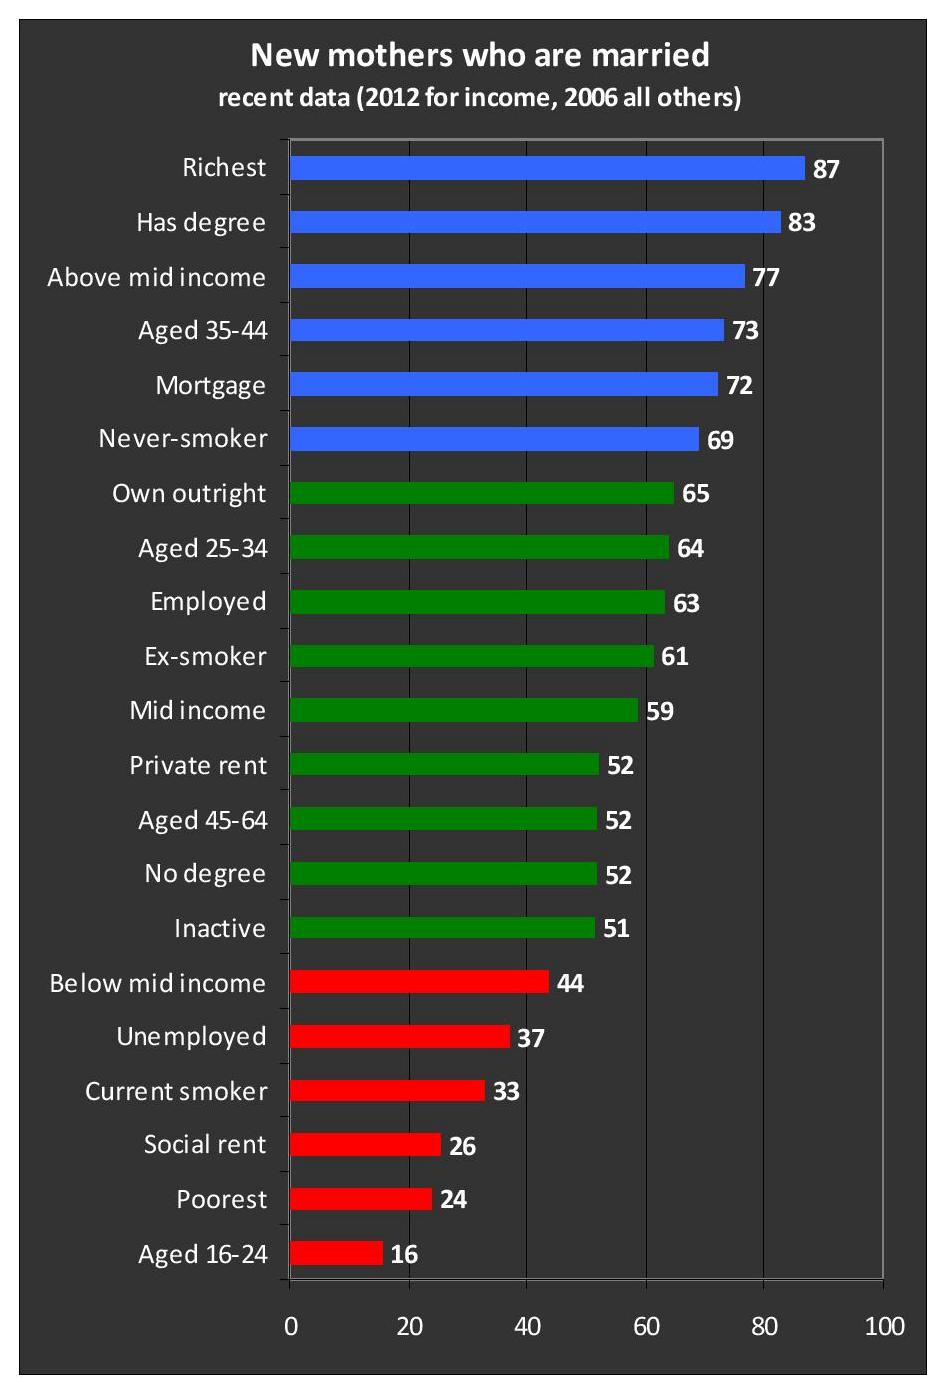
Figure 16 shows that mothers with degrees have suffered less reduction in likelihood of marriage than mothers without degrees. In 1972 having a degree made no difference to a mother’s likelihood of being married. Now a large gap has opened up (50% cf 80%).
Both real disposable income and educational attainment have generally improved substantially since 1970 or 1980. Consequently the marriage gap may be related to relative incomes and education, rather than absolute levels. This would be the case if an inadequate supply of financially attractive males were ‘snapped up’ by the better educated, higher earning, women as marriage partners – leaving only financially unattractive, poorly educated, males. The matching unmarried women may prefer to remain in that status, perhaps because the benefits system renders marriage to such men financially unrewarding.
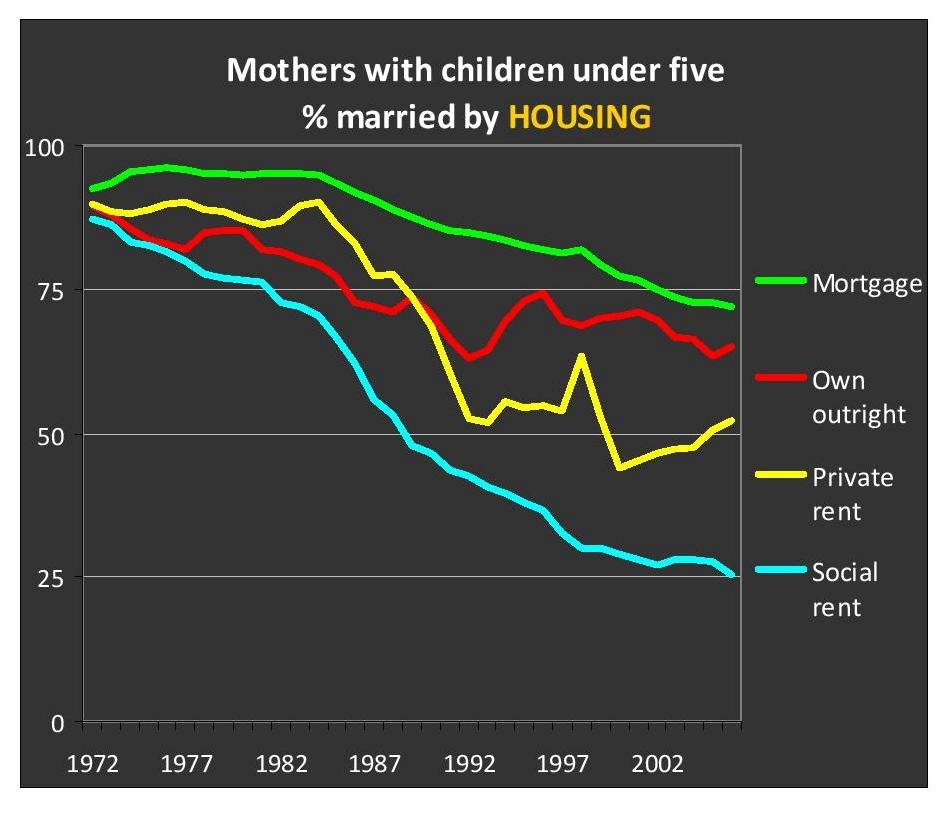
Figure 17 shows a marked gap between the likelihood of a mother being married according to whether she is employed or unemployed. This gap used to be far smaller. Similarly, Figure 18 indicates that mothers who live in owner-occupied housing are far more likely to be married than those in rented accommodation. In 1972 this was not the case.
All these measures indicate a huge and growing gap in marriage between the well off, well educated upper-middle class and the lower socio-economic groups. Marriage is increasingly the preserve of the upper-middle class.
Figure 14: Percentage of new mothers who are married by household income