Introduction
In Girls Are Just Cleverer I promised to look at sex bias in the 2021 A Level awards. I do so here.
Mary Curnock Cook has beaten me to it, though, with an article in The Times and another with detailed statistics in FENEWS. The former quotes the latter where Curnock Cook opines that “this goes further than the usual concerns about boys’ underachievement in education compared to girls and needs a convincing explanation to eliminate what seems, on the face of it, to indicate systemic bias against boys”.
This will not be a surprise to readers of this blog. I have been identifying systemic sex bias in education for 7 years now. My latest update on bias in Key Stage 2 SATS (age 10/11) can be found in Girls Are Just Cleverer. And the bias resulting from A Level awards based on teachers’ assessments was covered in A Levels 2020: The Year of Utter Nonsense.
Having used the phrase “year of utter nonsense” of 2020 leaves me unable to think of an appropriate term for 2021. I am apt to say “things will only get worse”. I apologise for being such a misery – but unfortunately reality has a way of reinforcing my pessimism by proving me right. This year’s A Levels are a case in point. They have become about as credible as a Monty Python sketch.
At the end of Curnock Cook’s opinion piece in The Times, the Department for Education is quoted as rejecting her claims of systemic bias against boys saying that this has been ruled out by Ofqual, the exams regulator. Via FOI I have been informed that the Ofqual analysis which purports to demonstrate this lack of bias is Summer 2021 student-level equalities analysis: GCSE and A level by Ming Wei Lee. This post will therefore address two things,
- Firstly, my own presentation of the 2021 A Level awards, particularly the evidence for their sex bias in the top grades. This builds on my analysis of the 2020 data in State Education Dying, Dying….Dead? and uses the same methodology.
- And secondly, a brief critique of the Ofqual analysis by Ming Wei Lee.
(I note in passing that the same author, with Paul Newton, wrote May 2021’s Systematic divergence between teacher and test-based assessment: literature review where they observe that “evidence of teacher bias in relation to gender is mixed, but a slight bias in favour of girls (or against boys) is a common finding”. However I shall not review that work here.)
A Level Awards 2021
In both 2020 and 2021, A Level awards were based on teachers’ assessments, not on exams. A Level awards were last based on exams in 2019.
I shall concentrate here on the top grades, A/A*. All Data was taken from National examination figures (bstubbs.co.uk).
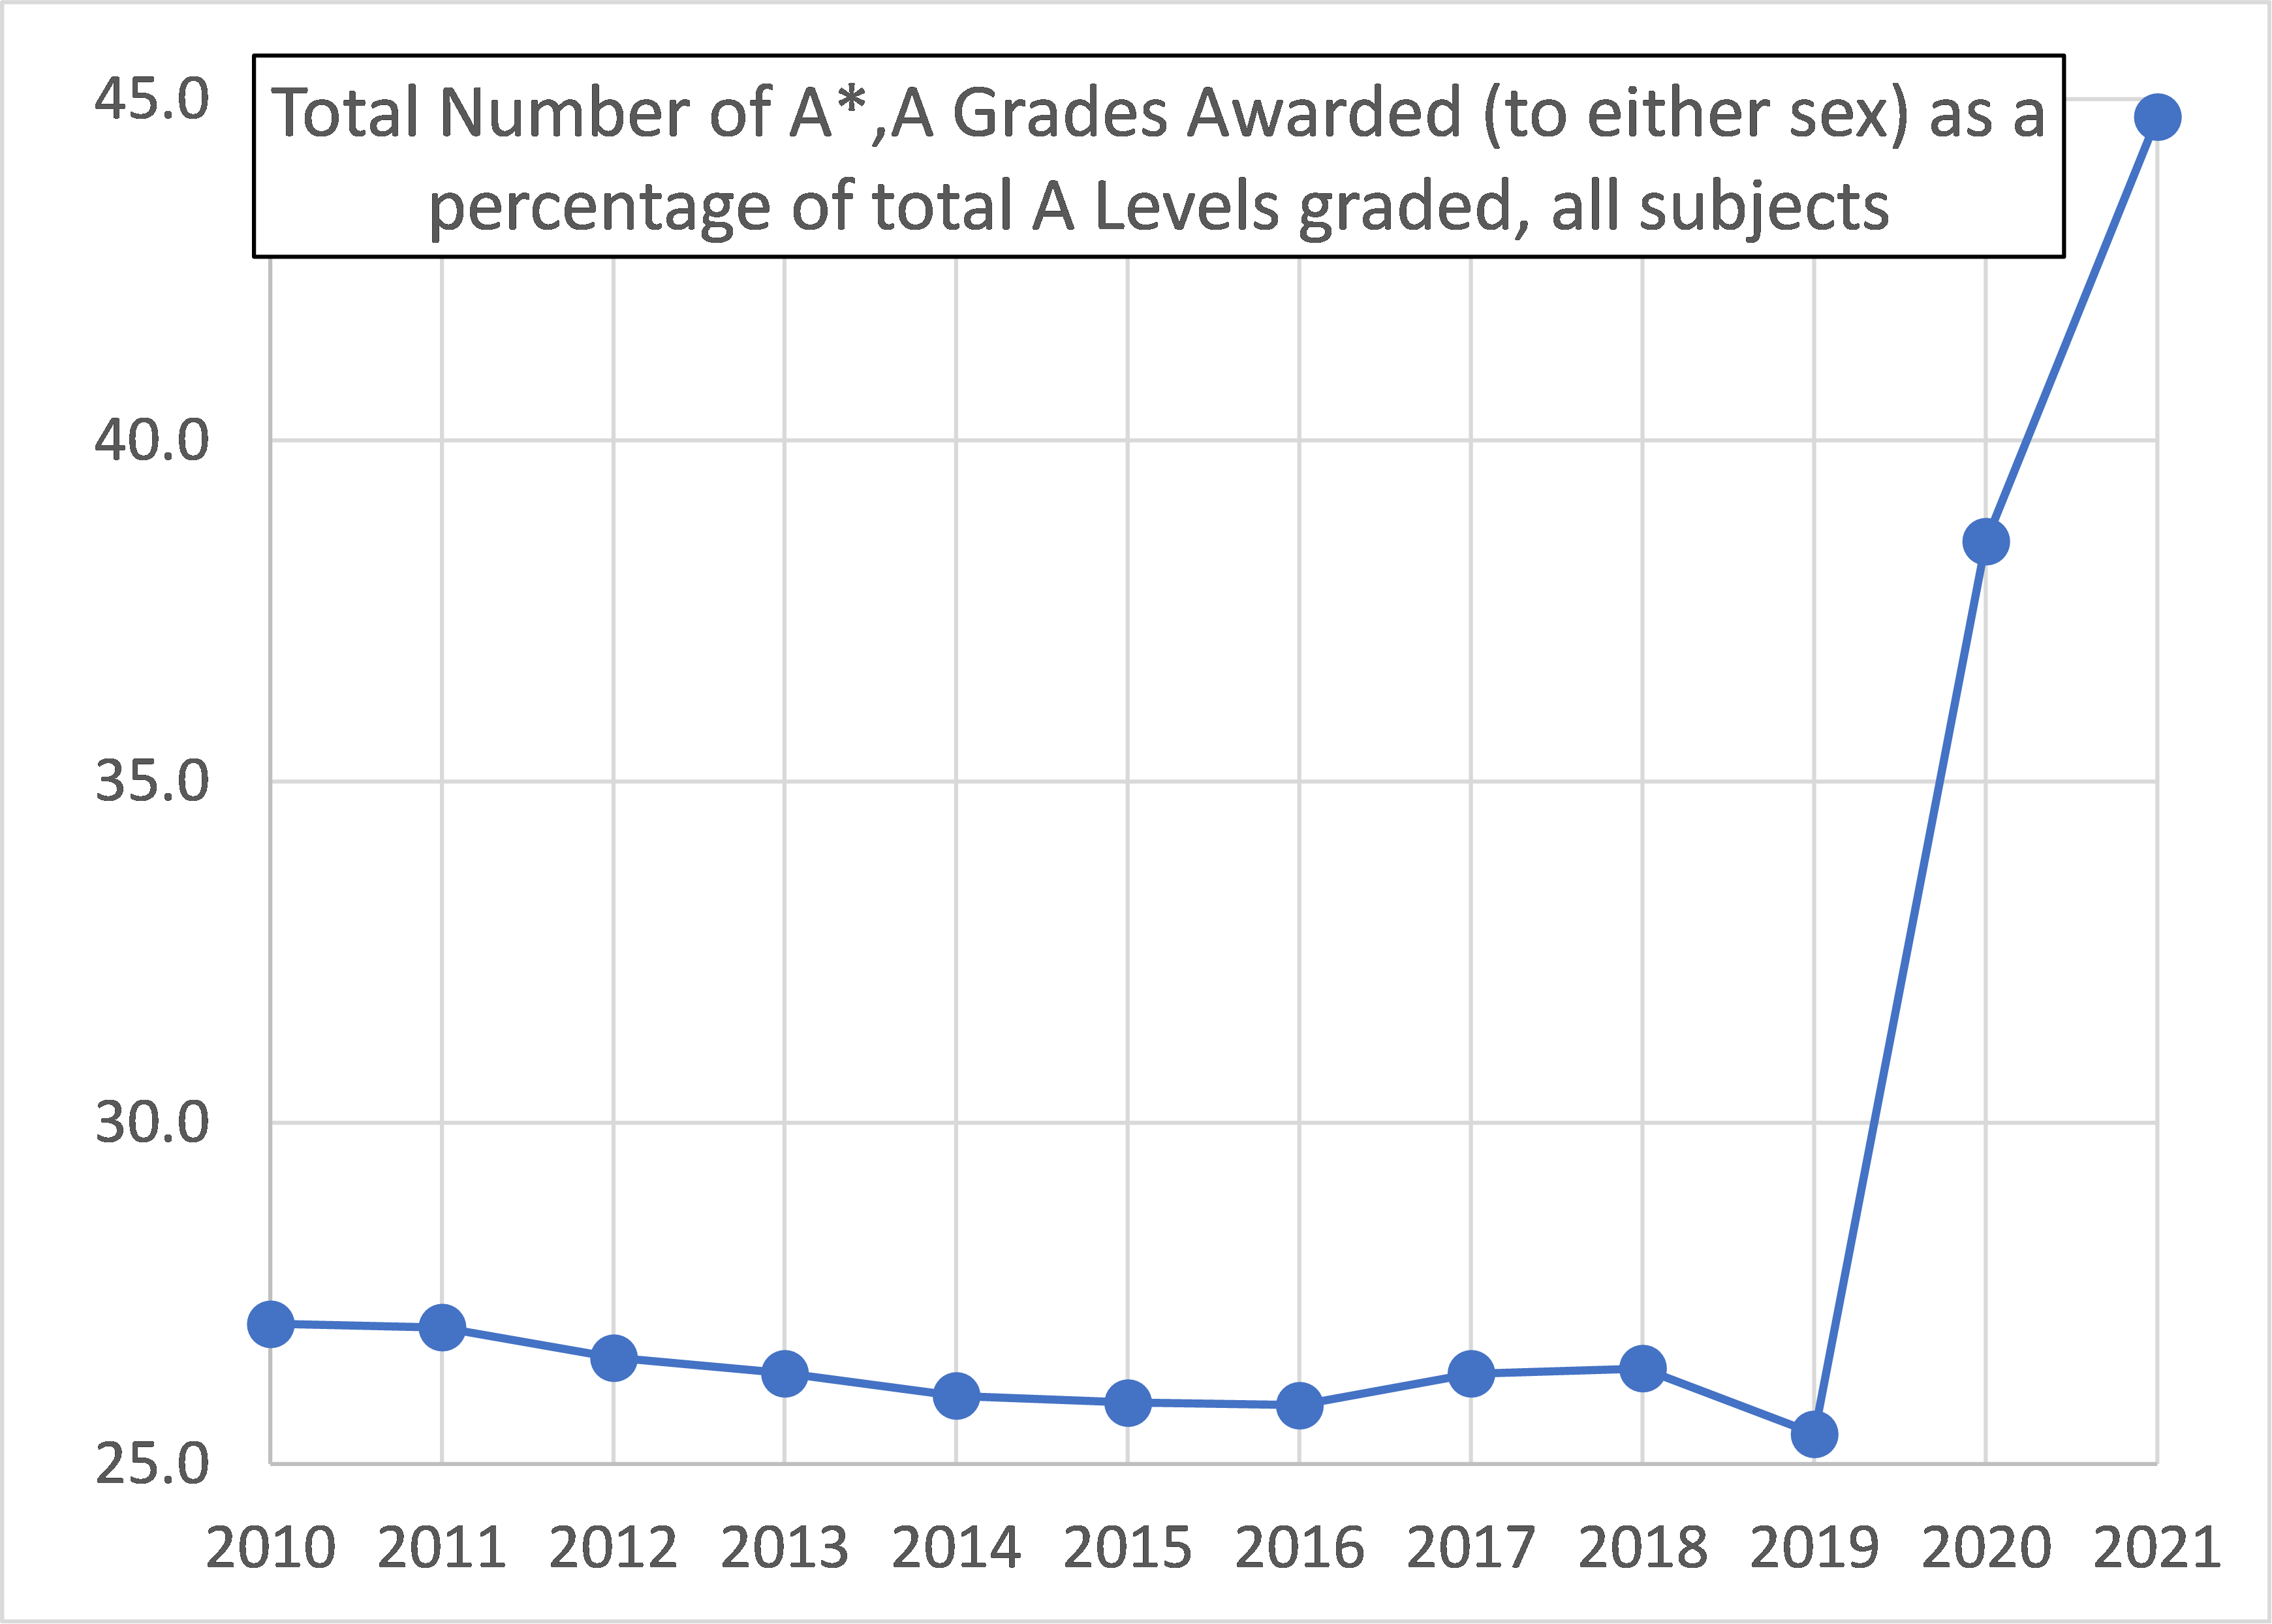
The massive grade inflation in these top grades is illustrated by Figure 1 which shows the number of A/A* grades awarded as a percentage of total A Levels versus year (all subjects, both sexes). This was 25.4% in 2019, was falling slightly, and had not been higher than 27.1% over the ten years 2010 – 2019, all based on exams. In 2020 this leapt upwards, and has increased markedly again this year, to nearly 45%.
Inflation in the top grades can be seen for both girls and boys. However, it is more marked for girls. Figure 2 plots the percentage by which the number of A/A* grades awarded to girls exceeds the number awarded to boys. This had been between 20% and 25% for ten years based on exams, then, based on teachers’ assessments, it leapt to 35.3% in 2020 and now to 36.9%.
Figure 3 shows what this looks like in absolute numbers: the number of A/A* grades awarded to girls minus the number awarded to boys. Girls have been awarded more top grades for a very long time (several decades). In the last ten years of exam-based awards, 2010 – 2019, between 20,000 and 25,000 more top grades were awarded to girls than to boys each year. In 2020, based on teachers’ assessments, this leapt to 45,000 and in 2021 to 57,500.
The excess of top grades awarded to girls over boys has nearly tripled since the last exam year, 2019. Bear this in mind when we get to the Ofqual analysis.
Figure 2
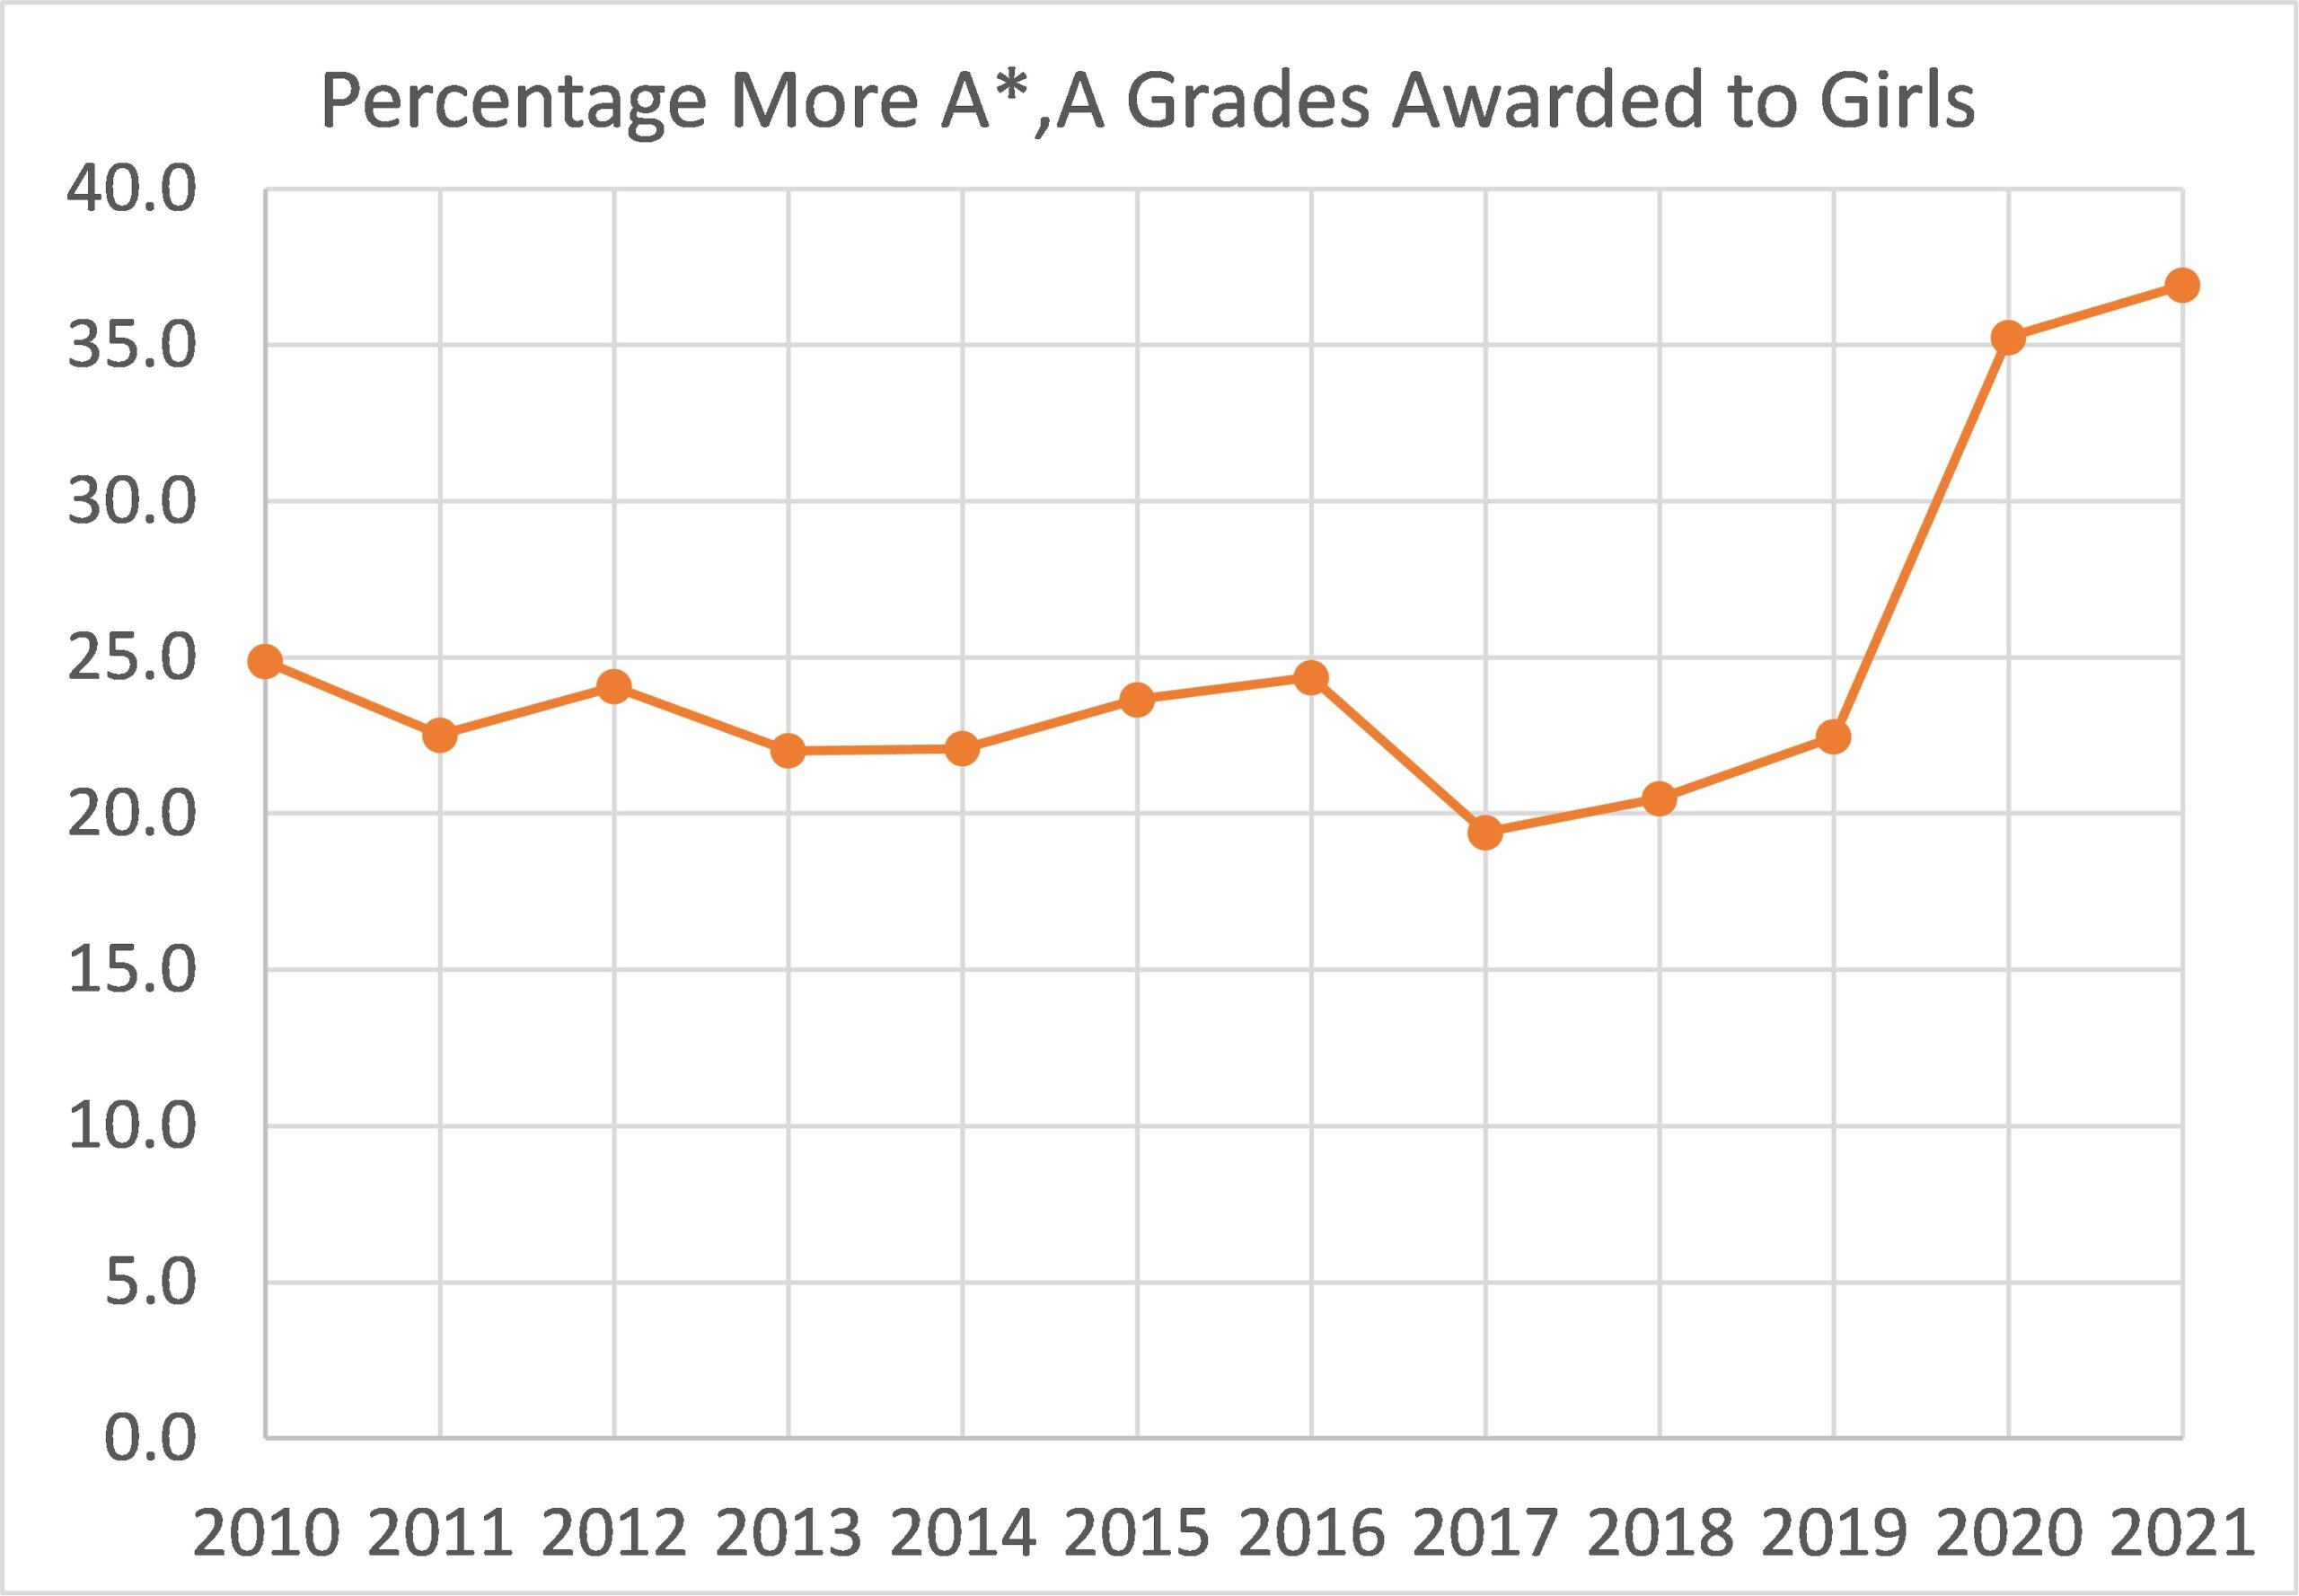
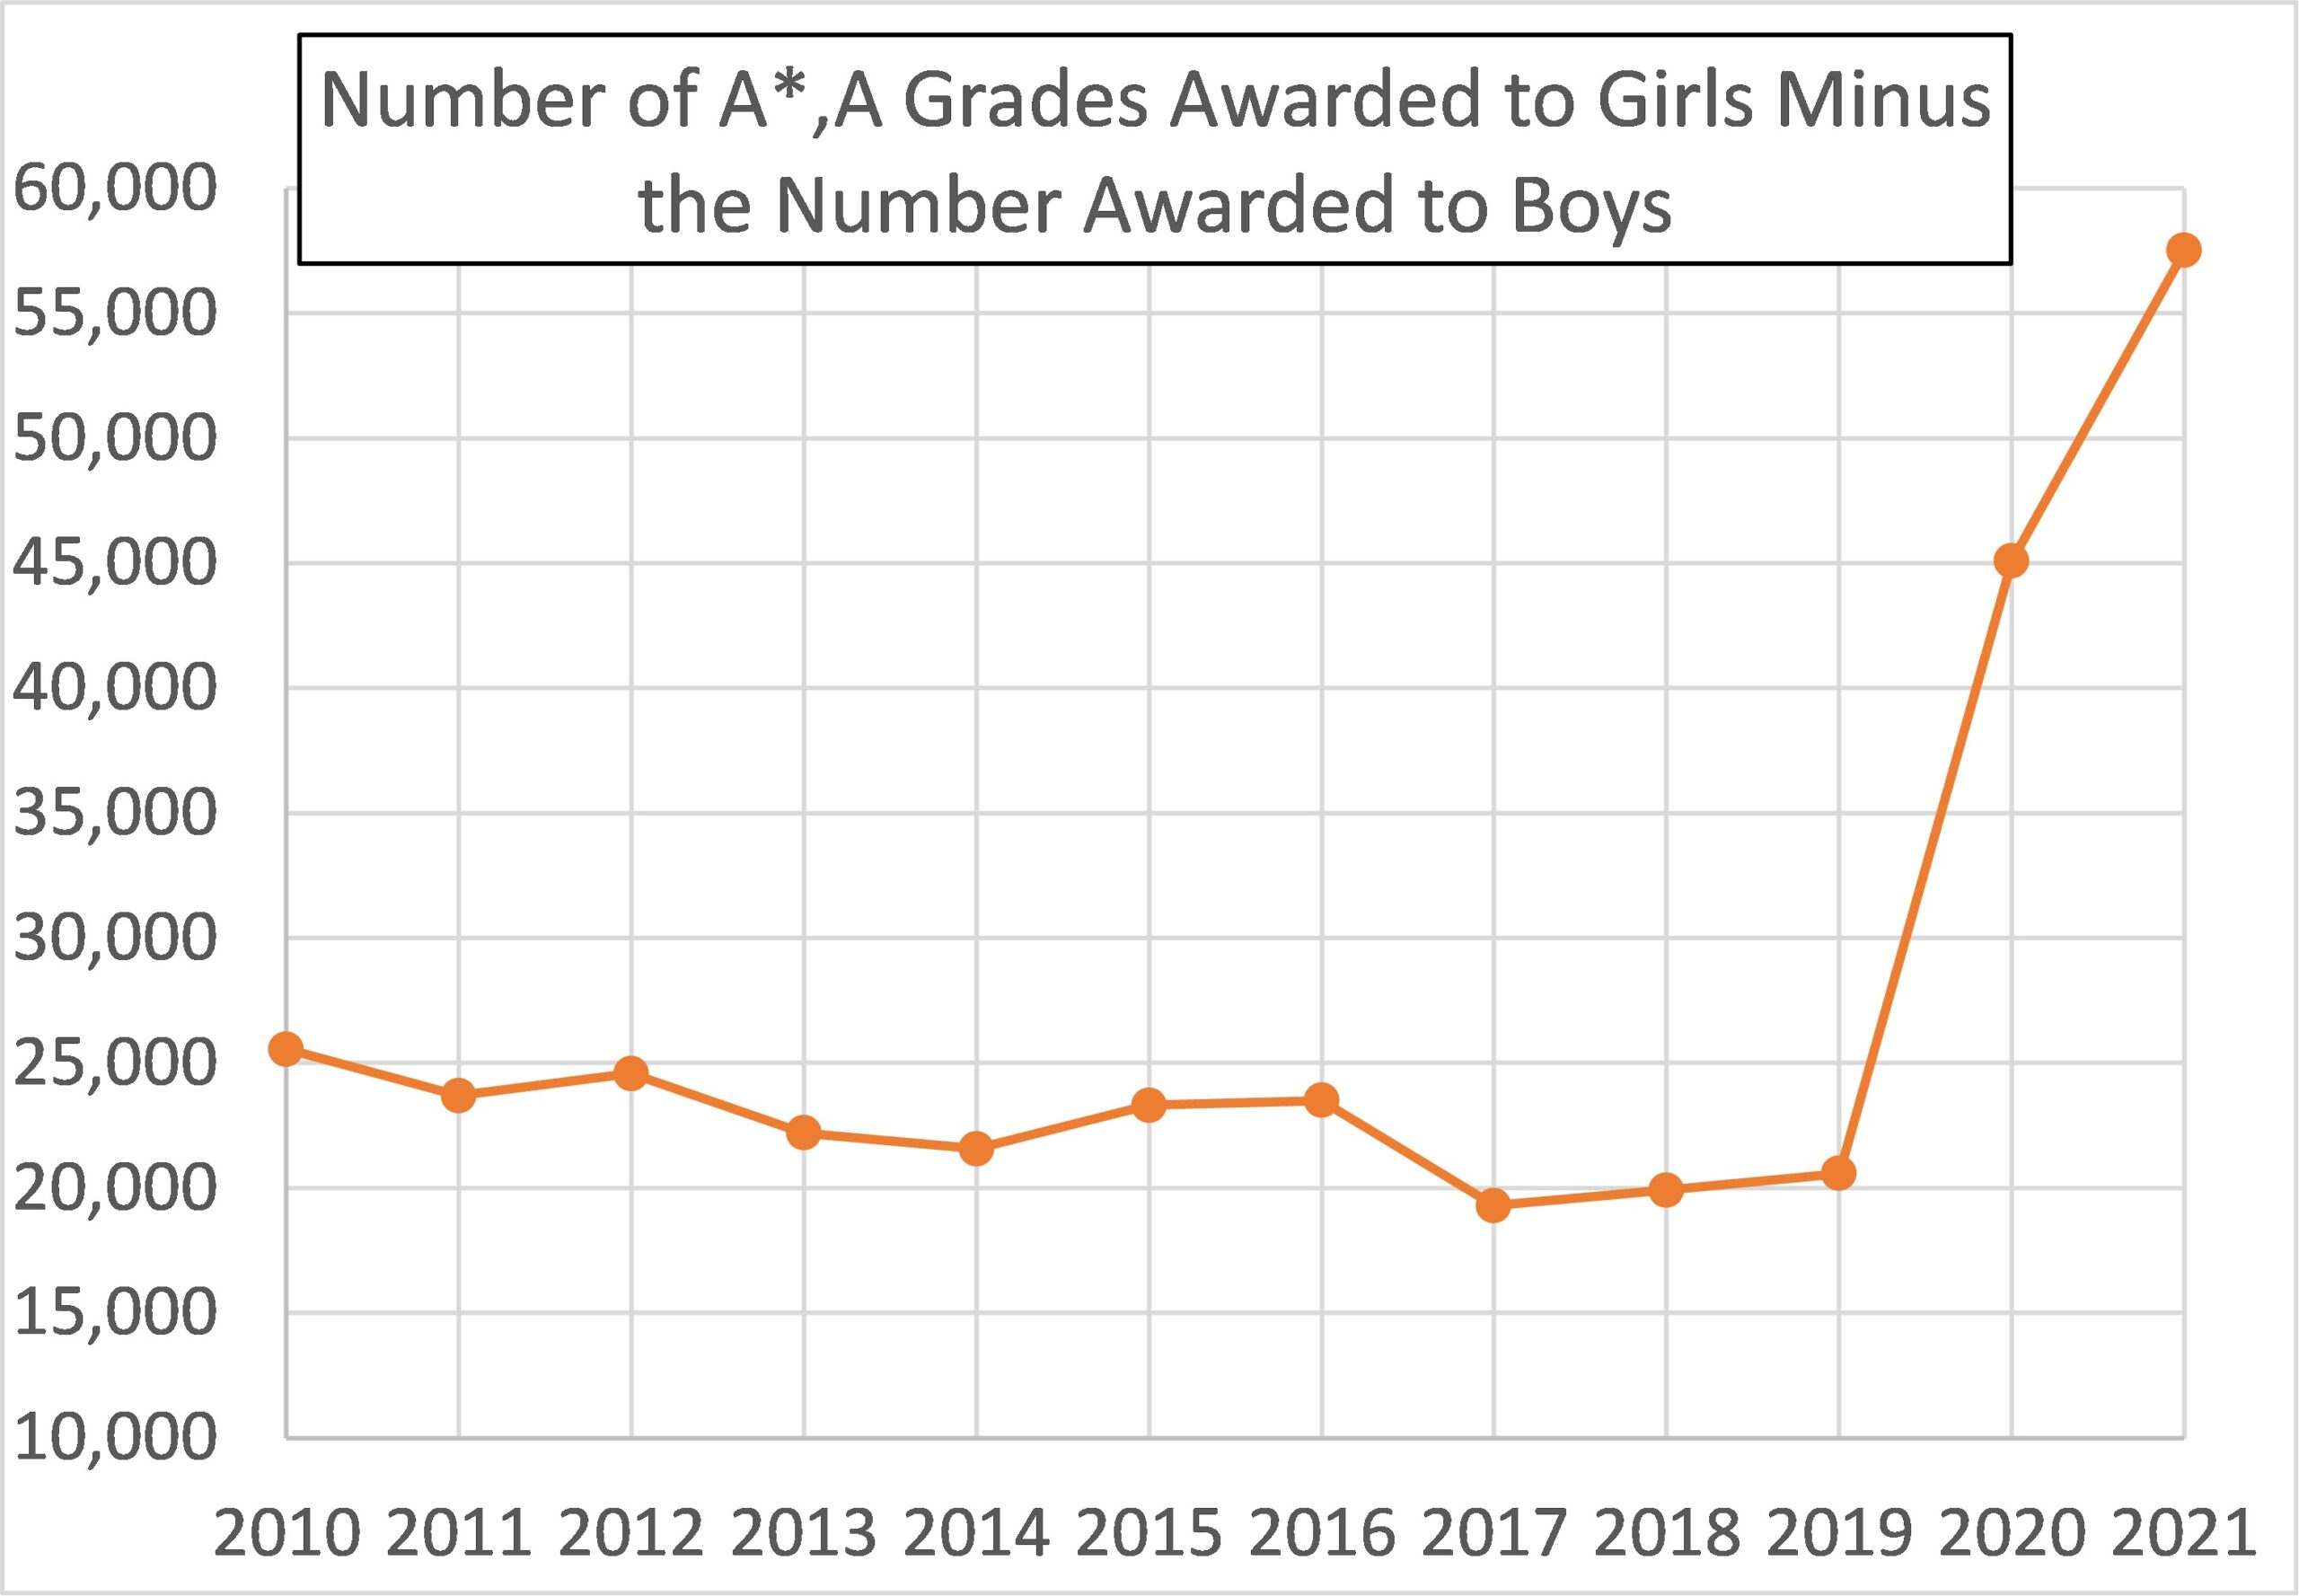
Table 1 lists the percentage of candidates awarded an A* grade this year, 2021, compared with 2019, for all subjects – and separately for boys and girls.
Based on exams in 2019, and across all subjects, a larger percentage of boys (8.2%) than girls (7.5%) were awarded A* grades. Based on teachers assessments in 2021, now a larger percentage of girls than boys are awarded A* grades overall.
| Percentage awarded A* | girls 2019 | girls 2021 | boys 2019 | boys 2021 |
| Biology | 7.3 | 19.1 | 6.4 | 17.3 |
| Eng.Lit. | 8.5 | 19.8 | 9.0 | 18.9 |
| Art & Design | 13.0 | 23.0 | 9.6 | 16.9 |
| Business | 4.0 | 12.7 | 2.8 | 8.4 |
| Chemistry | 6.6 | 19.0 | 8.7 | 20.2 |
| Computing | 3.7 | 25.7 | 3.4 | 18.9 |
| Economics | 7.6 | 23.0 | 6.3 | 16.6 |
| Eng.Lang. | 1.9 | 8.4 | 1.7 | 6.1 |
| EngLitLang | 2.9 | 11.8 | 2.9 | 9.2 |
| French | 10.0 | 26.2 | 10.2 | 27.9 |
| Geography | 7.3 | 20.5 | 3.5 | 10.4 |
| History | 5.2 | 18.3 | 4.5 | 13.0 |
| Law | 4.7 | 12.0 | 3.3 | 7.8 |
| Maths | 14.0 | 29.1 | 18.1 | 28.5 |
| Further Maths | 22.1 | 50.7 | 25.8 | 49.1 |
| Media | 1.9 | 10.2 | 1.1 | 5.1 |
| Physics | 8.5 | 25.3 | 8.8 | 20.9 |
| Politics | 7.7 | 20.8 | 5.9 | 17.5 |
| Psychology | 5.0 | 16.0 | 2.1 | 8.0 |
| Sociology | 5.3 | 12.2 | 2.9 | 6.5 |
| Sports & PE | 6.1 | 27.0 | 2.5 | 11.5 |
| D & T | 5.4 | 25.2 | 4.0 | 14.3 |
| Classics | 9.0 | 32.7 | 9.1 | 28.3 |
| Drama | 4.8 | 22.2 | 3.0 | 15.8 |
| German | 11.8 | 34.8 | 14.7 | 34.3 |
| Music | 3.7 | 24.4 | 5.2 | 23.1 |
| OML | 20.0 | 53.4 | 13.7 | 46.9 |
| Religious Studies | 4.3 | 16.1 | 4.5 | 15.8 |
| Spanish | 10.1 | 31.0 | 10.1 | 30.9 |
| Other Sciences | 4.0 | 13.5 | 7.2 | 14.6 |
| Other Subjects | 3.2 | 14.4 | 2.7 | 11.9 |
| All Subjects | 7.5 | 19.7 | 8.2 | 18.4 |
It is worth perusing Table 1 to gauge how preposterous has been the A* grade inflation. In 2019 just 3.7% of girls were awarded A* in Computing; in 2021 that became 25.7%. In 2019 just 6.1% of girls were awarded A* in Sports & PE; in 2021 that became 27%. Similarly, in Further Maths 22.1% became 50.7%, and in Physics 8.5% became 25.3%, and so on. Boys’ awards have inflated also, but not by quite so much.
As a result, girls have become dominant in almost all subjects as regards the percentage being awarded A* grades. Based on exams in 2019, a larger percentage of boys than girls attained A* grades in English Literature, Chemistry, French, Maths, Further Maths, Physics, Classics, German, Music, Religious Studies and Other Sciences. In 2021, based on teachers’ assessments, this list has shrunk to just Chemistry, French and Other Sciences. A larger percentage of girls than boys are now awarded A* in the male bastions of Maths, Further Maths and Physics.
Let’s look now at the sex bias, based on the assumption that 2019, based on exams, can be taken as the equitable datum.
Bias is then defined, as I did in 2020, as the excess of the percentage of girls over the percentage of boys gaining A or A* grades in 2021 (based on teacher assessments) minus the excess of the percentage of girls over the percentage of boys gaining A or A* grades in 2019 (based on exam results). Expressed algebraically,
bias = (G_TA – B_TA) – (G_Ex – B_Ex)
where G and B denotes girls and boys respectively, and subscripts TA and Ex denote teachers’ assessments (in 2021) and exam based results (in 2019) respectively. In other words, the bias is defined as how much the girls’ advantage has increased as a result of being assessed by teachers rather than by exam.
A positive bias is to girls’ advantage, or to boys’ disadvantage, and a negative bias vice-versa.
Table 2 lists the bias for all subjects separately. (NB: “All subjects” means all subjects where total candidates was in excess of 2,500. This only excludes Welsh, Irish, ICT, and Performing Arts).
Of the 31 subjects listed, the bias is in girls’ favour in all but 3 (all of them modern languages). Moreover, in all but one of the 28 subjects where the bias is in favour of girls, the bias has increased since 2020.
Across all subjects, the average bias in 2020 was 3.2%. In 2021 this has increased to 4.7%.
The bias is greater than 5% in 16 subjects, and in double figures for two subjects.
Figure 3 puts the impact of this bias in perspective. It has resulted in nearly 40,000 more A/A* grades being awarded to girls, compared to boys, than would otherwise have been the case. Given the competition for top university places, this suggests that the order of 20,000 or so places at top universities will go to girls that might otherwise have gone to boys. And this will have come about due to preferencing one sex over the other by teachers. The small biases expressed as percentages belies the potential magnitude of the impact on people.
| Subject | percentage bias 2020 | percentage bias 2021 |
| Art & Design | 3.4 | 4.0 |
| Biology | 0.8 | 2.4 |
| Business | 2.5 | 4.1 |
| Chemistry | 1.9 | 4.2 |
| Classical studies | 5.4 | 4.6 |
| Computing | 8.4 | 8.6 |
| Design & Technology | 5.2 | 10.6 |
| Drama | 2.8 | 5.1 |
| Economics | 4.5 | 5.6 |
| English Literature | 2.9 | 3.5 |
| English Language | 4.3 | 5.2 |
| English Lit & Lang | 2.7 | 3.0 |
| French | 1 | 2.2 |
| Geography | 6.1 | 7.1 |
| German | 0.3 | -1.8 |
| History | 5.7 | 7.5 |
| Law | 0.8 | 3.6 |
| Maths | 6.1 | 7.3 |
| Further Maths | 5 | 6.3 |
| Media & film | 6.6 | 9.6 |
| Music | 4.3 | 5.5 |
| Physics | 4.8 | 5.4 |
| PE / Sports | 8.4 | 11.7 |
| Politics | 1.9 | 3.6 |
| Psychology | 4.8 | 7.4 |
| Religious Studies | 2 | 2.3 |
| Sociology | 4.1 | 5.6 |
| Spanish | 0.8 | -0.4 |
| Other Sciences | -1.1 | 7.8 |
| OML | -1.3 | -3.4 |
| Other Subjects | 2.3 | 4.0 |
| All Subjects | 3.2 | 4.7 |
The Ofqual Analysis
Recall that the Department for Education has rejected claims of systemic bias against boys in this year’s A Levels, saying that this possibility has been ruled out by Ofqual’s analysis Summer 2021 student-level equalities analysis: GCSE and A level by Ming Wei Lee. Here I make a brief critique of that analysis. I emphasise that I have no reason to doubt either the numerical accuracy or the factual correctness of the text of that report.
I note firstly that the A Levels used in the analysis did not include Maths. This is extremely odd because Maths is far and away the most popular A Level, attracting nearly 100,000 entrants. In particular, roughly twice as many boys take Maths as take boys’ next favourite subjects, Physics and Chemistry. I also note that Law and Politics – and Further Maths – were not included, which between them would account for about 47,000 entrants.
The analysis uses multivariate regression which means that the effect of sex can be isolated from the effect of the other variables used. I have no difficulty with this as a technique, nor with controlling for variables such as ethnicity, primary language, special educational needs or disabilities (SEND), or free school meal status or other markers of socioeconomics.
However, the use of prior attainment as a control variable has a huge, glaring problem. It turns out not to matter much for this particular analysis, but it would matter a great deal in more general situations. Let me explain…
For A Level candidates their “prior attainment” is based on their GCSE score (which would usually be two years earlier), specifically a mean GCSE score normalised to lie between 0 and 100.
Similarly, although I’m not looking at this here, the “prior attainment” used in conjunction with GCSEs was Key Stage 2 SATS results (usually taken 5 years earlier).
The huge, glaring problem I have with this as a methodology is that it’s an excellent way of hiding bias if the bias existed, and was roughly constant, throughout the whole of schooling – or, at least from Key Stage 2 SATS to A Level. In this situation, bias would be aliased by prior attainment and hence would become invisible.
To spell this out: if you did poorly in your GCSEs then did comparably poorly in your A Levels two years later, your poor performance would not get attributed to your sex, your ethnicity, or to any of the other variables because “prior attainment” explains it. But what if you were actually discriminated against (perhaps on grounds of sex, or of ethnicity, or whatever) when doing your GCSEs, and equally discriminated against at A Level? This could not be picked up because the discrimination has already been built into the “prior attainment” measure at GCSE.
The same applies to GCSEs in respect of the prior attainment measure based on Key Stage 2 SATS. And as I have already identified that there is sex-based bias against males in Key Stage 2 SATS (see Girls Are Just Cleverer) I have therefore already established that the “prior attainment” process is broken from the start.
The way this would work in practice is that an apparent sex bias at A Level might be rationalised away (via the multivariate regression) as due to differing “prior attainments”, which is effectively a code for saying “yes girls did better a A Level because they did better at GCSE (sub-text, because they are cleverer, not because of bias)”. Here are Ming Wei Lee word’s explaining how the process works,
“Multivariate analyses allow the effect of a variable to be examined while holding other variables constant. For example, the descriptive statistics may show that females outperform males, and that candidates with high prior attainment outperform candidates with low prior attainment. A multivariate analysis allows us to hold prior attainment constant while estimating the gender difference in results, and vice versa. If the gender difference seen in descriptive statistics disappears in the multivariate analysis, we would conclude that the females in our sample had higher prior attainment indicating higher ability than the males and that it was this difference in ability that led to their higher performance, not their being female per se.”
There are other problems with the “prior attainment” control such as the subjects in question. At GCSE it is usual to take a wide range of subjects, and most will be verbal subjects – languages and “essay” subjects. Many people, especially boys, have had weak verbal skills throughout their school career and these people flood into the non-verbal subjects, maths and the sciences, at A Level. This is, I expect, why Ming Wei Lee finds a positive gender effect in 2018 and 2019 (i.e., essentially meaning, due to prior attainment control, that boys did better at A Level than their mean performance at GCSE – when all were exam based).
However, I digress as this prior attainment issue is not very important for the key result, which is the comparison between 2019 and 2021. The reason is that the skew introduced by the prior attainment control cancels when these two A Level years are compared (as both are subject to prior attainment control in the same way). The Ofqual result most nearly comparable with my analysis is that for the change between 2019 and 2021 of the probability of attaining Grade A and above. The outcome of interest is this,
“Probability of grade A and above: (i) 19 of the 22 between-group comparisons (on ethnicity, language, FSM, deprivation) showed no notable change from 2019 to 2021; (ii) the gap between males and females and the gap between SEND candidates and non-SEND candidates, have shifted from positive to negative, indicating that in 2019, male candidates and SEND candidates had higher outcomes than prior-attainment-matched female candidates and non-SEND candidates respectively, but in 2021, the direction of the difference reversed. The shifts represent changes of 4.36 percentage points on the gender variable and 2.07 percentage points on the SEND variable.”
So, the bottom line is that the Ofqual analysis identifies, as an average across the subjects analysed, that being female improved your probability of gaining an A or A* grade by 4.36%. This is closely comparable with the average bias I found, namely 4.7% (Table 2).
The same finding is there in the Ofqual analysis if one knows how to read it. However, Ofqual did not report this result on a subject by subject basis – and my Table 2 shows that 16 individual subjects have a greater bias than this.
My beef with the Ofqual report is that it fails to represent how serious is the bias identified – as best illustrated by my Figure 3. Nearly 40,000 more top grades to one sex simply by virtue of their sex is not a small matter, yet there is no hint of this significance in the Ofqual report. The Executive Summary contains this rather anodyne reference to the key result,
“Some groups showed notable changes from 2019 to 2021 on all 3 results measures. Male candidates, candidates with SEND, candidates in secondary selective schools, sixth form and tertiary colleges, have seen, from 2019 to 2021, a small decrease in outcomes (small changes not exceeding 0.2 grade) relative to prior-attainment-matched candidates of their respective comparator group, namely, female candidates, candidates without SEND, candidates in academies respectively.”
The main text of the report is no more explicit. The small-scale plots used to illustrate the findings graphically do a good job of minimising differences, and one suspects that might have been the intention. Figures 4 and 5 are the two plots which show the gender effect, Figure 4 based on the mean grade and Figure 5 on Grades A/A*…

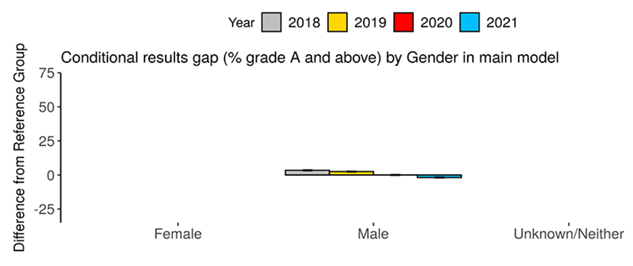
I think we can agree that these Figures do not have the same impact as my Figures 2 and 3. There is more to honesty that merely never being untruthful. Here’s an example of a honest depiction of what has happened: the excess of top A/A* grades awarded to girls over boys has nearly tripled since the last exam year, 2019.
And as for the Department for Education’s claim that this Ofqual analysis has “ruled out” any systemic bias against boys – err, no, it’s there – in that 4.36%. But between a report which minimises this finding, close to the point of invisibility, and the Chinese whispers that no doubt apply between Ofqual management and Department for Education officials, the reality of my Figures 2 and 3 is conveniently magicked away so as to cause no embarrassment.