This is an update of my February’23 post on excess deaths. Please see that post for details of the methodology employed. Like the last article, this one is concerned with the statistical significance, or otherwise, of the apparent excess death data.
Data relate to England and Wales.
I define excess deaths with respect to the five years immediately before Covid-19, i.e., 2015 to 2019. This differs from the ONS definition of excess deaths since 2022. For year 2023, excess deaths reported by ONS are with respect to the average of years 2017, 2018, 2019, 2021 and 2022. If one wishes to investigate the hypothesis that death rates have increased since before Covid-19, then the ONS definition is useless. Why the ONS adopt that definition I do not know, but their measure of excess deaths is inappropriate for my purpose here.
In this post I introduce two refinements to the previous methodology to address concerns in my own mind as to the robustness of the February claim, namely that non-Covid deaths in almost every week between May’22 and February’23 exceeded expectation based on years 2015-2019 at greater than 95% statistical confidence. The two refinements are as follows,
Previously I estimated the variance in weekly deaths prior to Covid-19 using the ten years 2010 to 2019. I have since realised that death rates had an upward trend over that decade, so part of what I attributed to variance was systematic increase. I have now redefined the variance using only the years 2015 to 2019, consistent with the basis of the expected (i.e., pre-Covid) death rate.
The second refinement relates to population increase. In taking as the measure of interest the raw excess deaths, as opposed to the excess death rate, i.e., the excess deaths per 100,000, one cannot be confident in the interpretation. An observed increase in excess deaths might, in other words, simply be due to an increasing population subject to an unchanging death rate. This is a potentially serious shortcoming, of which I was aware but assumed the increase in population over the few years in question (essentially 2017 to 2022 or 2023) would be too small to invalidate the result based on absolute excess deaths. I am no longer content to assume this and so I have adopted a procedure to correct for population increases.
The population of England and Wales up to mid-2021 has been taken from ONS data (release 21 December 2022). The population has been rising, but 2021 was an exception with slightly fewer in the population than in 2020 (mid-year estimates).
[As an aside I note that the decline in population in 2021 was despite the net immigration in the year ending December’21 being around 400,000, i.e., over 0.6%, which provides an indication of the underlying reduction in the resident population].
Between the average of the period 2015-2019 to 2021 the population increased by 1.7%. Extrapolating I take the increase to mid-2022 and mid-2023 to be 2.1% and 2.5% respectively. To account for the effect of these population increases on numbers of deaths I shall reduce the latter by factors of 0.983, 0.979 and 0.975 in years 2021, 2022 and 2023 respectively.
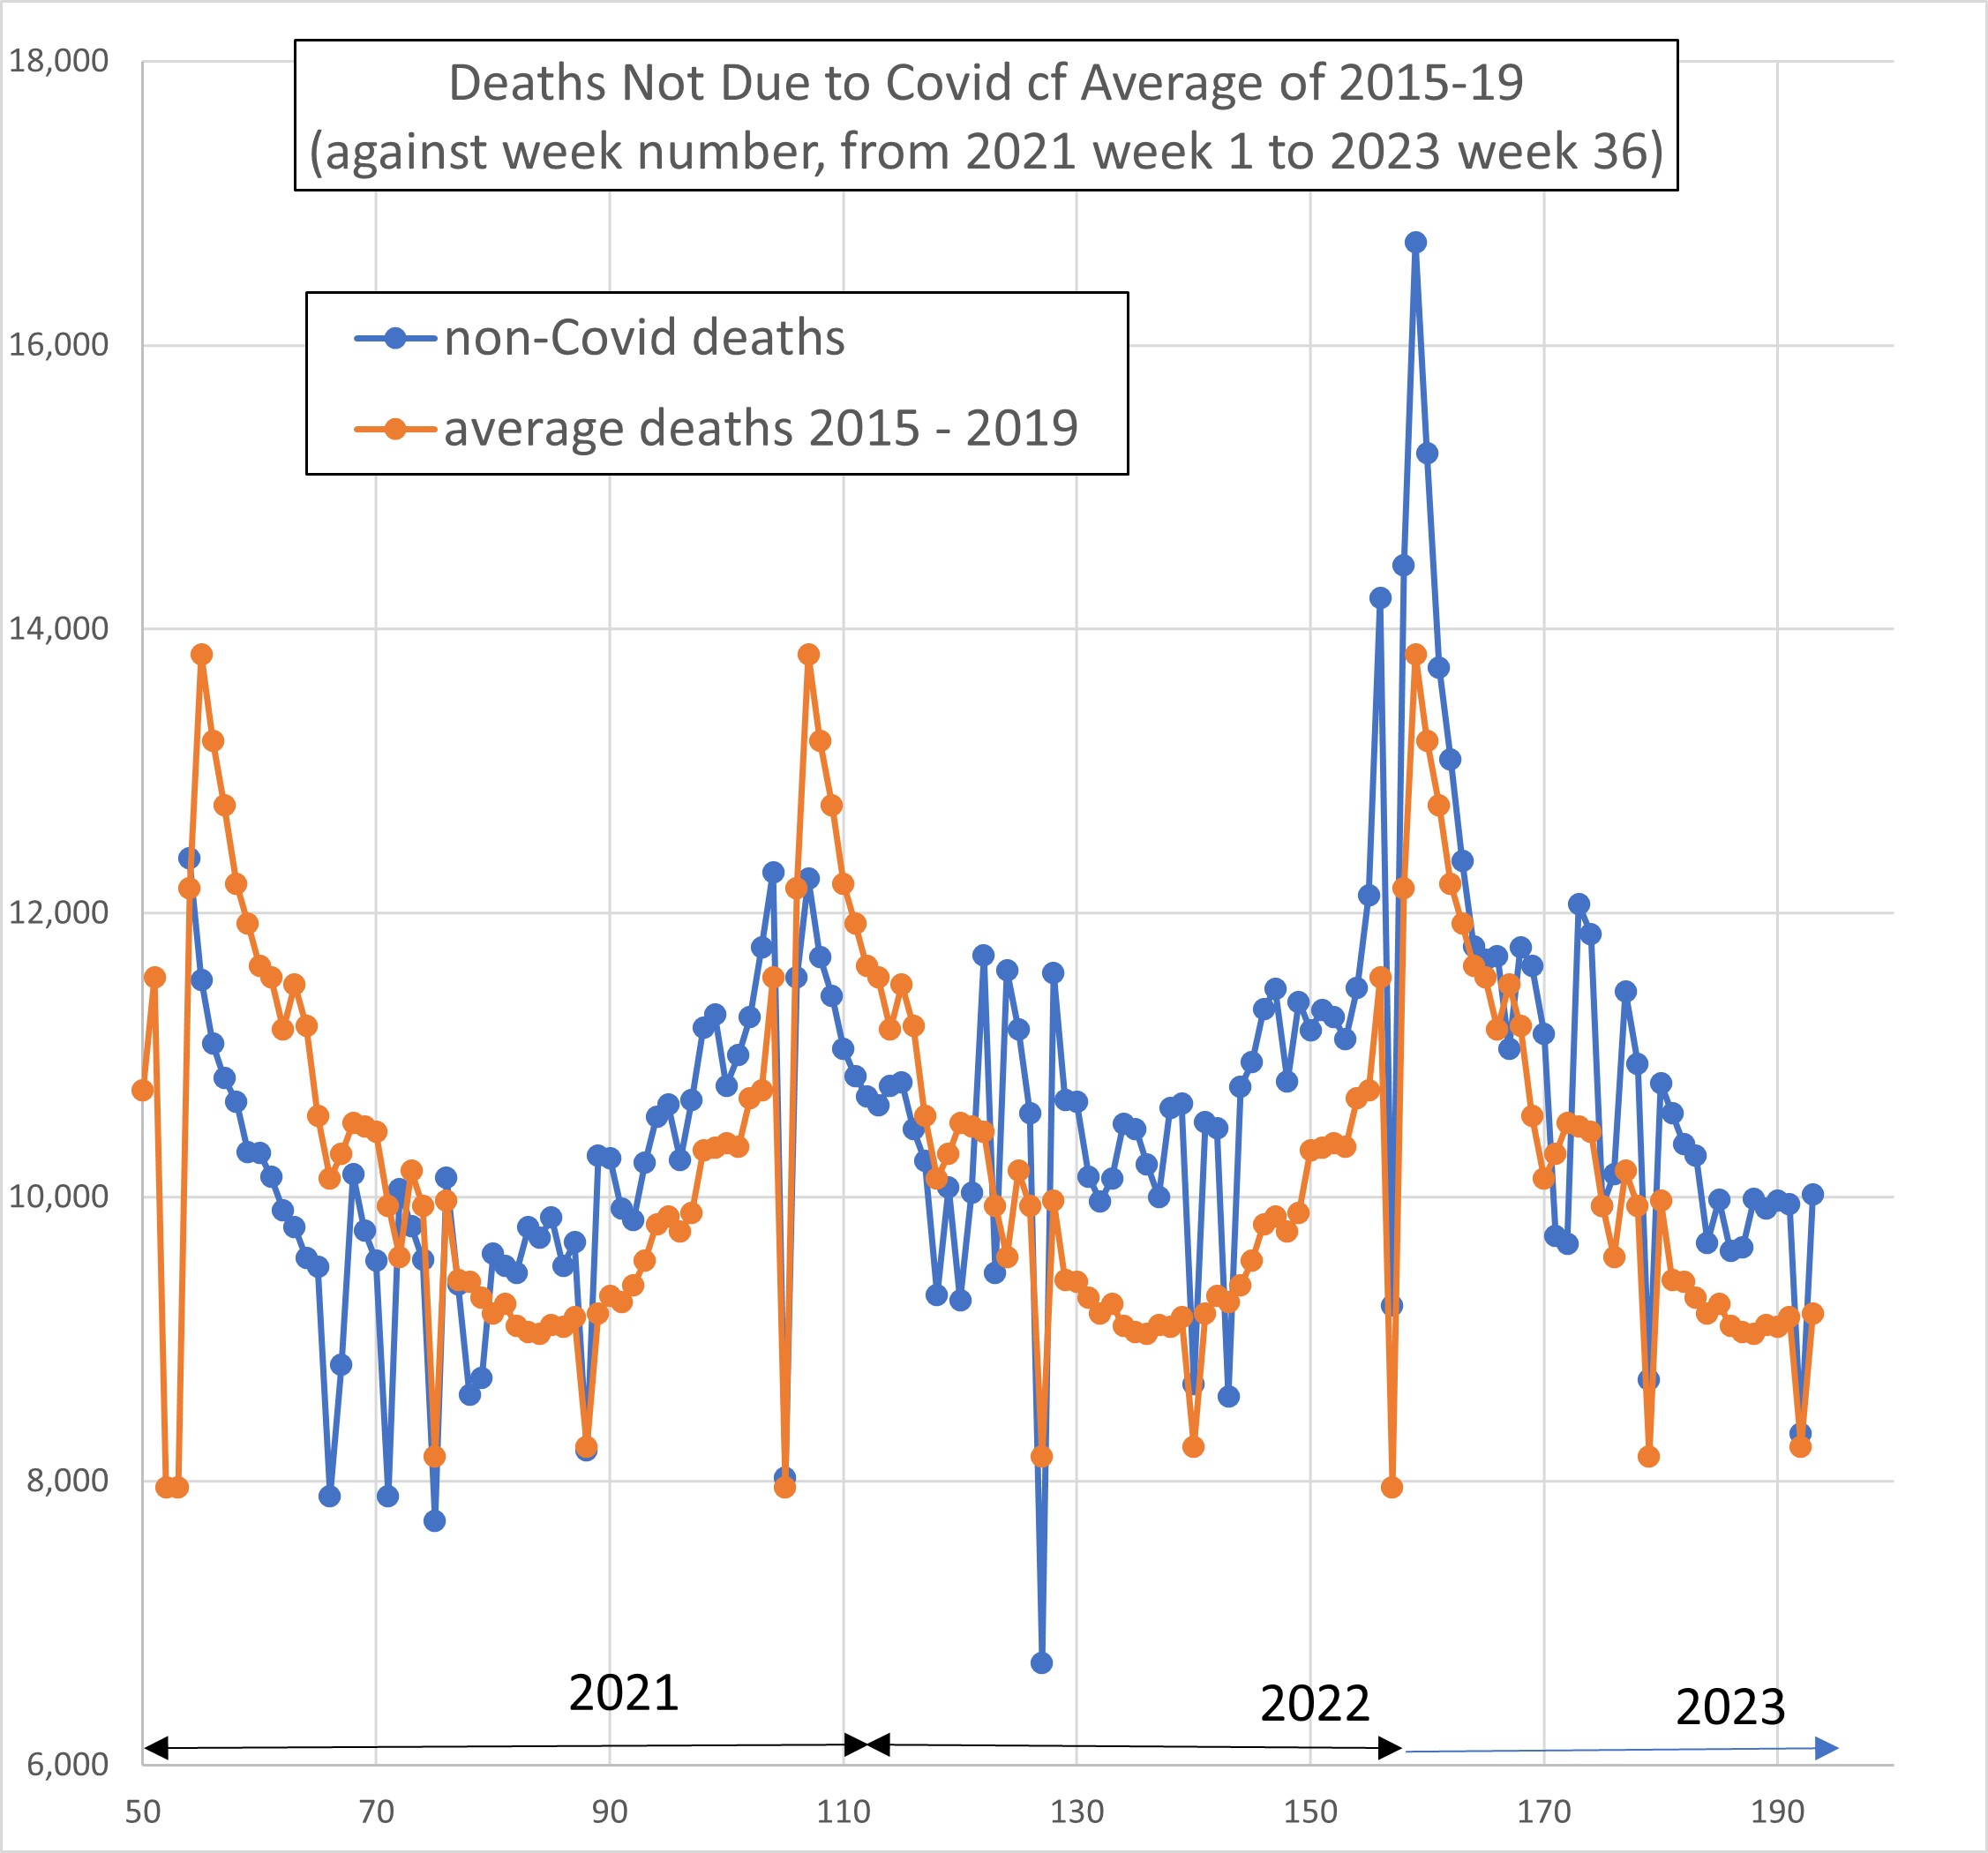
The death data was taken from Deaths registered weekly in England and Wales, provisional – Office for National Statistics (ons.gov.uk). I used the 2023 dataset when its latest data was week 36 (the first week of September 2023). The Figure which heads this post shows the uncorrected number of deaths per week not due to Covid compared with the average in years 2015 – 2019, for the same week in the year.
Firstly I give the uncorrected results. Figure 1, below, plots the non-Covid weekly excess deaths from the start of January 2021 (week 53 from a datum at 1st January 2020) to the first week of September 2023 (week 193). The y-axis is the number of excess deaths that week divided by the average number of deaths in the same week in years 2015 – 2019, as a percentage. The red dashed and red dotted lines are respectively the upper and lower bounds of the excess deaths in the period 2015 – 2019, defined as +/-1.65 standard deviations expressed as a percentage of the 2015-2019 average. Hence, the region between the two red curves defines where excess deaths would not be significantly different from pre-Covid. Data above the upper bound indicates weeks where the excess deaths are significantly greater than expected on the basis of the pre-Covid data, at the 95% confidence level or better.
Figure 2 is as Figure 1 but for total deaths. The Covid peak in early 2021 is clearly evident.
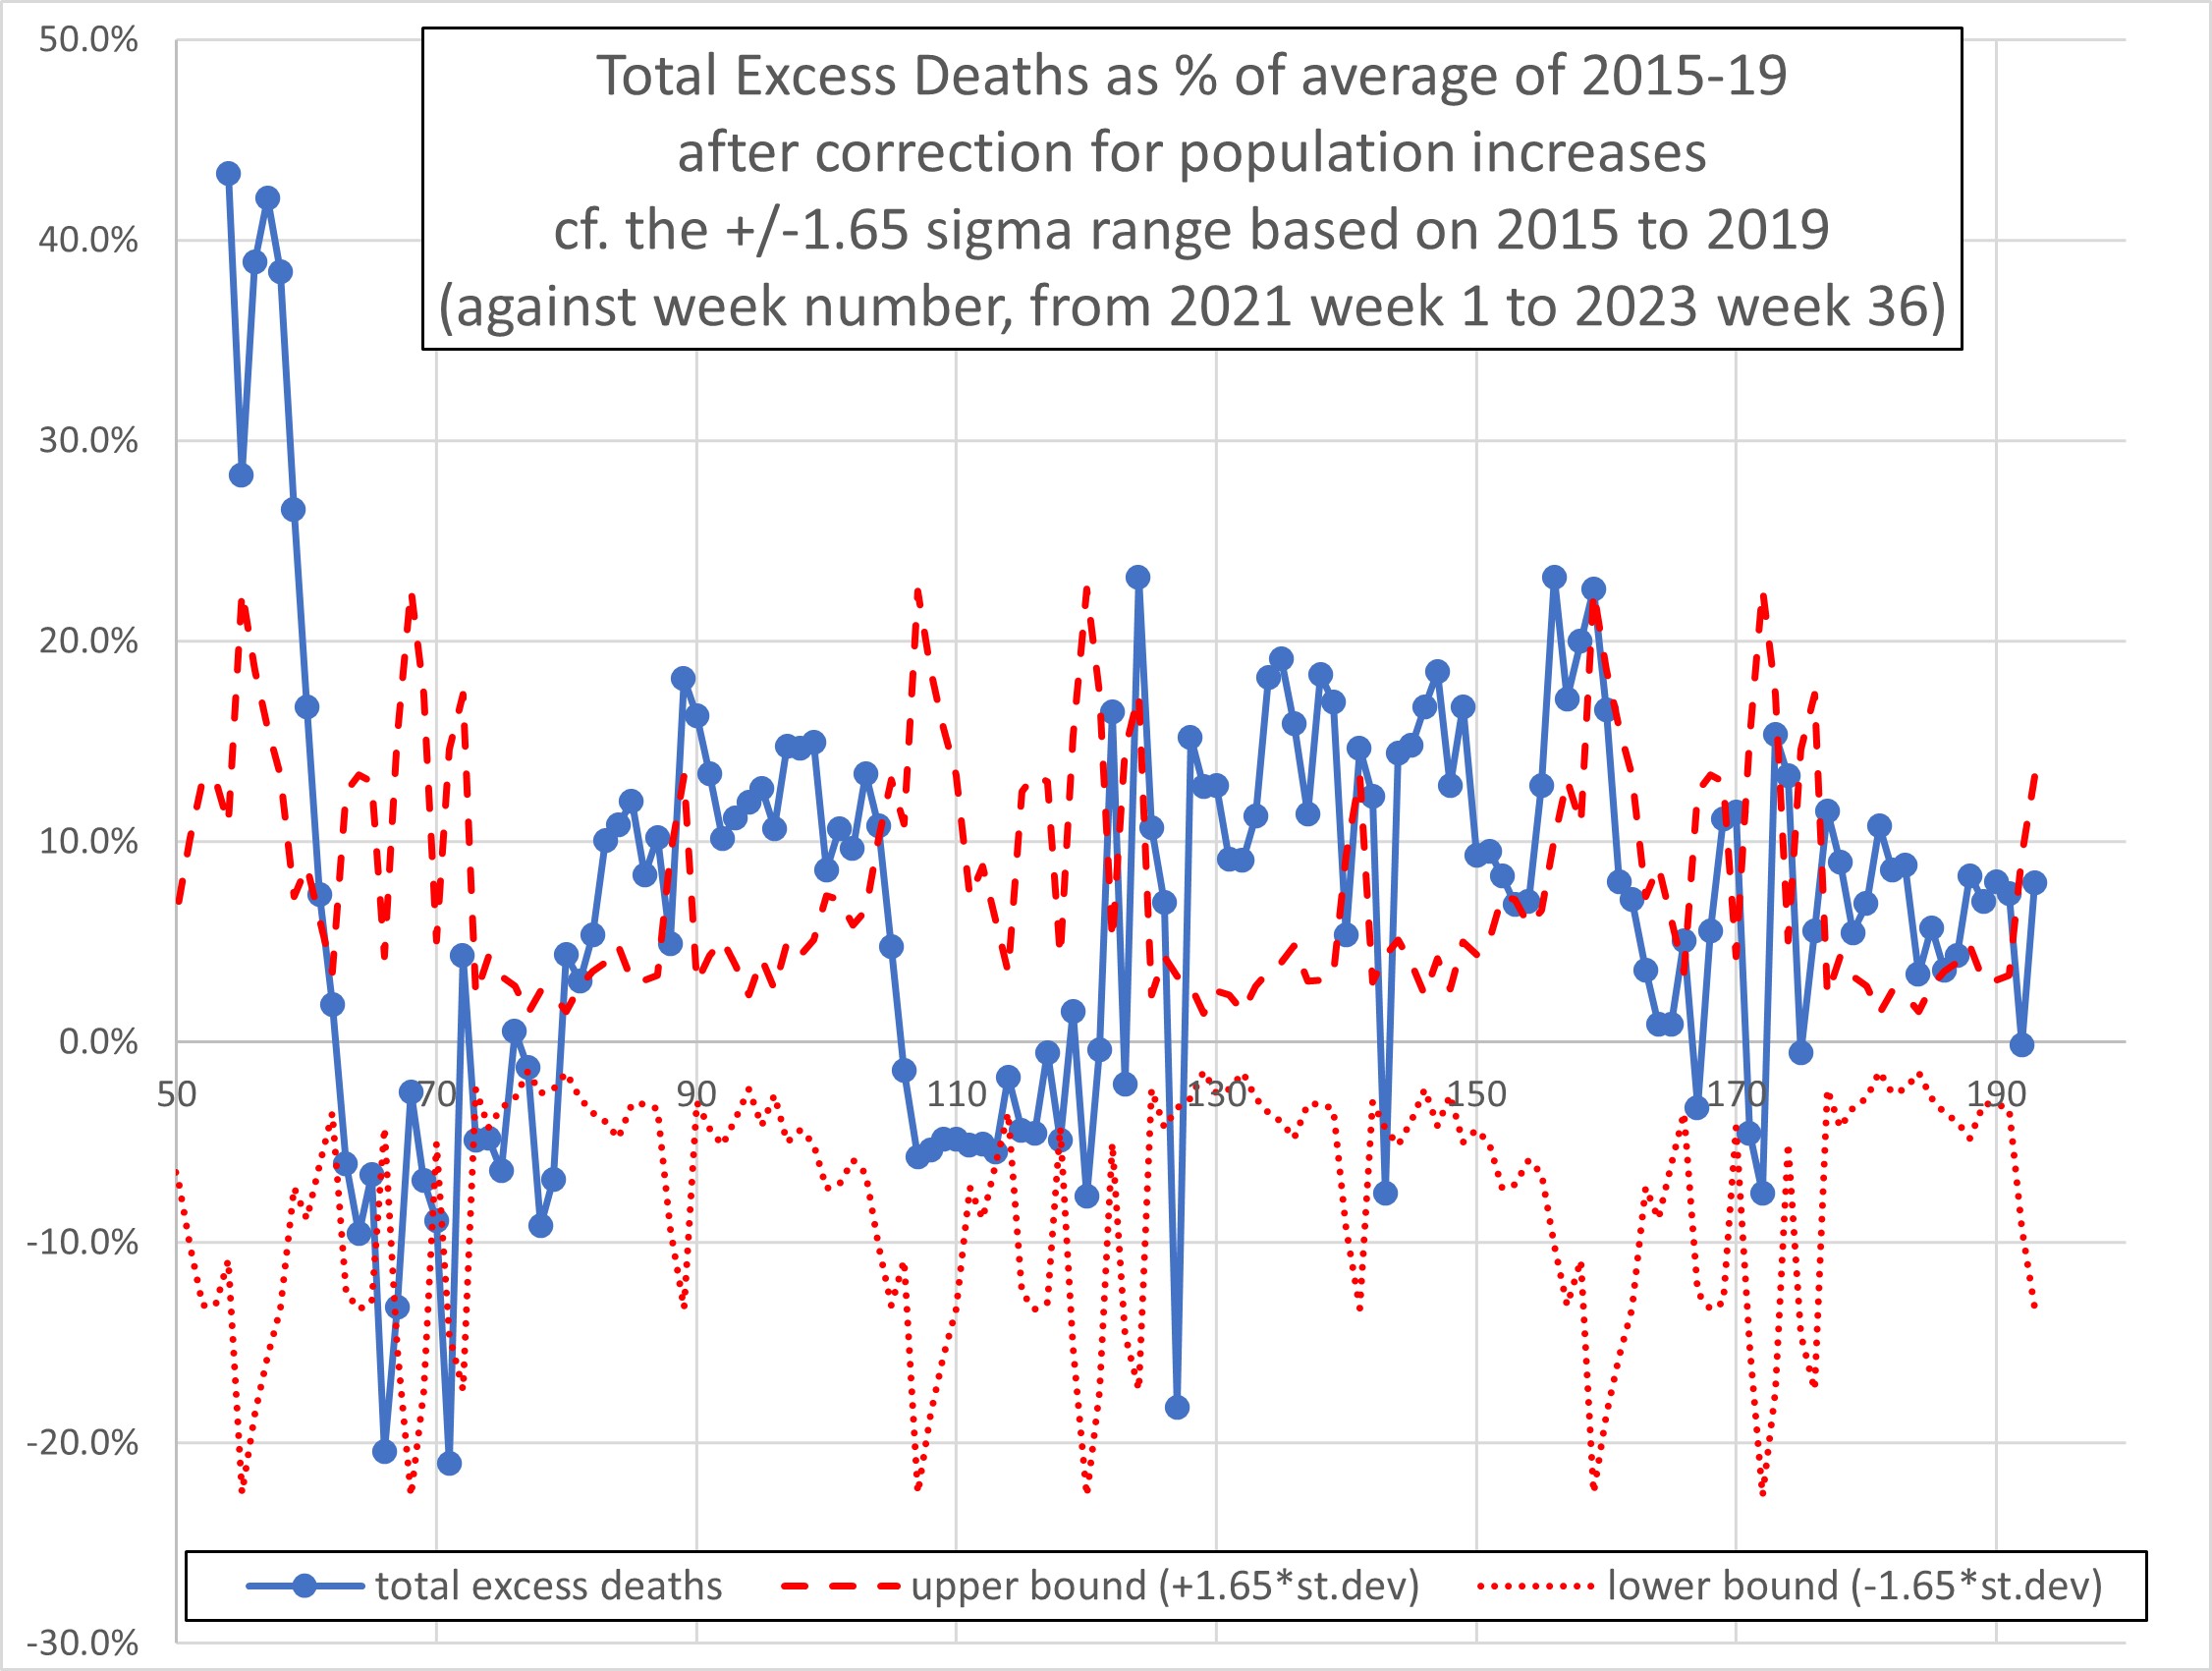
Figure 3 is as Figure 1 (non-Covid deaths) but with the corrections due to population increases incorporated. This is the key graph. In the 69 weeks from week 124 (mid-May 2022) to week 193 (1st week of September 2023) 60 weeks (87%) had positive excess deaths not due to Covid. In the same 69 weeks, 42 weeks (61%) had excess non-Covid deaths above the upper bound and hence statistically significant.
Figure 4 is as Figure 3 but for total deaths (i.e., including the corrections for population increases). In the 69 weeks from mid-May 2022 to September 2023, 63 weeks (91%) had positive excess deaths. In the same 69 weeks, 49 weeks (71%) had excess deaths above the upper bound and hence statistically significant.
Conclusions
- Correcting for population changes, in the 69 weeks to the first week of September 2023, 61% had non-Covid excess deaths which were statistically significant (i.e., the number of deaths were significantly above expectation based on the five years pre-Covid).
- 87% of the same period had positive excess non-Covid deaths.
- The average weekly number of non-Covid excess deaths between mid-May 2022 and the first week of September 2023 was 933 (or 9.3%). This is an annual excess of non-Covid deaths of 48,500.
- A debate in Parliament on excess deaths has finally been granted to MP Andrew Bridgen on Friday 20th October. It will be interesting to witness the concern of our parliamentarians and government as will no doubt be manifest by a full house and lively contributions from many other MPs.
Figure 1
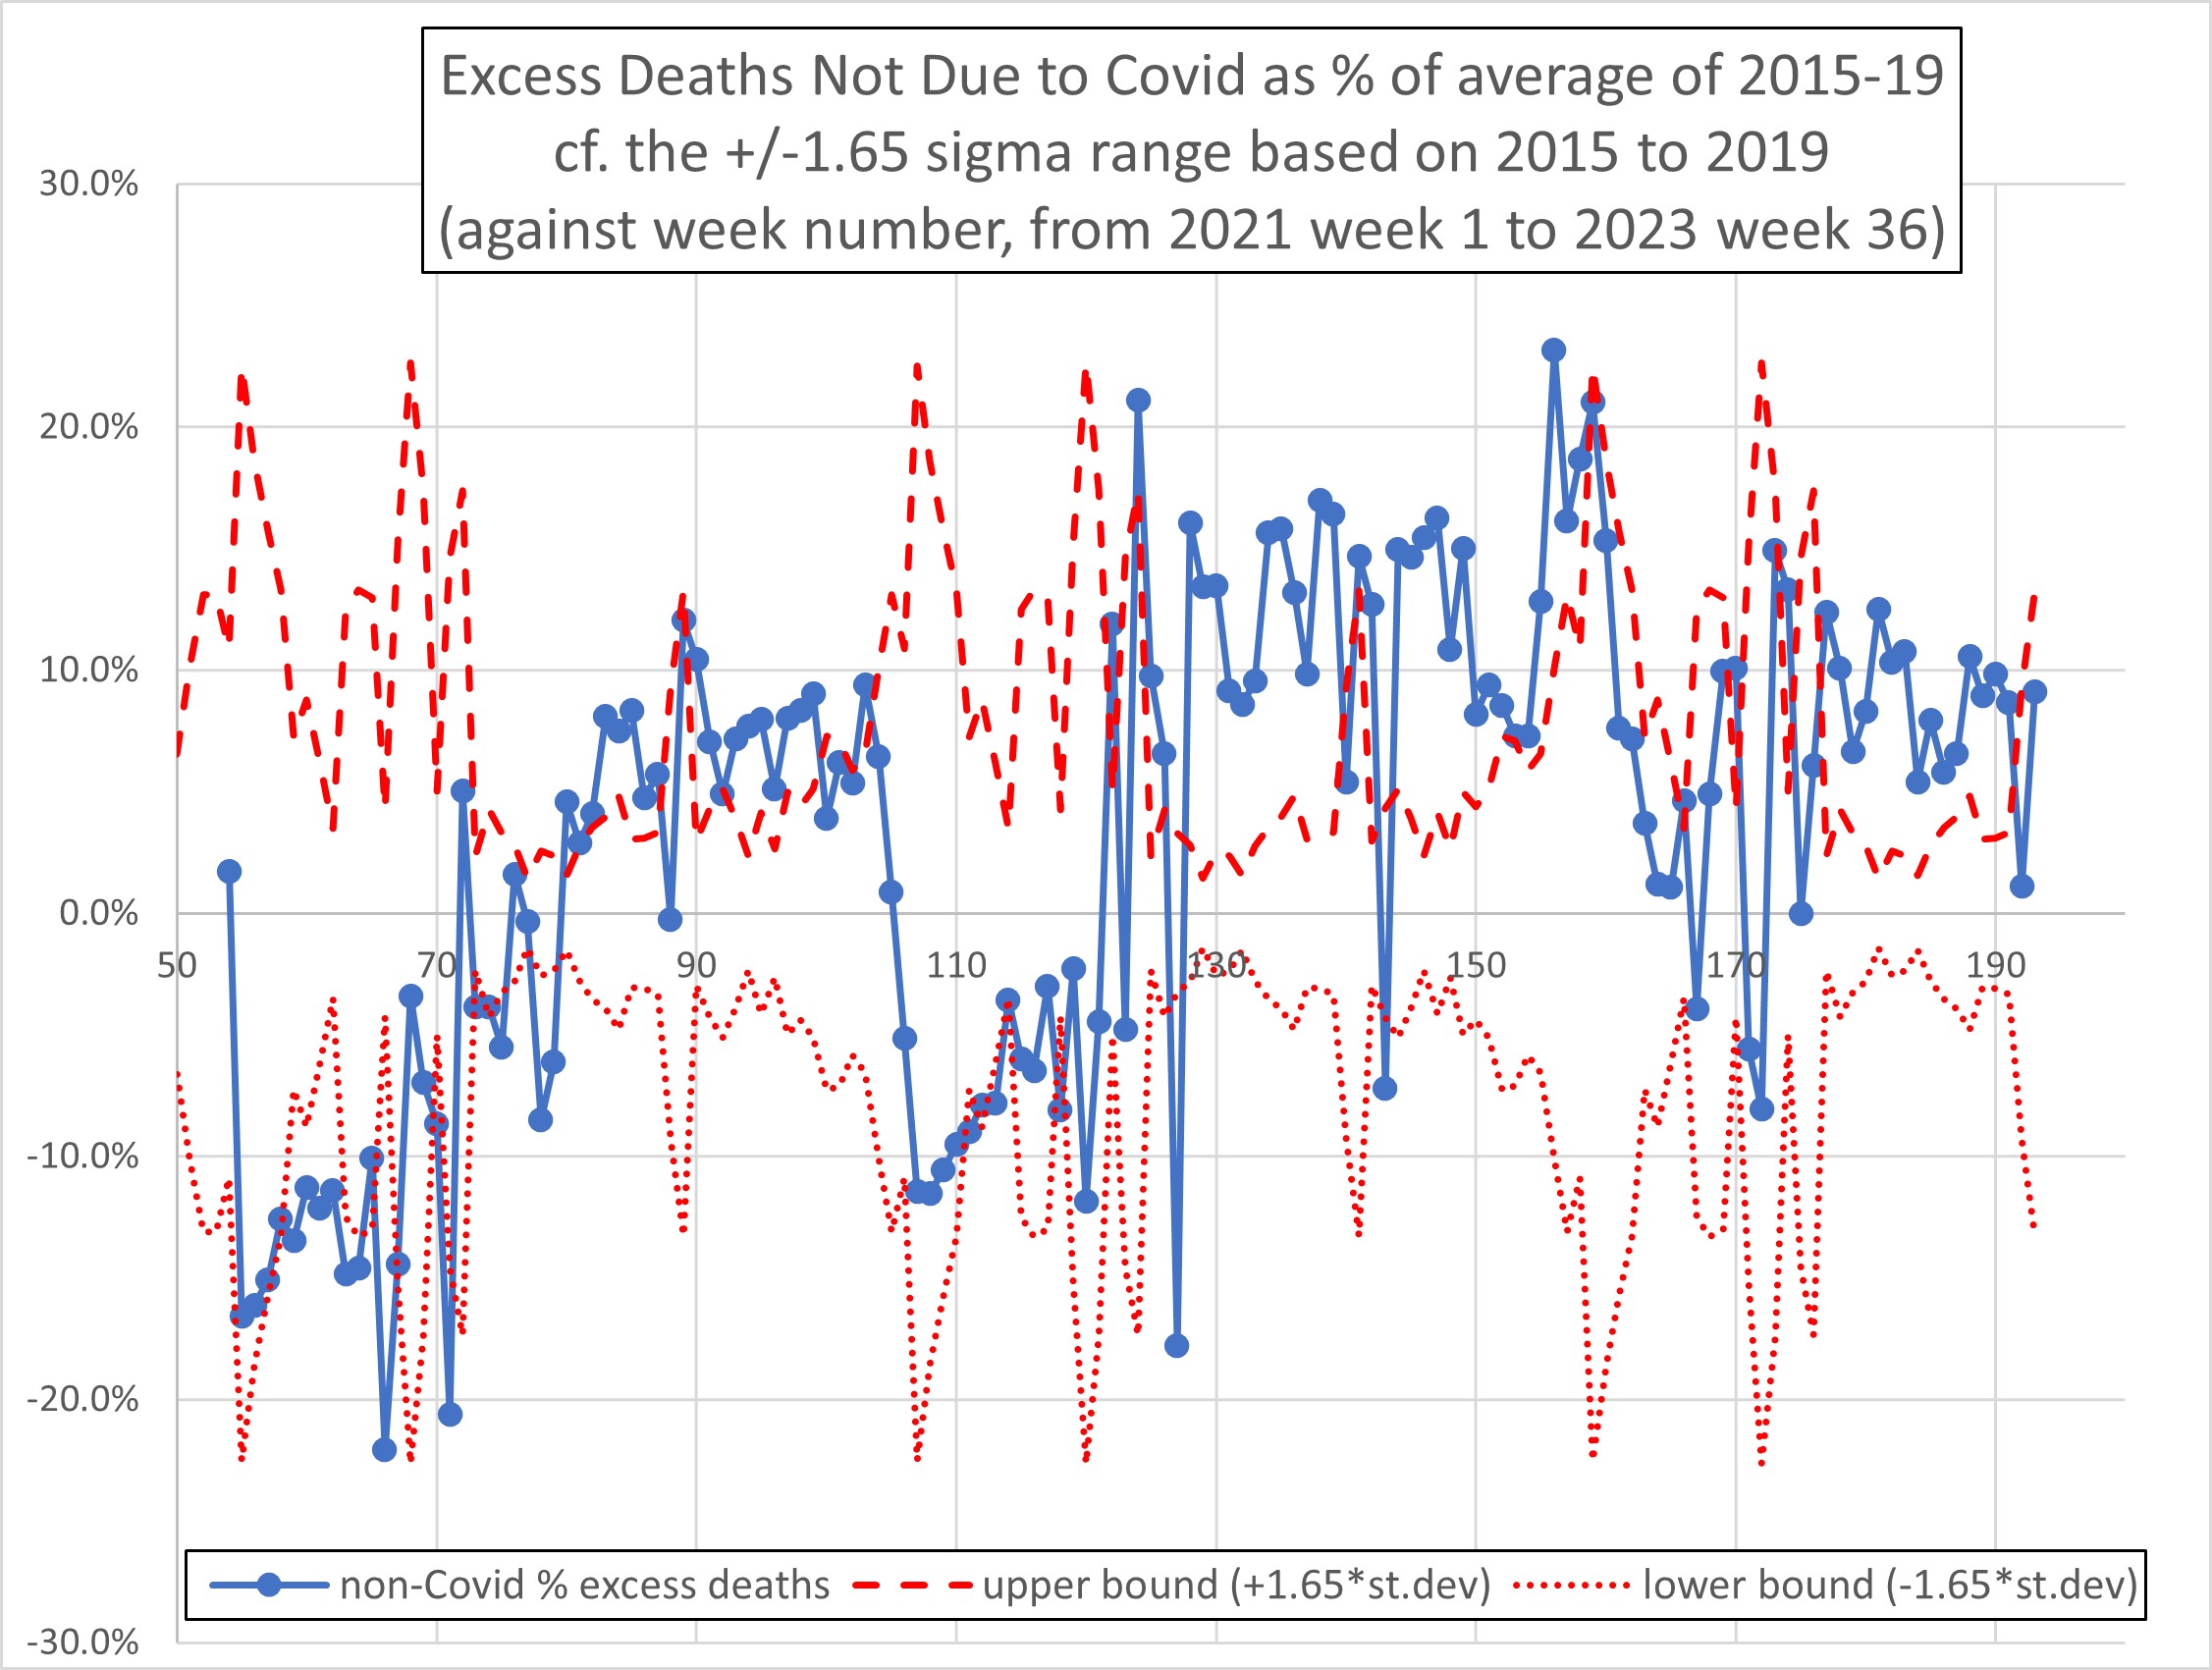
Figure 2
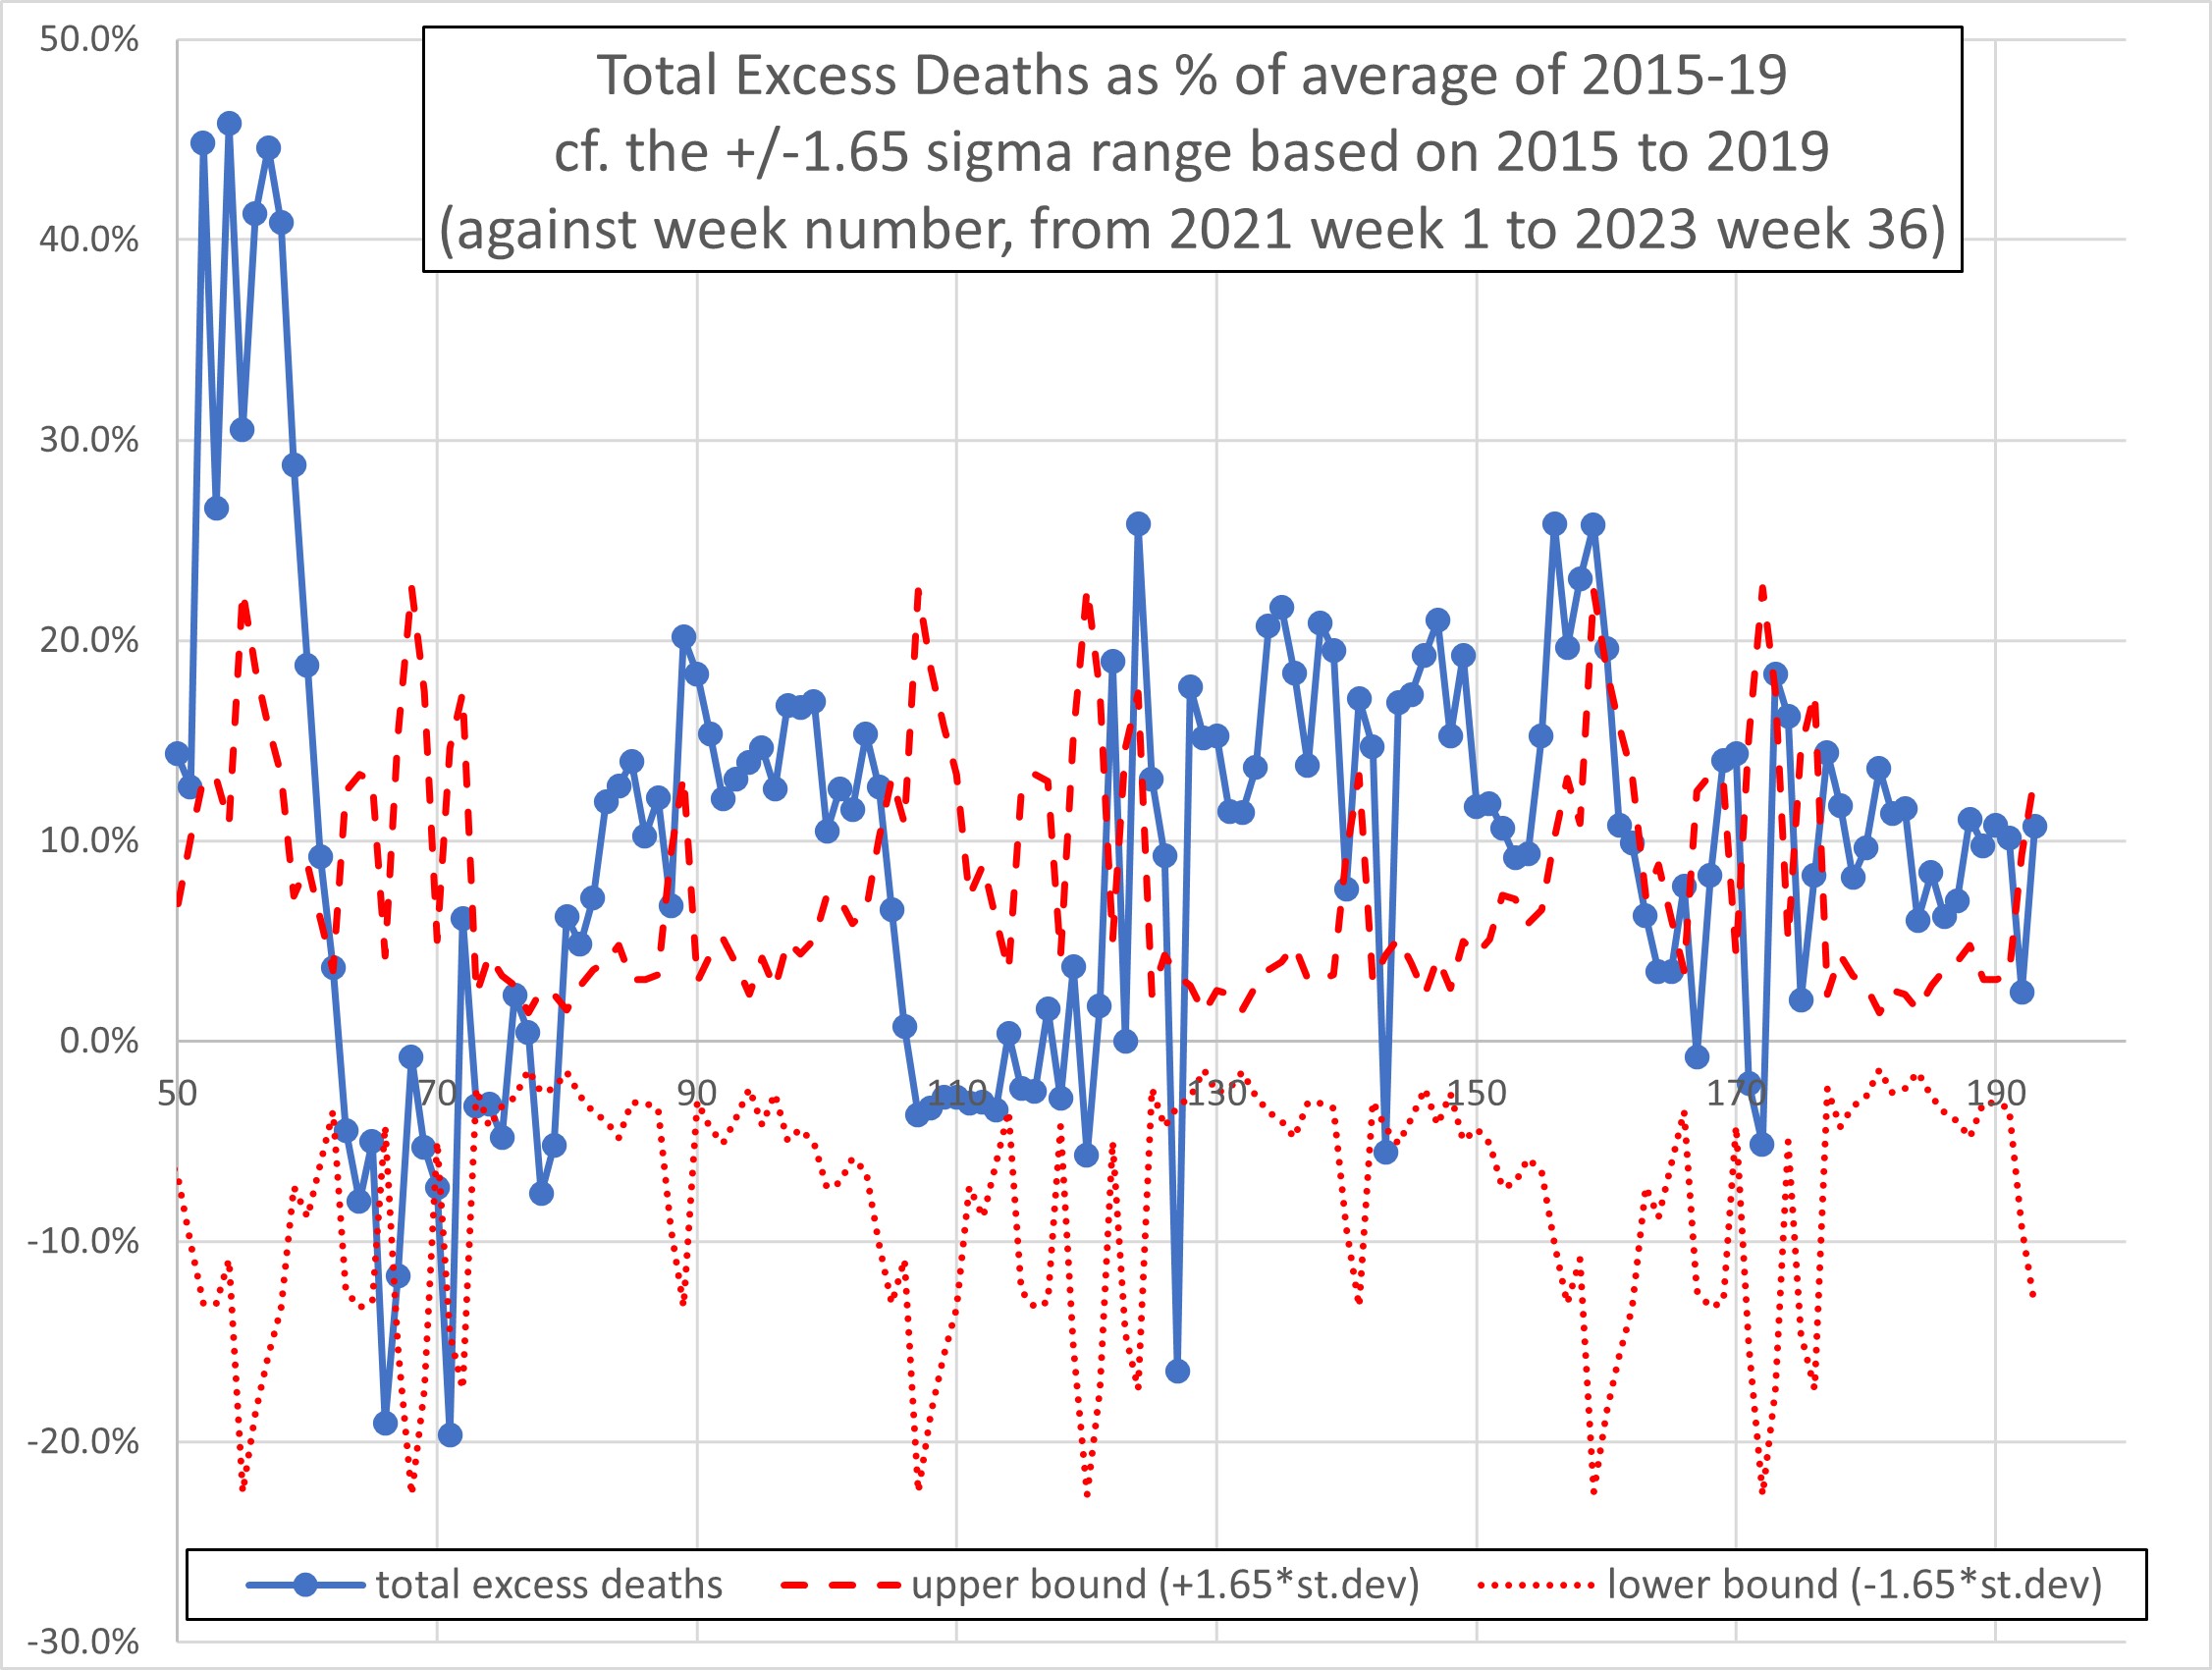
Figure 3
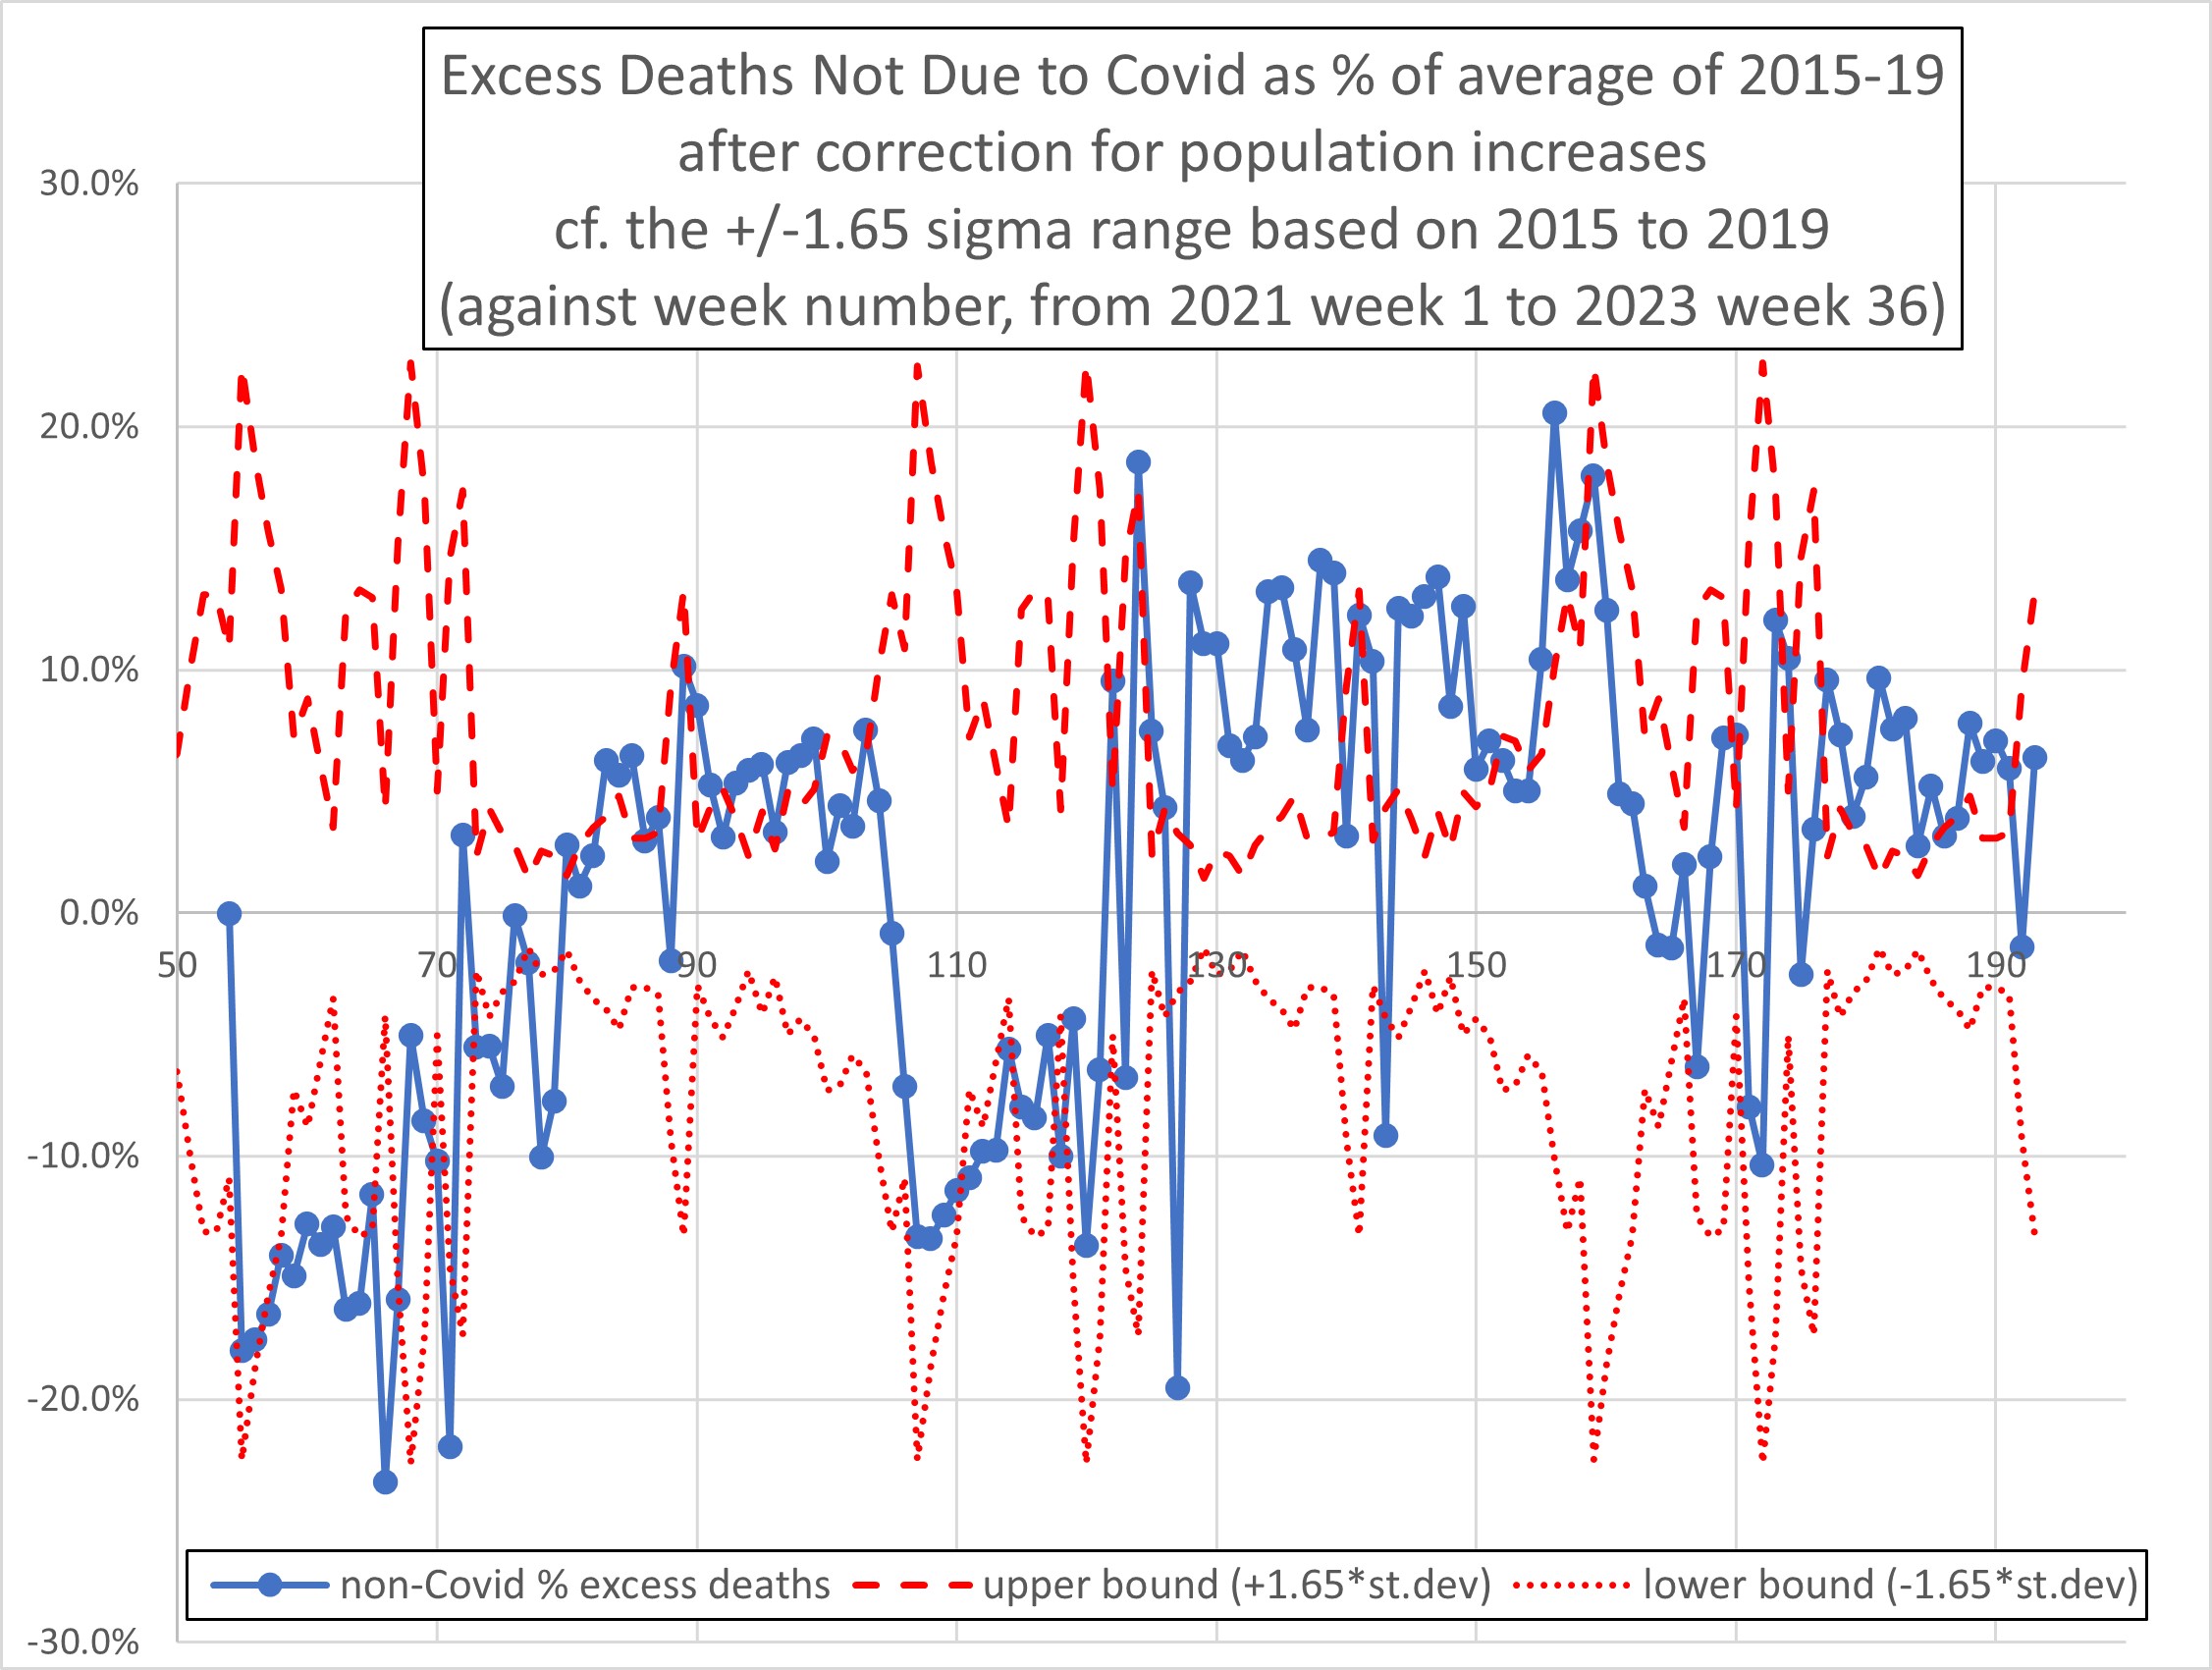
Figure 4