I do apologise. This is wildly off-topic. And I know you’ve all had enough of Covid-19. I did manage to resist the lure of Covid stats for seven months, though, so cut me some slack.
First some basics.
How many people in the UK have died of Covid-19?
No one knows. We only know how many people have died within a month of having a positive test for Covid.
How many people in the UK have been infected by Covid-19?
No one knows. We only know how many people have been tested positive at some time based on limited testing.
What is the mortality rate for Covid-19?
No one knows – for the above reasons. Mortality rate is the ratio of deaths caused by a disease to the number who have had the disease. We do not know either the numerator or the denominator.
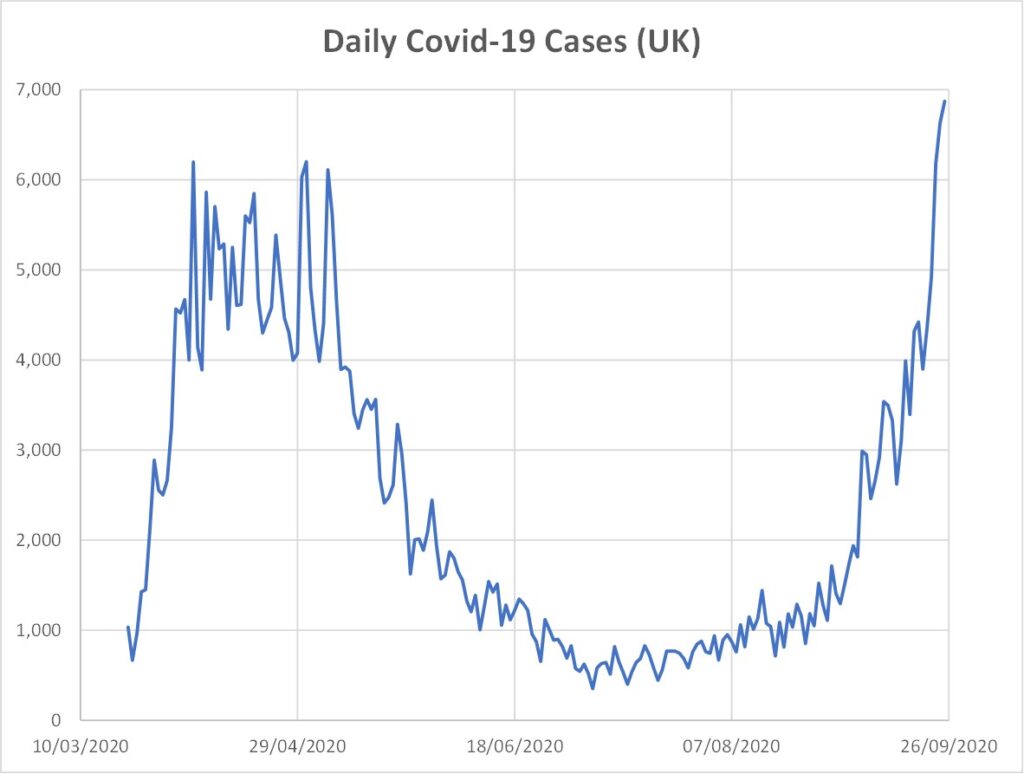
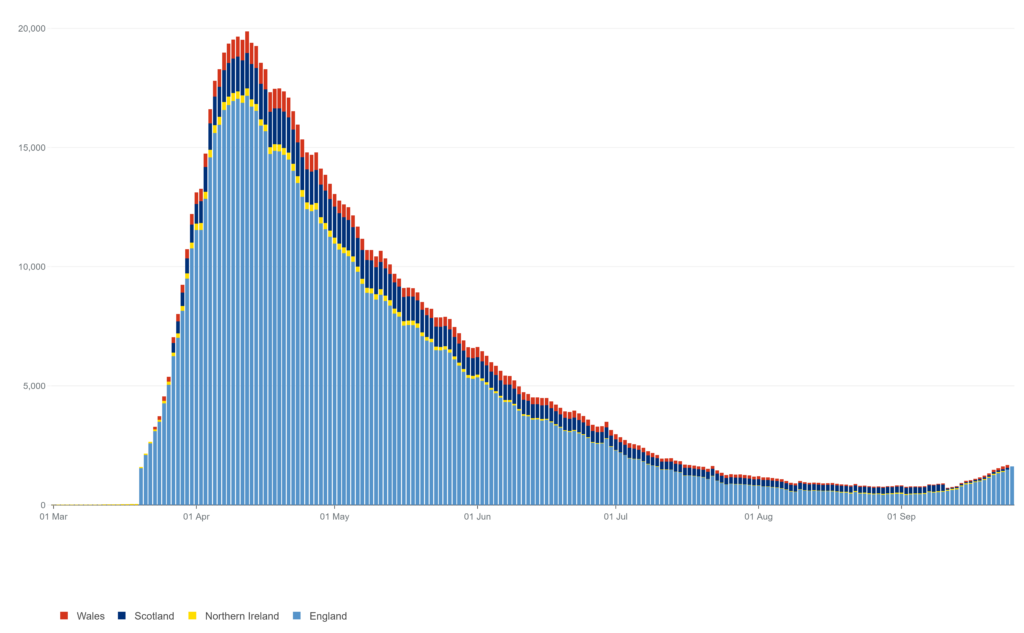
All four nations of the UK have recently announced renewed semi-lockdown measures. The reasoning – in as far as there is any – appears to be the graph that heads this post, together with the associated narrative that “the epidemic is doubling roughly every seven days” (chief scientific adviser Patrick Valance).
Well, that graph does look bad, doesn’t it? It plots the number of new “cases” (i.e., positive test results) per day against the date – from here.
But from here the number of tests being carried out per day over the same period is,
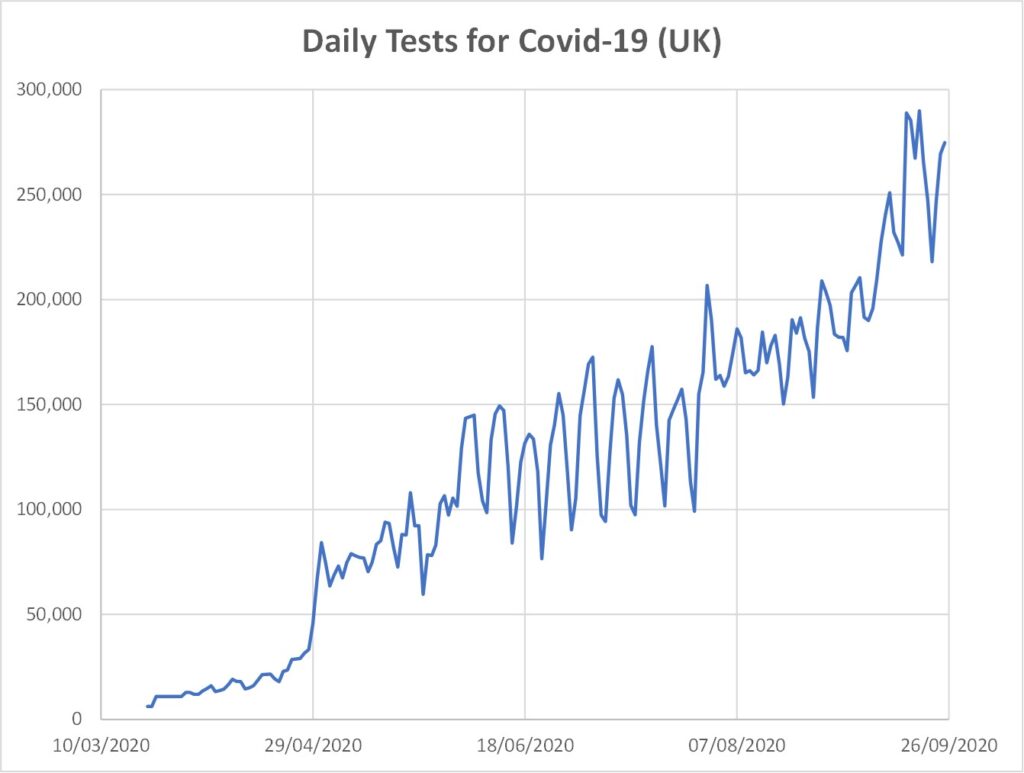
So, given Figure 2, does Figure 1 mean anything? No it doesn’t. I don’t know what sort of scientists the Government have advising them but I suspect Dominic Cummings’ team of wacky physicists have been kept away from it. Pity, because anyone numerate would immediately want to see the infection rate as a percentage of the daily number of tests. It’s this,
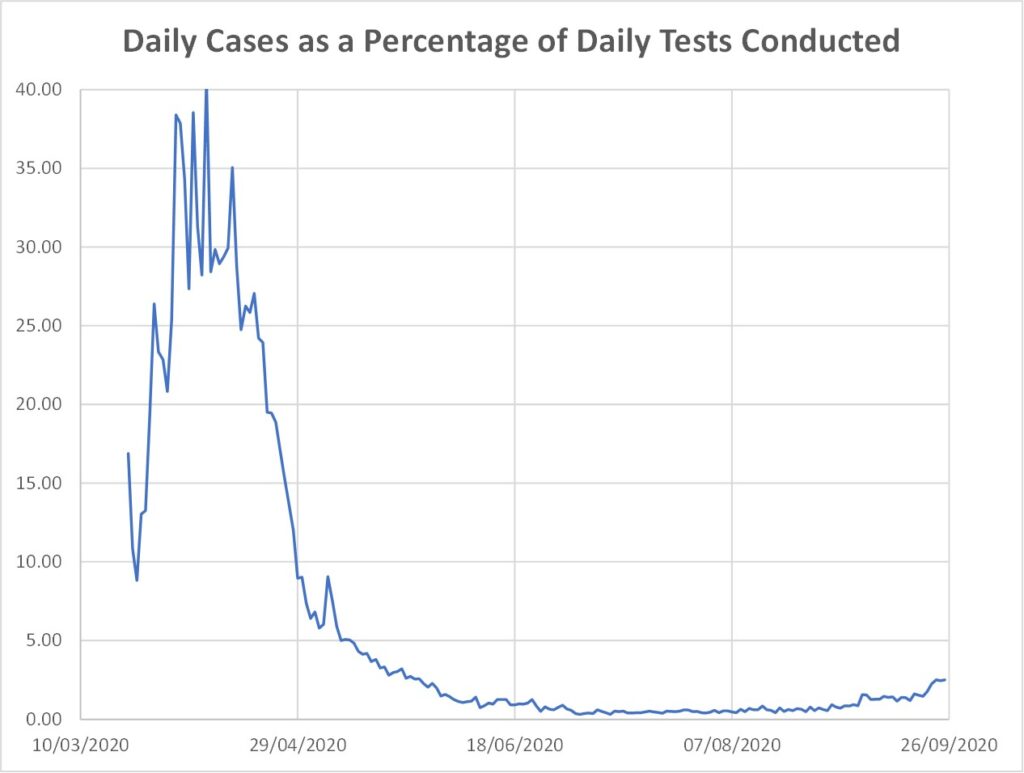
Ah, that’s not looking quite the same, is it?
Still, I suppose one could argue that it’s the total number of people getting ill and possibly dying that matters, not mere percentages, and that is surely related to Figure 1 not Figure 3 – eh?
Ok, let’s look at the daily deaths stats then (bearing in mind, of course, that this is the number of people dying with – not necessdarily of – Covid-19),
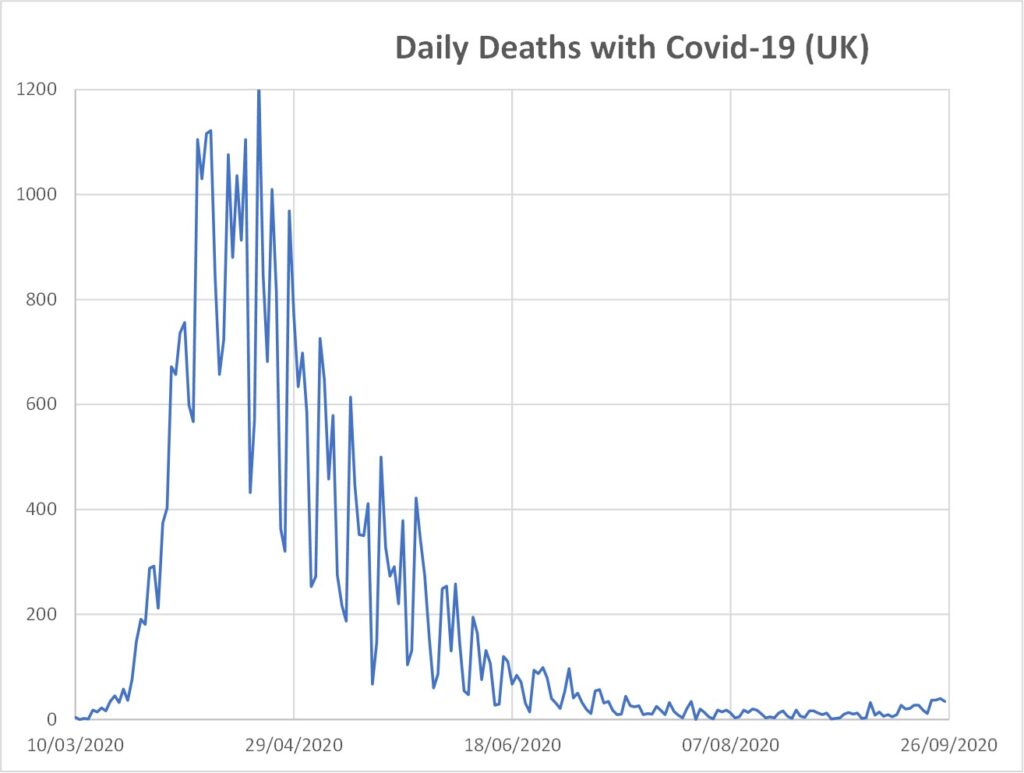
Ah…hmmm….that looks rather more like Figure 3 than Figure 1, doesn’t it?
But, wait a minute, deaths aren’t the only measure. What about measures of illness not necessarily resulting in death? OK, here are the stats on the number of people in hospital for Covid-19,
Ah, so that too looks far, far more like Figure 3 than Figure 1.
OK, so I’m oversimplifying this (though apparently it’s still too complicated for Government or their “scientific” advisors). There is an upturn during September in Figures 3, 4 and 5, albeit at present still tiny compared to the stats in April. But what does this portend?
Again I contend that no one actually knows. But the issue is whether the tiny upturn in Figures 3, 4 and 5 is a valid motivation for the measures being forced upon us. I’ll resist the temptation to delve further into issues of Parliamentary due process or whether there are more sinister motives behind this “protection racket”.
One final bit of information you may wish to be aware of is the extent to which deaths with Covid-19 are associated with also having a pre-existing medical condition. Public Health England stats give us this, for data to 9th September 2020,
| Age Range | Pre-Existing Condition | No Pre-Existing Condition |
| 0 – 19 yrs | 16 | 4 |
| 20 – 39 | 181 | 35 |
| 40 – 59 | 2,037 | 268 |
| 60 – 79 | 10,692 | 575 |
| 80+ | 15,319 | 512 |
| Total | 28,245 | 1,394 |
Some caution is required when interpreting that Table because not all forms of “pre-existing condition” would be likely to contribute to death. Nevertheless, it is salutary that the number of deaths of people of pre-retirement age without any pre-existing condition is so small, a few hundred. (The total number of deaths in the UK per year is roughly 600,000).
It does not help when the likes of Richard Dawkins throw around expressions like “right-wing idiots” of anyone who challenges the wisdom of Government policy. Not only do the above stats raise obvious questions, but Government policy now appears devoid of any rationale. In the early stages, “flaten the peak, protect the NHS” was a coherent argument (whether you agreed with it or not). But it is baffling what the Government is trying to achieve now.
The constant imposition of semi-lockdowns only ensures that infection rates are likely to increase as soon as such conditions are relaxed, because Government actions have prevented the development of herd immunity – the natural process by which epidemics are terminated.
I am not an epidemiologist and I claim no authority in such matters. But I remain mystified that a policy has been pursued which frustrates the development of the process which usually confers protection. Which brings me back to Figure 1 which heads this post. Is it a good thing or a bad thing? Permitting infections to proceed is the only way natural herd immunity can arise.
I have made no attempt to address the harmful effects of lockdown actions. But neither has the Government, it seems. I discussed this in my April post, The Morality of Lockdown.
Quite possibly I have missed something, speaking as I am outside my sphere of competence. But I think the accusation of naivety can more rightly be levelled against the Dawkins types than against those they label “idiots”.
Come to your own conclusion, you probably have already.