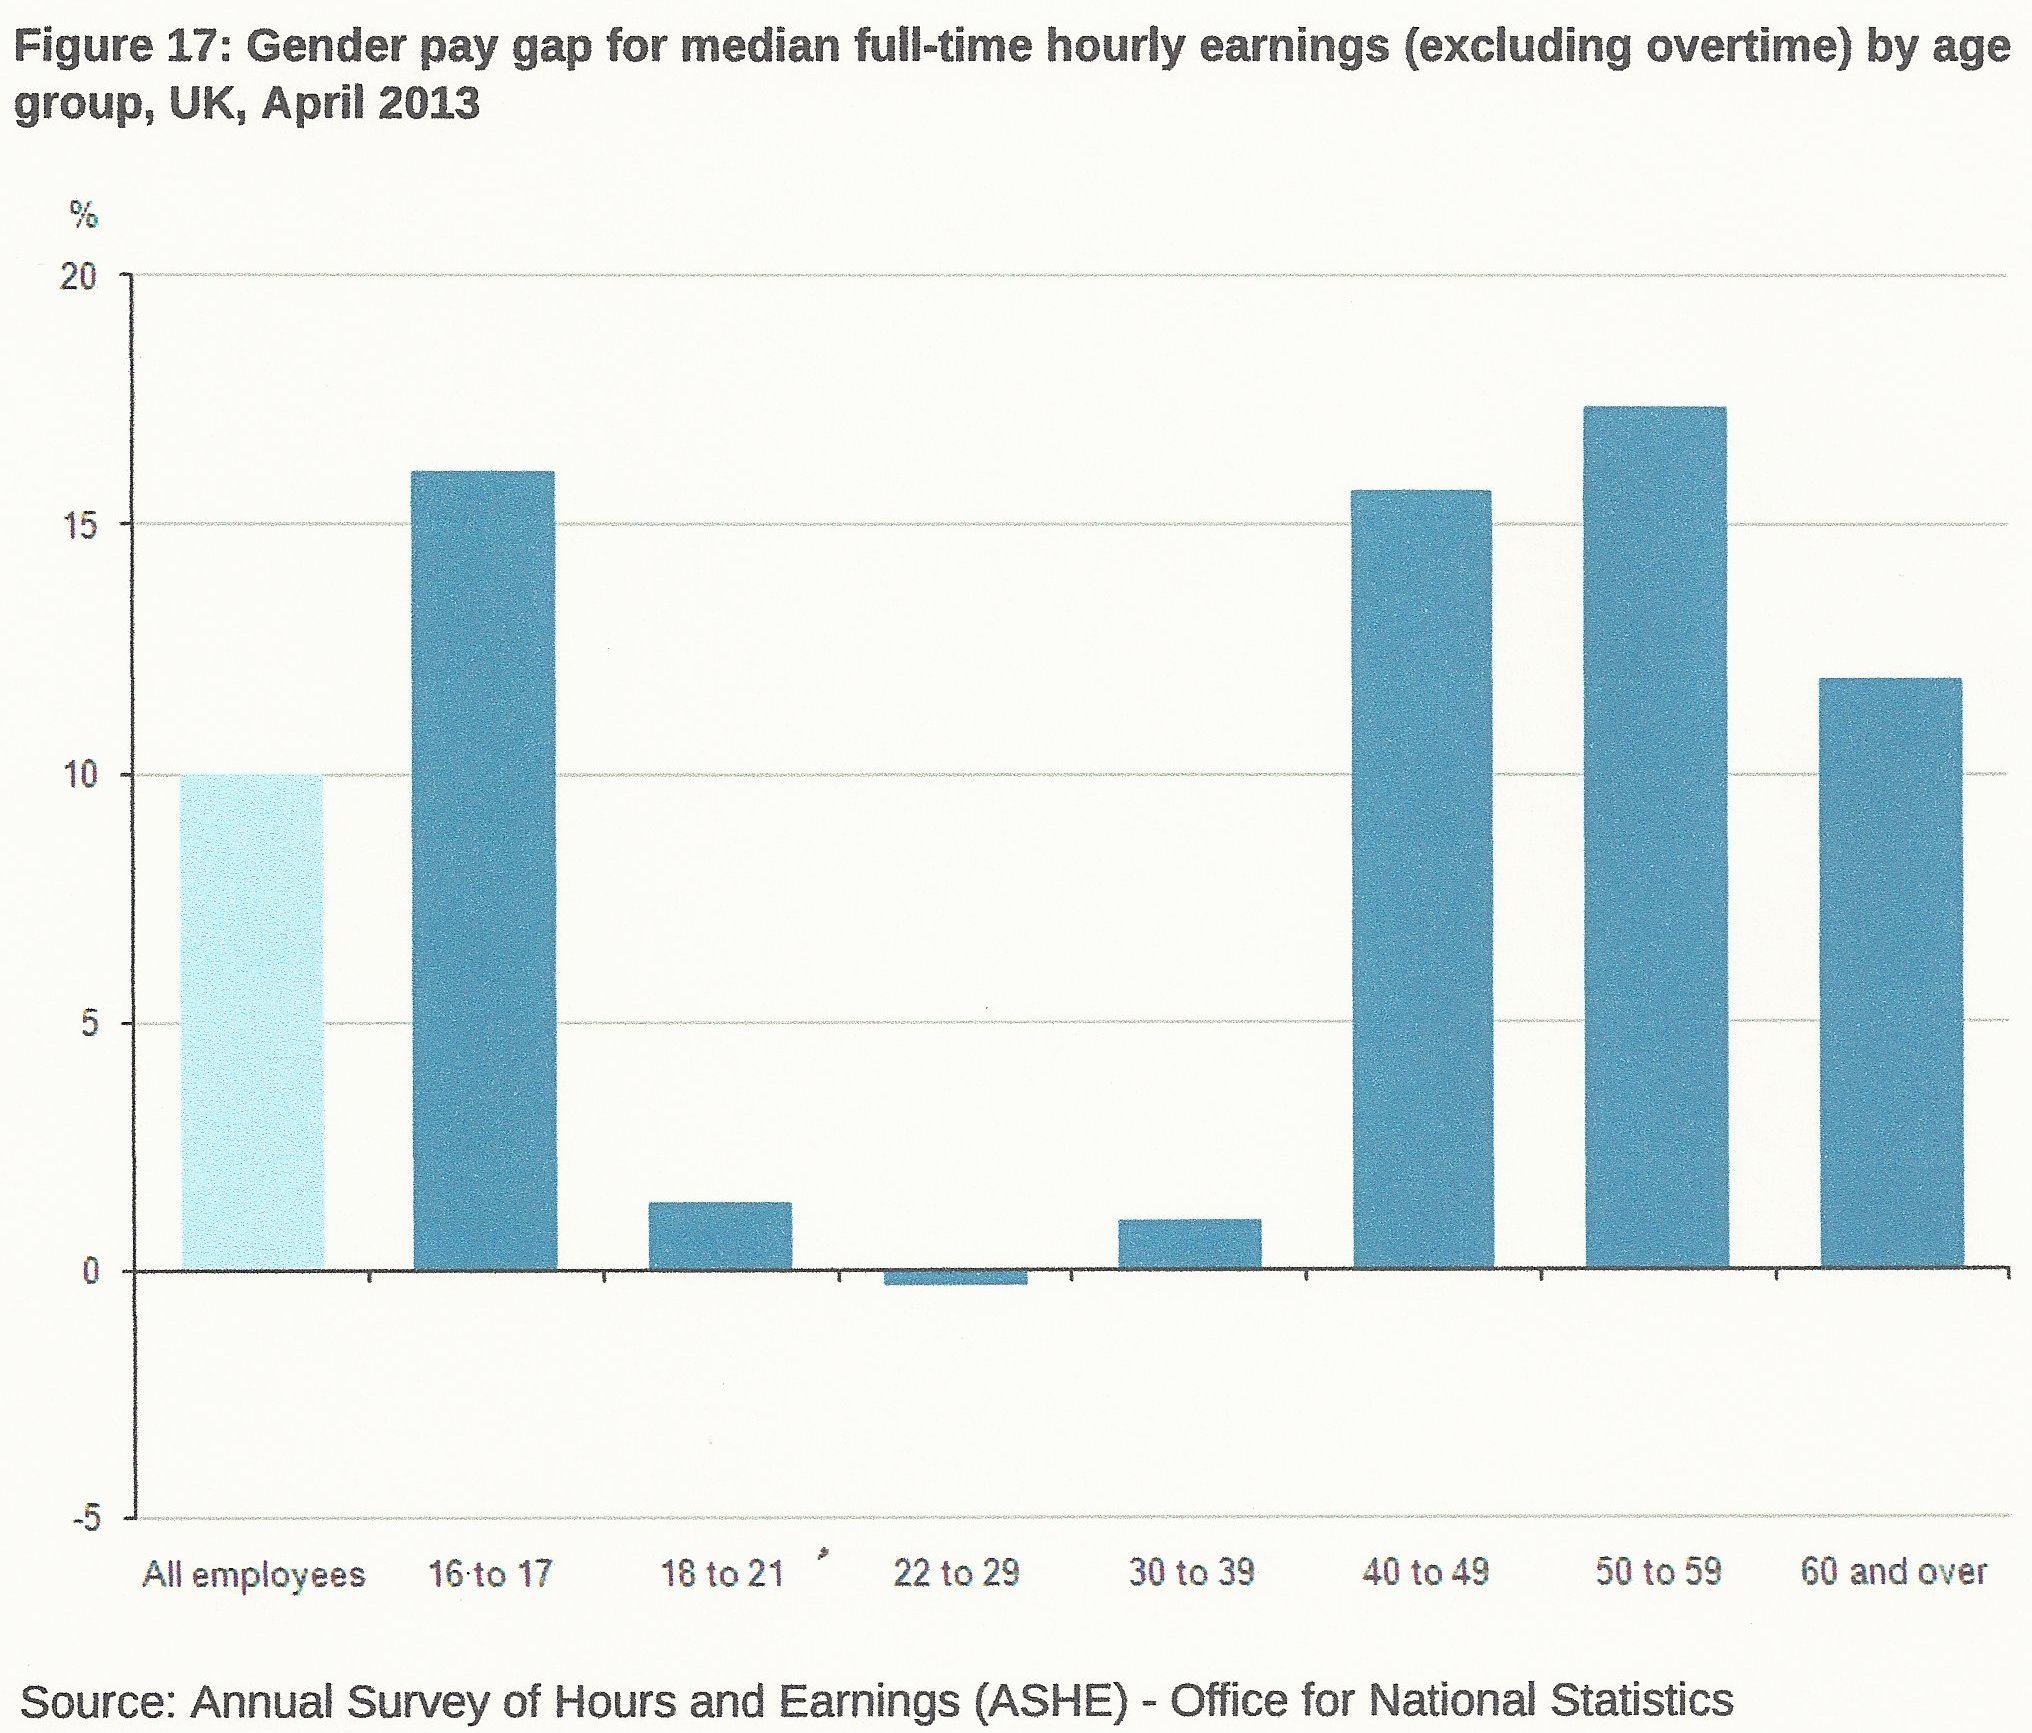
Don’t worry. I’m not about to reiterate the reasons why the gender pay gap is not gender discrimination yet again. This has been done over and over, for example here and here and here and here and here . I’d just like to draw your attention to the killer graphic in case you missed it – that’s it above, heading this post. It is reproduced from Figure 17 of Ref.[1]. It shows the gender pay gap (men’s full-time hourly earnings minus that of women) as a histogram against age. The salient point is this,
There is no pay gap between the ages of 18 and 40.
There is a pay gap gap.
The oft-claimed gender pay gap is obtained by averaging full-time hourly rates over all age ranges. Anyone claiming that this is evidence of gender discrimination must therefore answer this question,
Why does the evil patriarchy give a pass to women in the age range 18 to 40? Why does the discrimination only start for women over 40?
Of course we know the answer. It’s spelt out in detail in the above links: there is no pay discrimination. At least, not in favour of men.
In fact, women in their twenties working full time have earned more than men on average for some years now, see for example this or this, as is also the case in the USA and elsewhere. And this pay gap in favour of younger women is likely to increase as the greater number of women graduates makes inroads into the workplace.
For part-time workers, the pay-gap is also in favour of women, whose median hourly earning rate exceeds that of men by 5.7% (Ref.[1]). There has been a part-time pay gap in favour of women since 1997, and it is increasing.
Are there other indicators of women’s financial ascendancy over men? There are. Ref.[8] assessed social mobility changes between 1991 and 2005, thus,
In terms of absolute mobility, we find somewhat unfavourable trends in upward mobility for men……An increase in downward mobility is clearly evident. In relation to women, we find favourable trends in upward mobility and unchanging downward mobility over the fourteen-year time period.
But that is not the issue I want to address in this post. I want to address another area in which the relative wealth of men and women is subject to distorted reporting amounting to propaganda – specifically the relative wealth of men and women after divorce or partnership dissolution. This has been discussed recently in Ref.[2] by Brewer and Nandi. The headline conclusion of Ref.[2] is that,
Children and their mothers see living standards fall by more, on average, after separation, than do fathers
Given the common experience of divorced men of being financially wiped-out by the process, this conclusion will surprise many. Of course, that does not mean it is untrue – but it does provide motivation for a close examination of Ref.[2]. I have carried out this close examination and a detailed critique of this paper will appear on http://RedPillUK.co.uk shortly. I have identified 7 areas of concern. In this brief blog post I will mention just two of them.
Bear in mind that when analyses such as Ref.[2] are published, newspapers and the media tend to take for granted that the work is sound. Headline conclusions, such as that quoted above, are regarded as having scientific credibility. Few people will look beyond a newspaper article by downloading the original paper. And those few who do will generally read just the abstract and the conclusions, and glance at the graphical results. How many people engage with the detailed methodology? Extremely few, and those who do will generally be workers in the same field – perhaps with similar sympathies. So how reliable is the above conclusion?
Ref.[2] considers several pieces of evidence regarding well-being, some of which are based on questionnaires. However, it is the quantitative work on income which I have critiqued. The income measure used in Ref.[2] was the total income for all household members net of estimated income tax, pension and NI contributions and local tax payments. The total income included all earnings and all benefits, including housing benefits, plus investment and savings income and transfer income including educational grants, child maintenance and alimony payments.
My first criticism of the methodology of Ref.[2] is this extraordinary feature of the analysis,
Alimony and child maintenance payments were not subtracted from the man’s income prior to comparison with the woman’s income.
This omission is so mind-blowing that it is difficult to believe. To illustrate just how bonkers this is, consider the extreme case of a man who hands over his entire income to his ex-wife, and assume the wife is the custodian of their child. In this case the methodology of Ref.[2] would indicate that this man was better off financially than his ex-wife – despite the fact he has absolutely no money at all and she has it all. The credibility of Ref.[2] must already be in doubt.
Brewer and Nandi attempt to minimise the importance of this omission as follows,
Jarvis and Jenkins (1999) show that their results (which are common to this study) on how income changes around a split change hardly at all when they account for payments of alimony and child support. This mostly reflects that many separations are accompanied by neither alimony nor child support payments.
This is a truly extraordinary claim. It is asserting that child support and/or alimony payments have negligible impact on separated men’s wealth. I doubt that many men in this position would agree. I have examined the basis of this claim in Jarvis and Jenkins (1999), Ref.[3]. This sensitivity study involves data from just 71 men, and dates from years 1992 to 1994. So the data is over 20 years old, and is a tiny dataset. Yet Ref.[2] and other similar analyses since 1999 have continued to rely on this fragile justification for the crucial, and extraordinary, assumption that maintenance costs are of little significance.
Quite apart from the tiny size of the dataset used to support this key assumption, what has changed in the last twenty years? Well, the CSA has come…..and gone. And the payment of child support has increased markedly. Table 9 of Ref.[3] indicates that only 24% of women were receiving maintenance payments in 1991-94. In contrast, Ref.[4] records that 80% of Child Maintenance Service (CMS) cases with a current liability were receiving payments in 2012. In addition, a further ~150,000 women were receiving privately agreed payments independent of the CMS.
I conclude that the failure to subtract alimony / child maintenance payments from men’s income is not justified by Ref.[3]. This omission puts a significant dent in the claimed conclusion of Ref.[2], i.e., that men are better off than women after partnership dissolution.
However, the second factor which I have identified is probably of even greater numerical significance. This relates to how the costs of raising a child (or caring for other dependants) is quantified. Prior to comparing men’s and women’s net incomes after separation, the woman’s income is adjusted to an “equivalised” income (assuming it is the woman who has custody). This accounts for the cost of dependants according to an OECD formula, Ref.[5], thus: each extra adult or child aged 14 or over is taken to require 50% of the funds that the woman herself requires, and each child under 14 requires 30%. For example, if the woman is left in charge of two children aged 12 and 14, she is deemed to require an income of 1.8 times what she would need for just herself. Her “equivalised” income is defined as her actual net income divided by 1.8. Thus, assuming her ex-husband now lives alone, she would need a net income 1.8 times his net income in order to be deemed equally well off (or equally badly off). So, if she actually had a net income 1.7 times his, the ex-husband would be deemed better off.
Of course, some allowance for the extra costs associated with children is only reasonable – that is, after all, what child maintenance is for. However, the entire analysis of Ref.[2] as regards who ends up better off hinges upon the 50% and 30% figures of the OECD, Ref.[5], model. But what is the basis of these figures? This is obscure. What is clear, though, is that the Child Maintenance Service does not agree with them. If it did, then the CMS would presumably use these figures as the basis for the required child maintenance payments. It does not.
The CMS recommends child maintenance at rates of 12%, 16% and 19% of gross income for one, two and three children respectively. Until recently the rates were expressed as a percentage of net income, namely 15%, 20% and 24% of net income for one, two and three children respectively. Even assuming all the children in question are under 14 years old, these rates contrast markedly with the OECD rates used in Ref.[2] to define equivalised income, i.e., 30%, 60% and 90%, which are respectively double, triple and 3.75 times the CMS maintenance rates. And if any of the children were 14 or older, the disparity would be even greater.
So we should no longer be surprised by the conclusion of Ref.[2]. The methodology used results in men’s income being greater than women’s equivalised incomes because the latter are factored down by a factor which grossly exceeds the CMS recommended child care costs. The conclusion of Ref.[2] is not really a conclusion at all. It is actually just a heavily disguised bias – namely that the authors (or, at least, the OECD) regard children as being far more costly than does the Child Maintenance Service.
Whether the authors of Ref.[2] are fully cognisant of this, and indeed whether they had the freedom to demure from the methodology employed, I do not know. However, if it were done freely and knowingly, then I would be inclined to regard Ref.[2] as propaganda rather than analysis. The intention, of course, is to increase child maintenance payments. The mechanism by which this is spuriously justified is to incorporate in disguised form the assumption that child care requires greater funding, and then to use this to justify itself.
The use of exaggerated factors to estimate the cost of child rearing, and hence to motivate inflated maintenance payments, is not confined to the UK. Barbara Kay, Ref.[7], has recently given an account of the situation in Canada. Here maintenance is based on 40% for dependent adults and 30% for children, the basis of which is as obscure as that of the OECD factors. To quote Ref.[7],
The formula for calculating child-support payments that was finally arrived at was 40/30 — meaning that a second adult represents 40% cost to a household, and a child 30%. These unrealistically high numbers were lifted from Statistics Canada data in the sole context of low-income measures. There was no targeted research study or science behind a universal 40/30 formula (nor did Statistics Canada ever suggest there was). Yet these numbers became the basis for billions of dollars in court-ordered payments every year.
Note that the OECD factors, 50/30, are even higher than those which Kay describes as “unrealistically high”. A recent review of the Canadian position, Ref.[6], notes that in 1993 the justice department used the numbers 25% and 13%, respectively, for the household cost associated with a second adult and a child, but later moved their numbers up. Political interference, anyone?
There are, of course, other issues. For example, there is no assurance that money provided for child support is actually spent on the children. Moreover, it is notable in these debates that the children are treated solely as a cost and not as a benefit. That is not, I suspect, how Fathers4Justice would see the situation.
Finally, though not strictly on-topic, there is a chilling quote in Ref.[6] regarding a 1991 Canadian symposium organized by then-Justice minister Kim Campbell. One recommendation reads, “Even when men are not violent, it should not be assumed that continued contact with the father is positive. The primary custodial parent should decide.” Allow me to translate: it reads, “women should be allowed to alienate their children’s father without reason“. And the following non-binding policy resolution was passed, “The justice department would henceforth represent only feminist legal arguments in any future constitutional cases and would consult with feminists on any future appointments to the judiciary.” Whilst we are not surprised that this is the de facto position, to see it declared openly in writing as a policy is quite amazing.
References
- David Bovill, “Patterns of Pay: Estimates from the Annual Survey of Hours and Earnings, UK, 1997 to 2013”, Office for National Statistics, February 2014.
- Mike Brewer and Alita Nandi, “Partnership dissolution: how does it affect income, employment and well-being?” Institute for Social and Economic Research, University of Essex, No. 2014-30, September 2014.
- Jarvis, S., & Jenkins, S. P. (1999). Marital Splits and Income Changes: Evidence from the British Household Panel Survey. Population Studies, 53(2), pp. 237–254. Retrieved from http://www.jstor.org/stable/2584679.
- Child Maintenance and Enforcement Commission, Annual Report and Accounts 2011/12.
- Office for National Statistics, “Family Spending – Chapter 3: Equivalised Income”, http://www.ons.gov.uk/ons/rel/family-spending/family-spending/2013-edition/rpt-chapter-3–equivalised-income.html
- Christopher Sarlo, “An Assessment of Federal Child Support Guidelines”, the Frazer Institute of Canada, August 2014.
- http://fullcomment.nationalpost.com/2014/09/10/barbara-kay-giving-daddy-a-raw-deal-on-child-support-payments/
- Yaojun Li and Fiona Devine, “Is Social Mobility Really Declining? Intergenerational Class Mobility in Britain in the 1990s and 2000s”, University of Manchester, Sociological Research Online, 16 (3) 4 (31/8/11). http://www.socresonline.org.uk/16/3/4.html