
The Government’s Independent Report of the Commission on Race and Ethnic Disparities, published 31 March 2021, has caused a bit of a stir. Have no fear, I’m not about to stray off-topic yet again into the race issue (much). But it is refreshing to see ethnicity factors across various issues addressed with empirical honesty rather than ideological skew. If you didn’t catch Andrew Neil’s interview of Mercy Muroki, one of the team that produced the report, then it’s worth viewing. A Government report which identifies family structure and culture as more important determinants of outcomes than race bears more than passing notice. It challenges head-on those who have controlled the race narrative until now. Muroki even refers to single parent families as culprits in underperforming offspring – the usual belligerents will be out to get her now, rest assured.
However, back to sex. Here I confine myself to the topic of education and what we can glean from the Government’s report on the interplay of ethnicity and sex as regards educational attainment.
It is hardly the first time either official sources or this blog have pointed out that it is the intersection (ha!) of sex and race in which the educational nadir is found – and the intersection in question is not black/female but white/male, rather inconveniently for the approved Correct narrative. For example, see this article – or many of the UCAS end of cycle reports before Mary Curnock-Cook left UCAS.
Let’s turn firstly to the Independent Report on Education and Training which forms one part of the Government’s review. References to ‘Tables’, below, relate to that.
Key Stage 4 (Age 16, Year 11, mostly GCSEs)
The data here actually derive from the University of Oxford’s Professor Steven Strand’s 2020 report for this review, ‘Effects of Ethnicity and Socio-economic status on attainment’. He used data from exams in 2015 (I don’t know why more recent data was not used, though obviously 2020 would have to be avoided).
Table 2 addresses Key stage 4 results by ethnicity, sex and parental socio-economic classification. It uses so-called “Level 2” attainment. In terms of GCSE equivalents, this means grades A* to C in old notation, or grades 4 to 9 in the newer numerical system. This is supposed to be broadly equivalent to an O Level pass. From the data in that Table I have plotted the histogram of Figure 1, which shows the percentage of each ethnic group reaching this level of attainment. For comparison, the averages for all girls and for all boys, i.e., all ethnicities combined, are also shown.
The sex-based disparity (roughly 10%) is broadly similar to the spread between the ethnic mean and the ethnic extremities. In other words, very roughly speaking, ethnicity and sex disparities are of similar magnitude – if one compares on the basis of the means of these groups. It gets more interesting when ethnicity and sex are disaggregated together.
But Figure 1 alone is sufficient to discredit agonising over race whilst ignoring the sex disparity.

[On the purely ethnicity issue, Figure 1 illustrates why BAME is a misleading categorisation. Even “Black” is misleading, as the Black African group consistently tends to do better than the White group, whilst the Black Caribbean group is consistently bottom of the heap – if one ignores Irish Travellers, Gypsies and Roma, that is].
Figure 2, also derived from Table 2 data, illustrates the dependency on parental income. (I could have plotted against parental educational attainment instead; it would have looked much the same. Both, I guess, are approximate surrogates for “class”). The disparity between the top and bottom quintiles of parental income (i.e., the spread in Figure 2) is somewhat larger than the spread due to ethnicity. So, family socioeconomic background is at least as important, probably rather more important, than ethnicity or sex as regards attainment at GCSE aged 16. The difference between the sexes (over all ethnicities) is equivalent to about one-and-a-half quintiles of parental income. We will see later that ethnicity becomes more important than parental background at aged 18 and the entry into university.

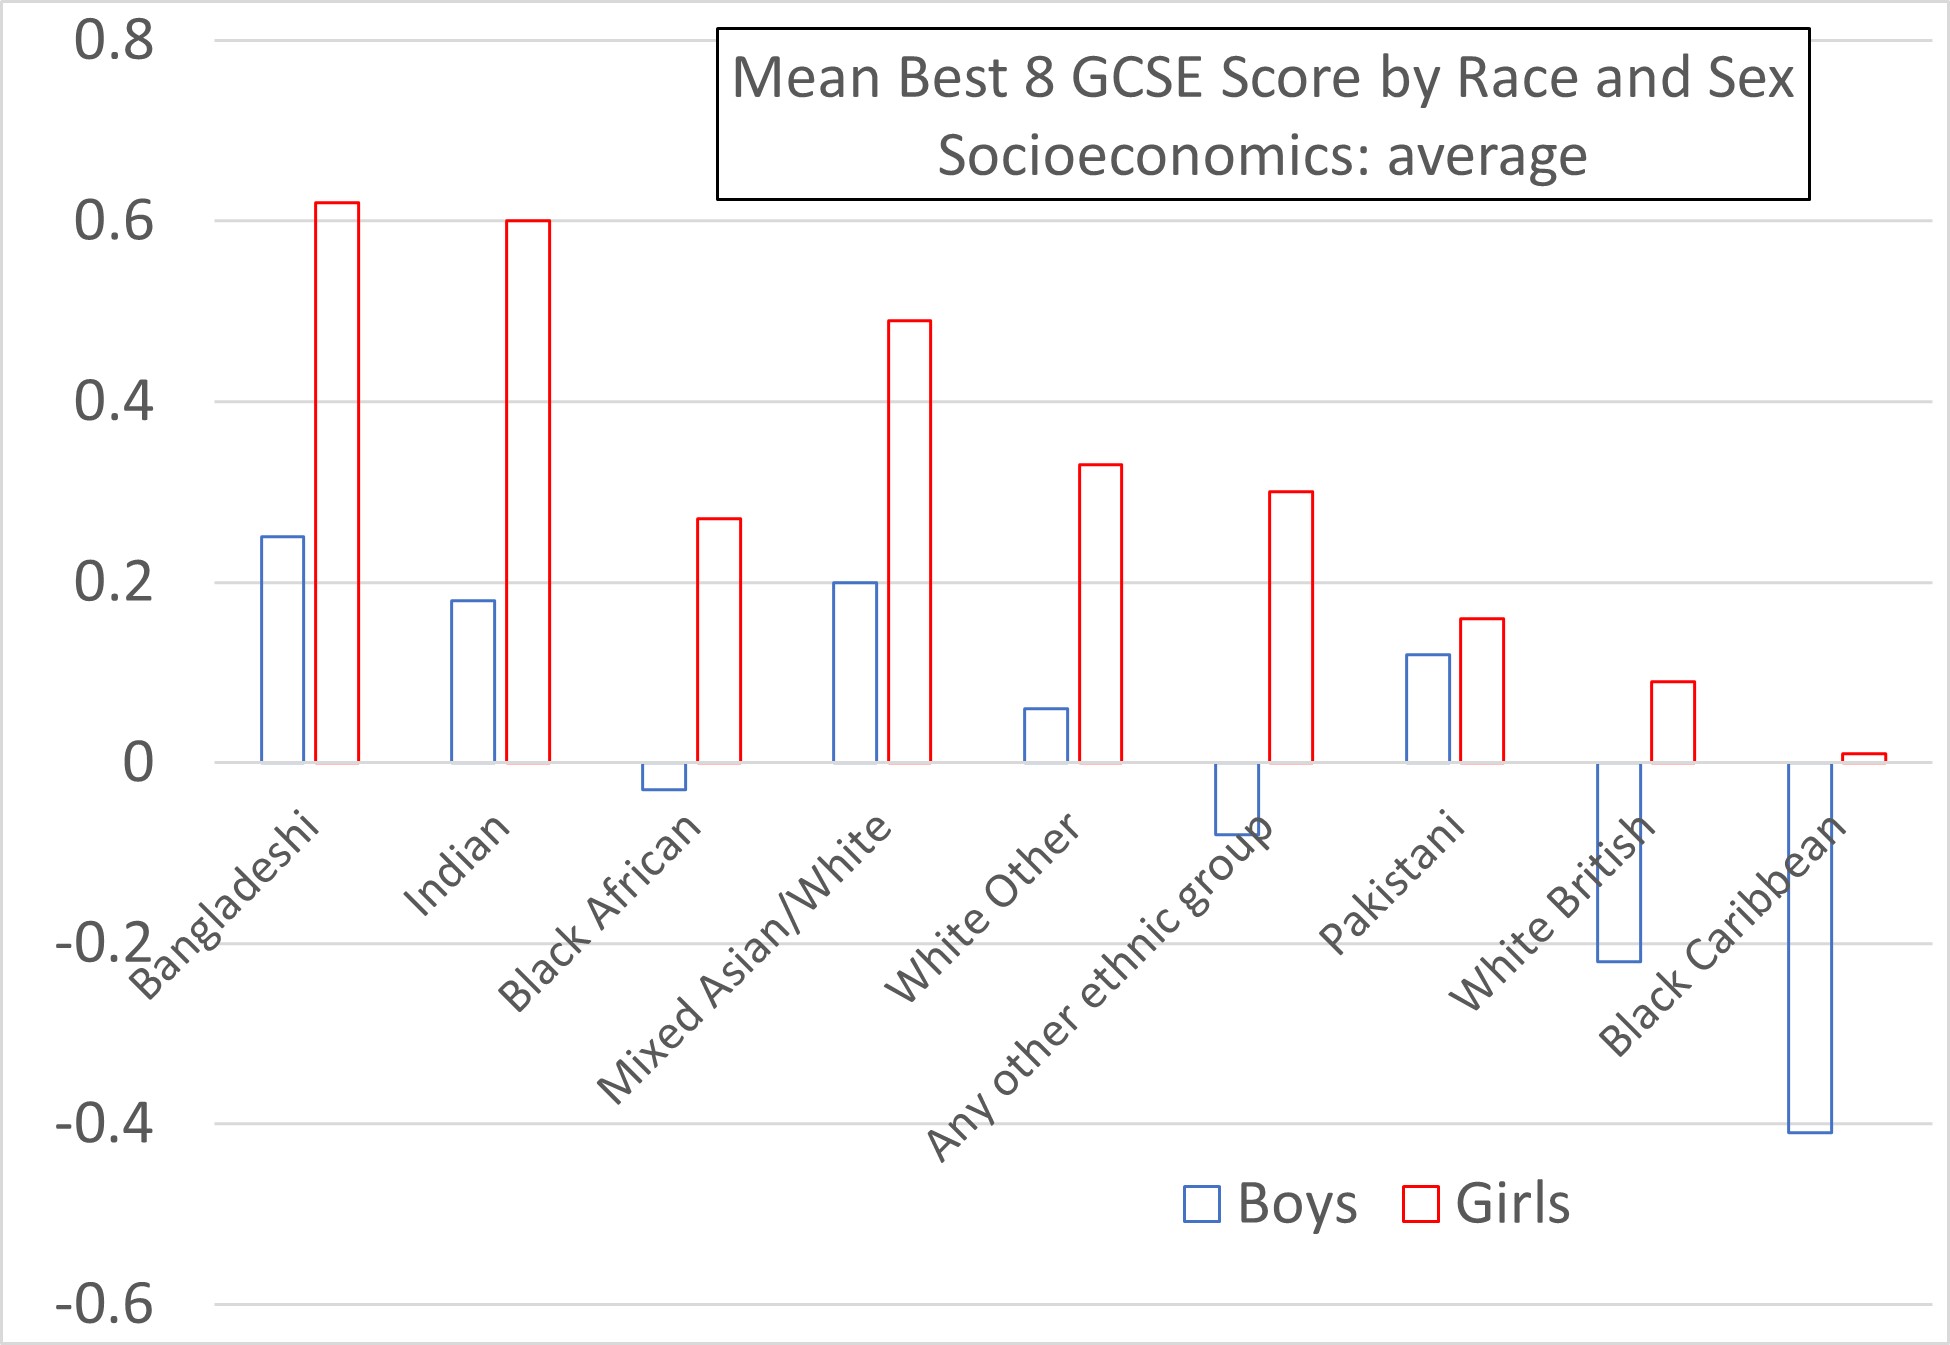
Data disaggregated by both ethnicity and sex was provided in Table 3 which uses the “mean Best 8 score”. The Best 8 score is a measure of attainment which uses the total score across the best 8 examination results achieved by the pupil. Each GCSE scores equal to its grade (i.e., a grade 9 counts 9, grade 8 counts 8, etc.). The “mean Best 8” is the average of the Best 8 scores across the ethnic and sex group in question.
However, the data in Table 3 is normalised using the standard deviation of the whole dataset (all ethnicities, both sexes). Hence the units in Table 3, and my Figure 3 below, are “numbers of standard deviations above the mean”. Negative values, therefore, are achievement levels below the mean.
Figure 3 provides this “mean Best 8” attainment measure for a sub-population of each ethnic group of average socioeconomic status, disaggregated by sex. The sex disparities are now stark. For all ethnicities the average girl lies above the whole-population mean. In contrast, the groups which lie substantially below the mean are White British boys and Black Caribbean boys. The latter are the bottom of the heap (Gypsy, Roma and Irish Traveller groups would be lower still but excluded due to very low statistics). Note again that Black African boys do far better (close to mean, and Black African girls are well above the mean).
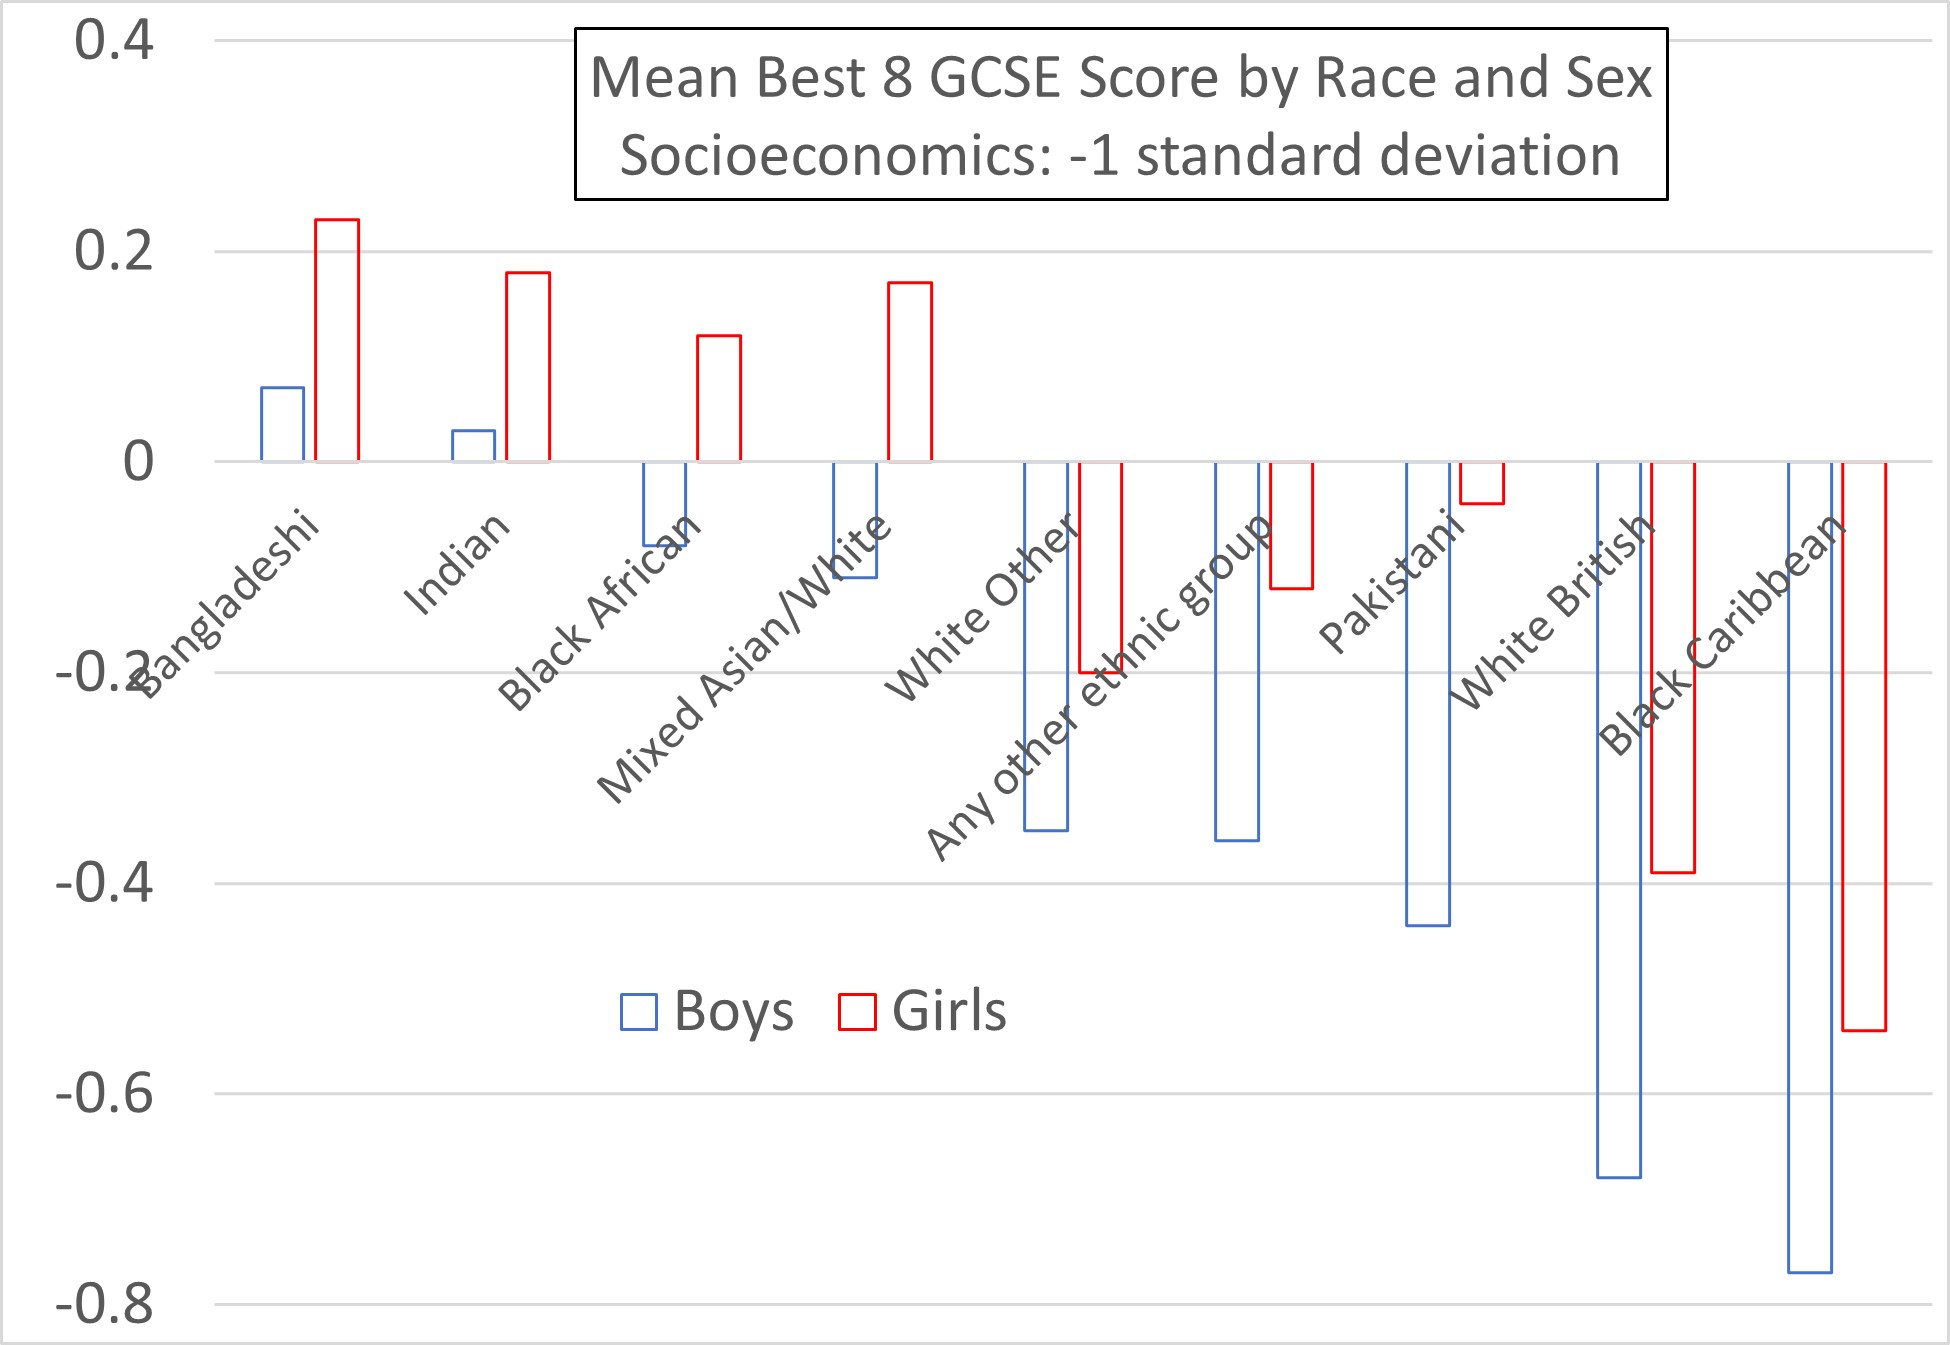
Figure 4 is a similar plot for the sub-populations defined at one standard deviation below the mean socioeconomic status. Very few boys from this economically disadvantaged background make it above the mean attainment. In contrast, the average girl of the Bangladeshi, Indian, mixed Asian/White or Black African groups still attains well above the mean, even with this economic disadvantage. In contrast, the average boy of Pakistani, White British, “other” White, or Black Caribbean groups does woefully badly – and it is the White British and Black Caribbean groups which are emphatically the worst underachievers.
Exclusion from School
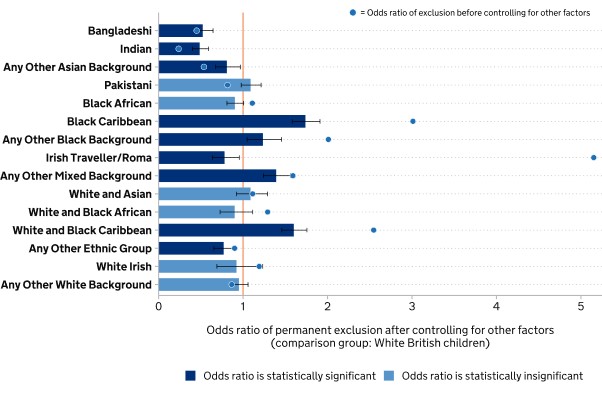
The Government report includes data on permanent exclusions from school, which is usually due to persistent disruptive behaviour. In the 2018 to 2019 school year there were 438,300 temporary exclusions, and 7,900 permanent exclusions. It is the permanent exclusions which are of interest here. Figure 5, below, is copied from the report and gives the odds ratio of permanent exclusion by ethnic group compared to White British group (England, analysis from September 2009 to July 2017, across 3 cohorts). Unsurprisingly the poorer the educational attainment of a group, the greater is the prevalence of exclusions within that group (or vice-versa, if you prefer). This presentation is useful in refuting any claim that exclusions are racist against non-Whites, perhaps due to the high level of Black Caribbean exclusions, because most non-White groups are excluded less often per capita than Whites.
However, the report does not disaggregate exclusions by sex. Since the subject matter is race/ethnicity, I guess they can be excused. But, in the context of exclusions, this does rather smack of willfully ignoring the elephant in the room. We all know that boys are excluded far more frequently than girls. Government data tells us, “Boys have more than three times the number of permanent exclusions, with 6,000 permanent exclusions, at a rate of 0.14 compared to 1,900 for girls in 2018/19 (0.05)”.
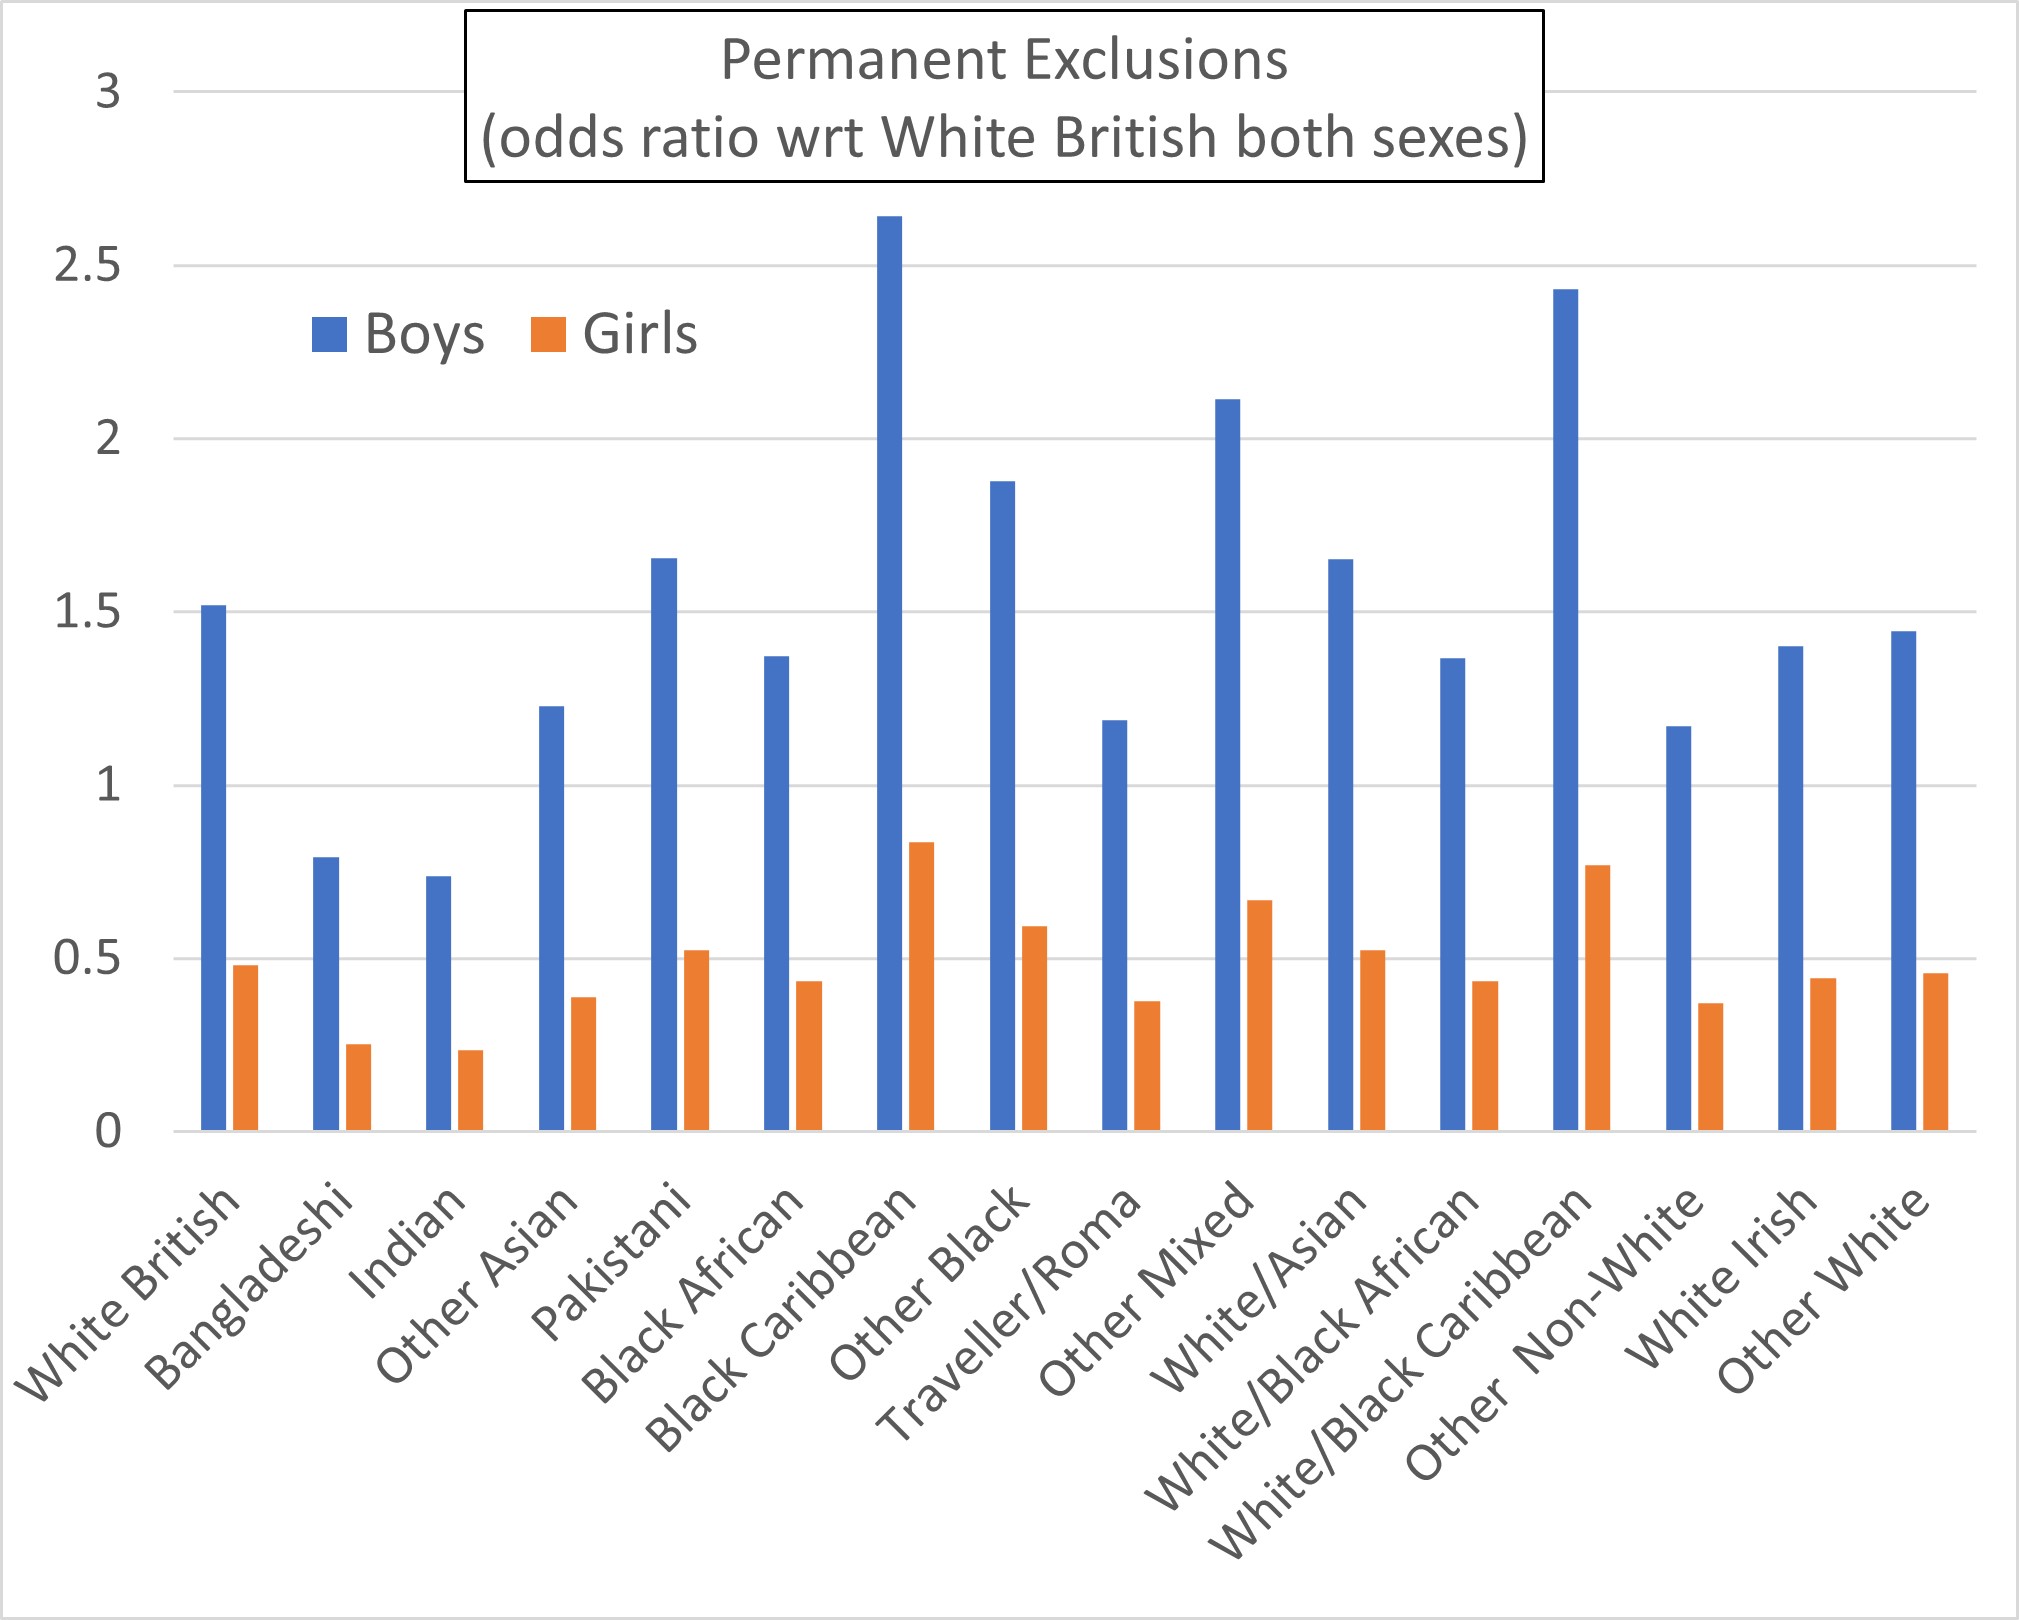
Assuming that sex ratio to hold for all ethnic groups, the data underlying Figure 5 can be used to produce Figure 6, which gives the odds ratio of permanent exclusion, defined in the same way, but for the two sexes separately for each ethnic group.
The issue of sex swamps that of ethnicity. The data may have refuted the idea that exclusions are racist, but they have not refuted any claim that they might be sexist. (Nor, I should add, does Figure 6 prove that exclusions are sexist – only that the possibility arises and has not been examined).
Higher Education
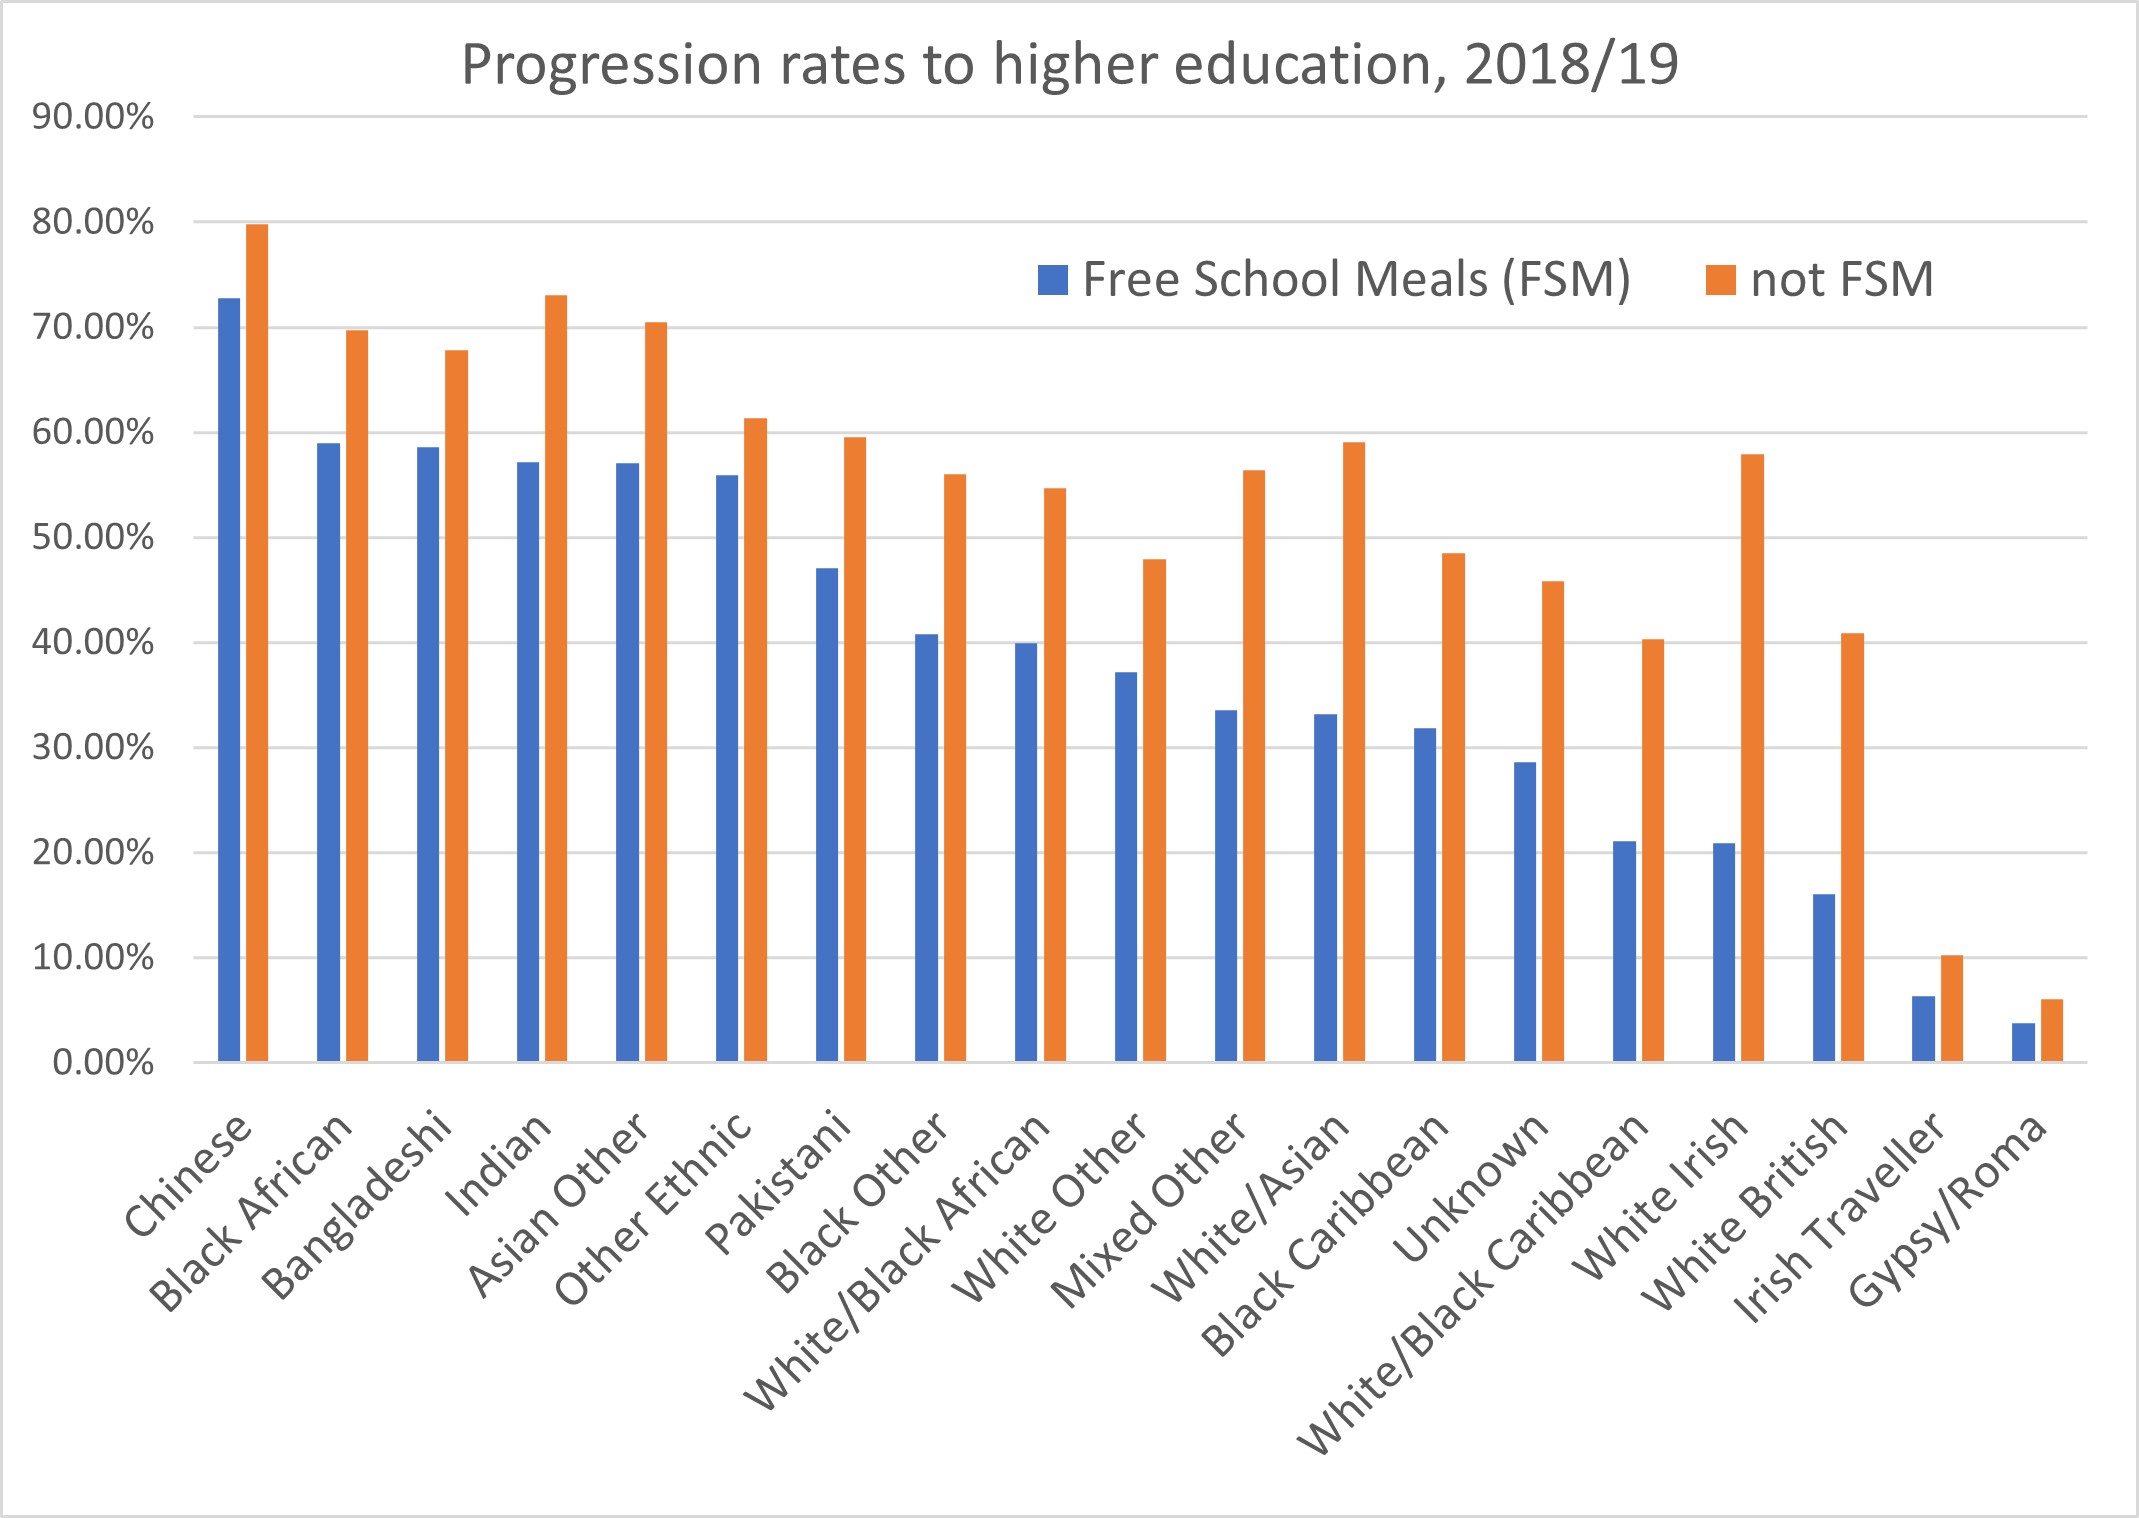
The Government report again does a good job of dispelling misconceptions about race and progression to higher education. The data in Table 7 have been plotted below as Figure 7. This shows how terribly badly the White British group does compared to all other ‘major’ ethnic groups, even being outperformed by the Black Caribbean groups (again only Travellers/Roma do worse).
As regards entry into higher education, the ethnic group becomes more significant than parental socioeconomics (in contrast to the position at GCSE, Figure 2). Receiving free school meals (FSM) is used as a crude marker for socioeconomic class.
A White British 18/19-year old who is not FSM is less likely to go to university than a person who is FSM but from any one of seven non-White groups: Chinese, Black African, Bangladeshi, Indian, Pakistani, Other Asian or Other Ethnic.
The position of Black Africans in second place in terms of entry into HE (broadly equal to Bangladeshis, Indians and Other Asians) is particularly noteworthy.
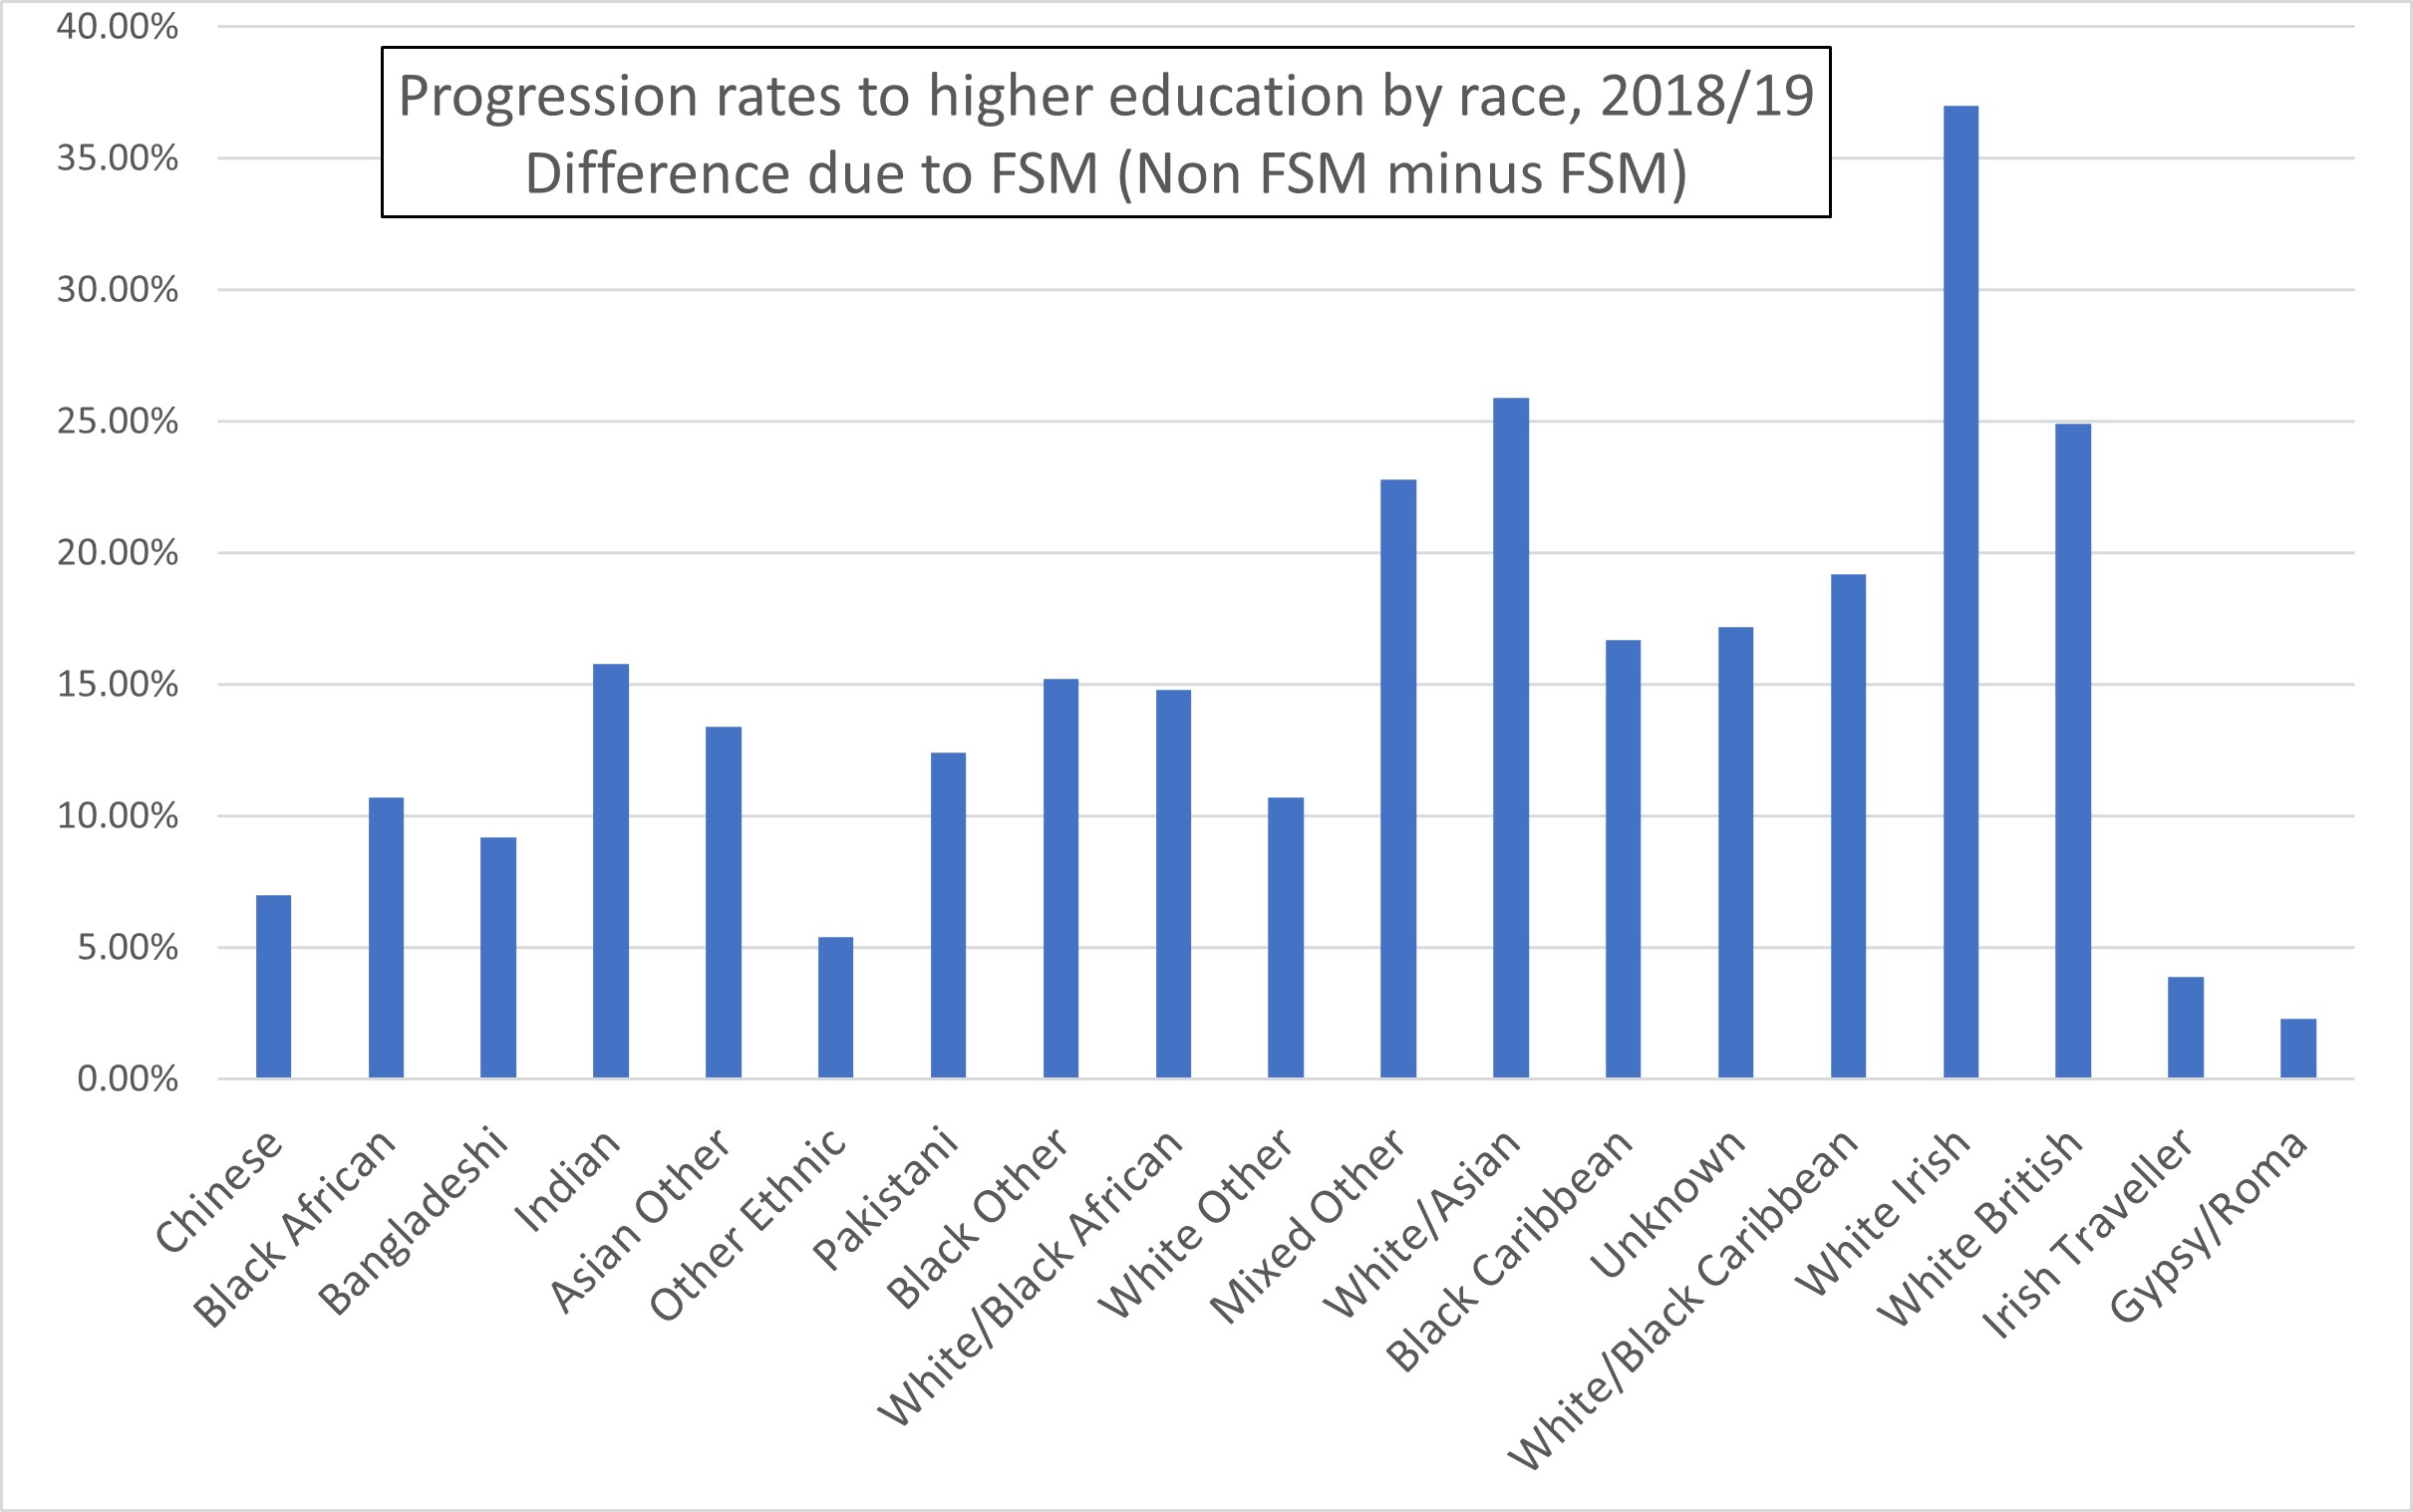
Figure 8 shows how socioeconomics (i.e., FSM) effects entry to higher education differently according to ethnic group. The ethnic groups for which the socioeconomic factor is most disadvantageous are the white groups.
So the ethnicity/socioeconomic intersection effect is largest for Whites.
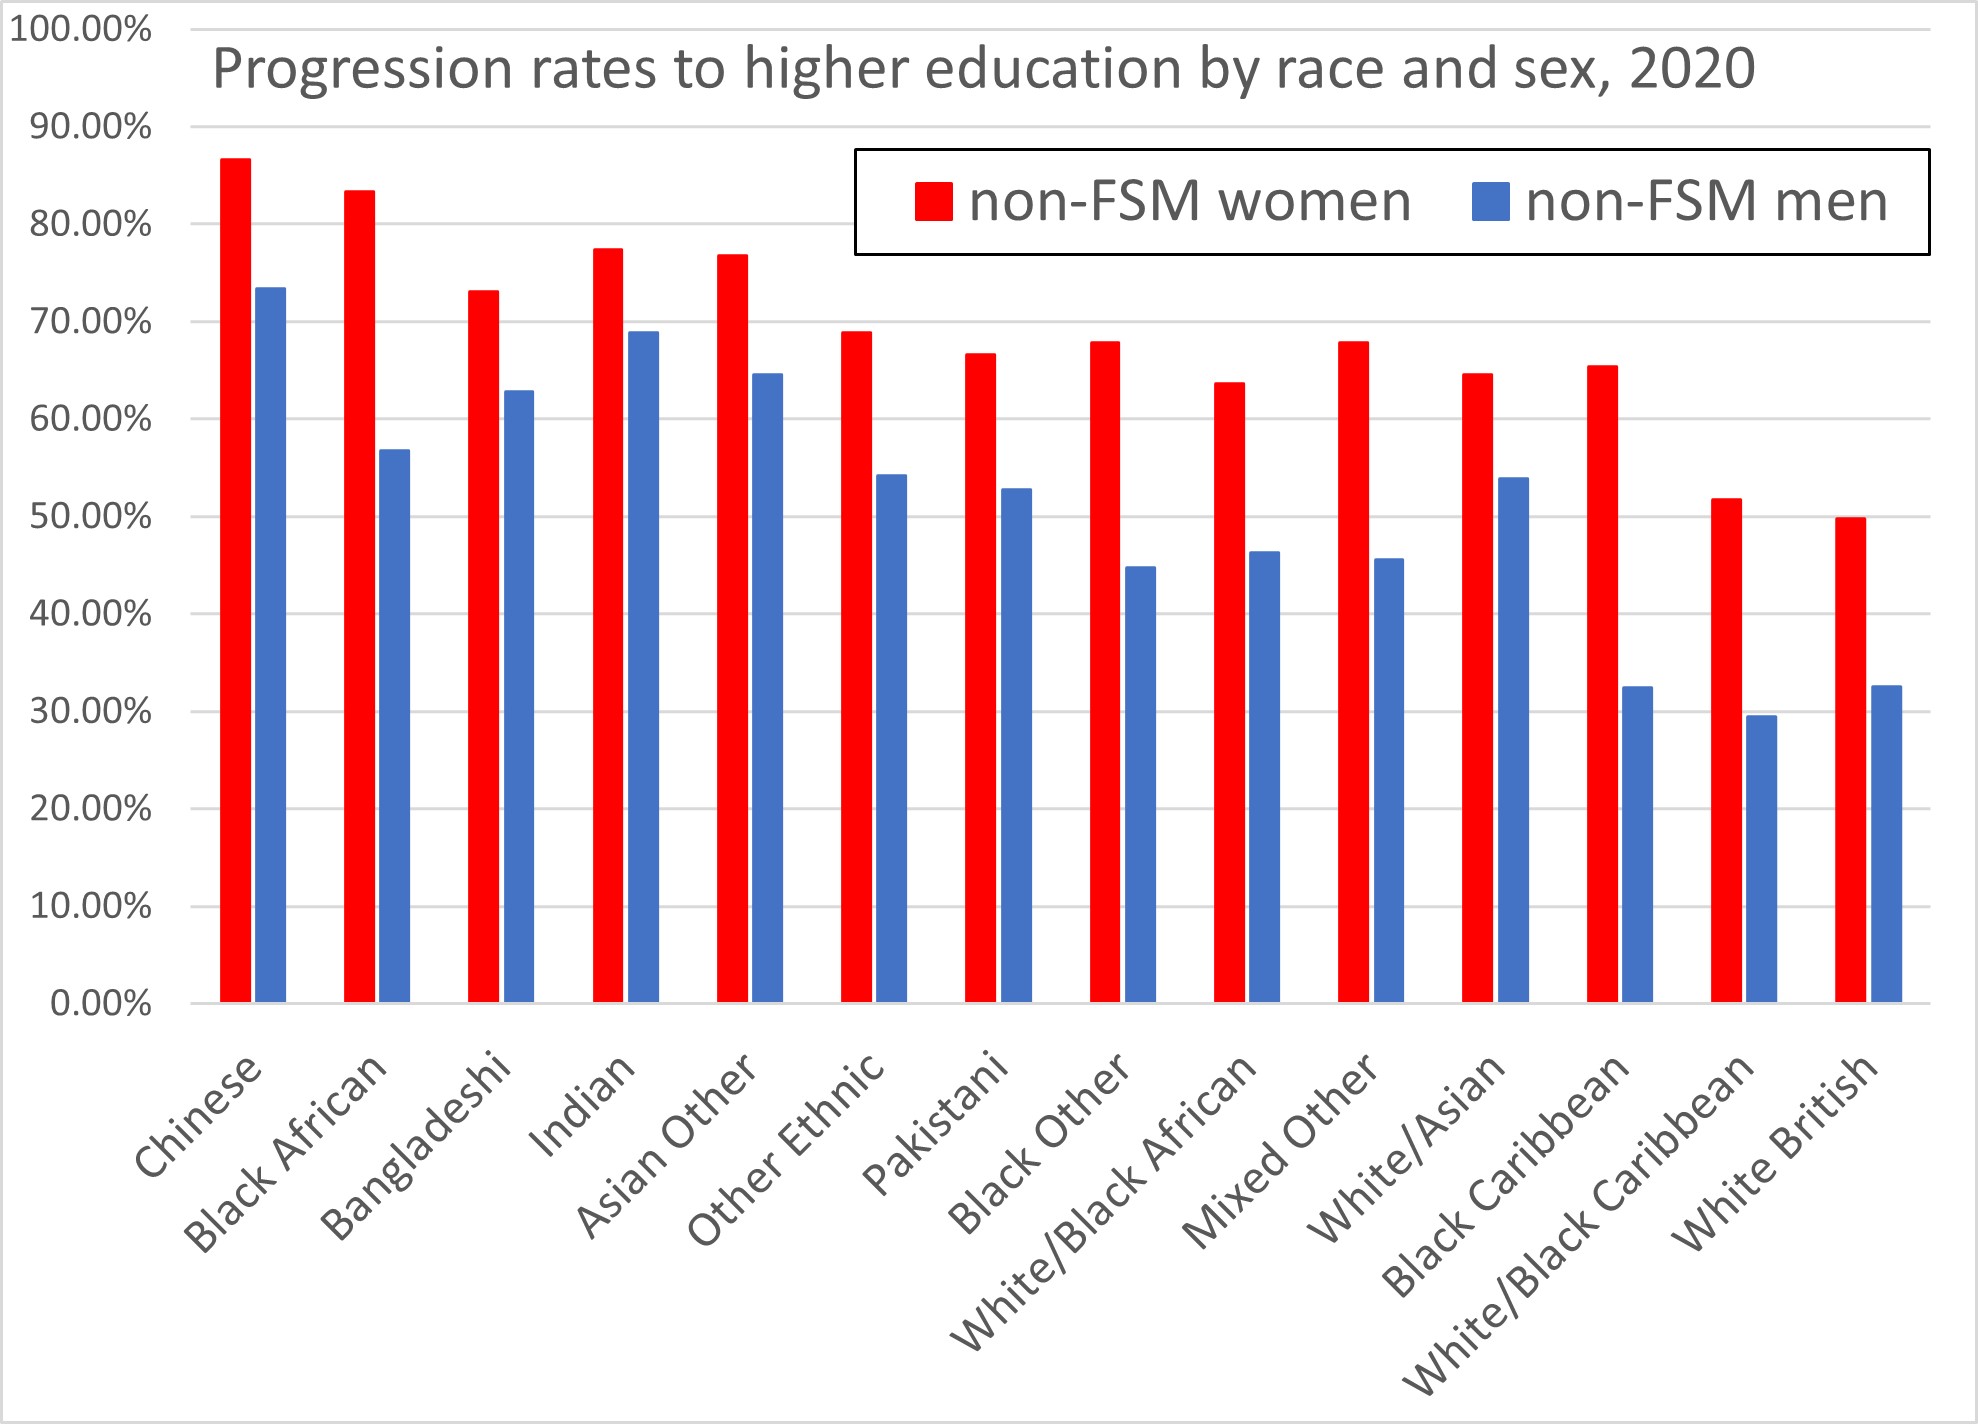
However, the Government report does not disaggregate the higher education data by sex. To do so I have used the 2020 UCAS end-of-cycle data for “accepted applicants”. This source gives the actual number of acceptances broken down by sex and by most of the ethnic groups used in Figure 7. Hence these data provide the ratio of female to male entrants into HE by each ethnic group. Armed with this, the data of Figure 7 can be used to deconvolute the progression rates separately for each sex and each ethnic group. (I have included a correction for the different numbers of male and female 18 year olds, this being the dominant age at entry).
Note that all the HE data here relates to UK domiciled students only, not to the total UK HE entrants (many of whom are from abroad). Consequently the ethnicity, sex and socioeconomic dependencies are specific to the UK.
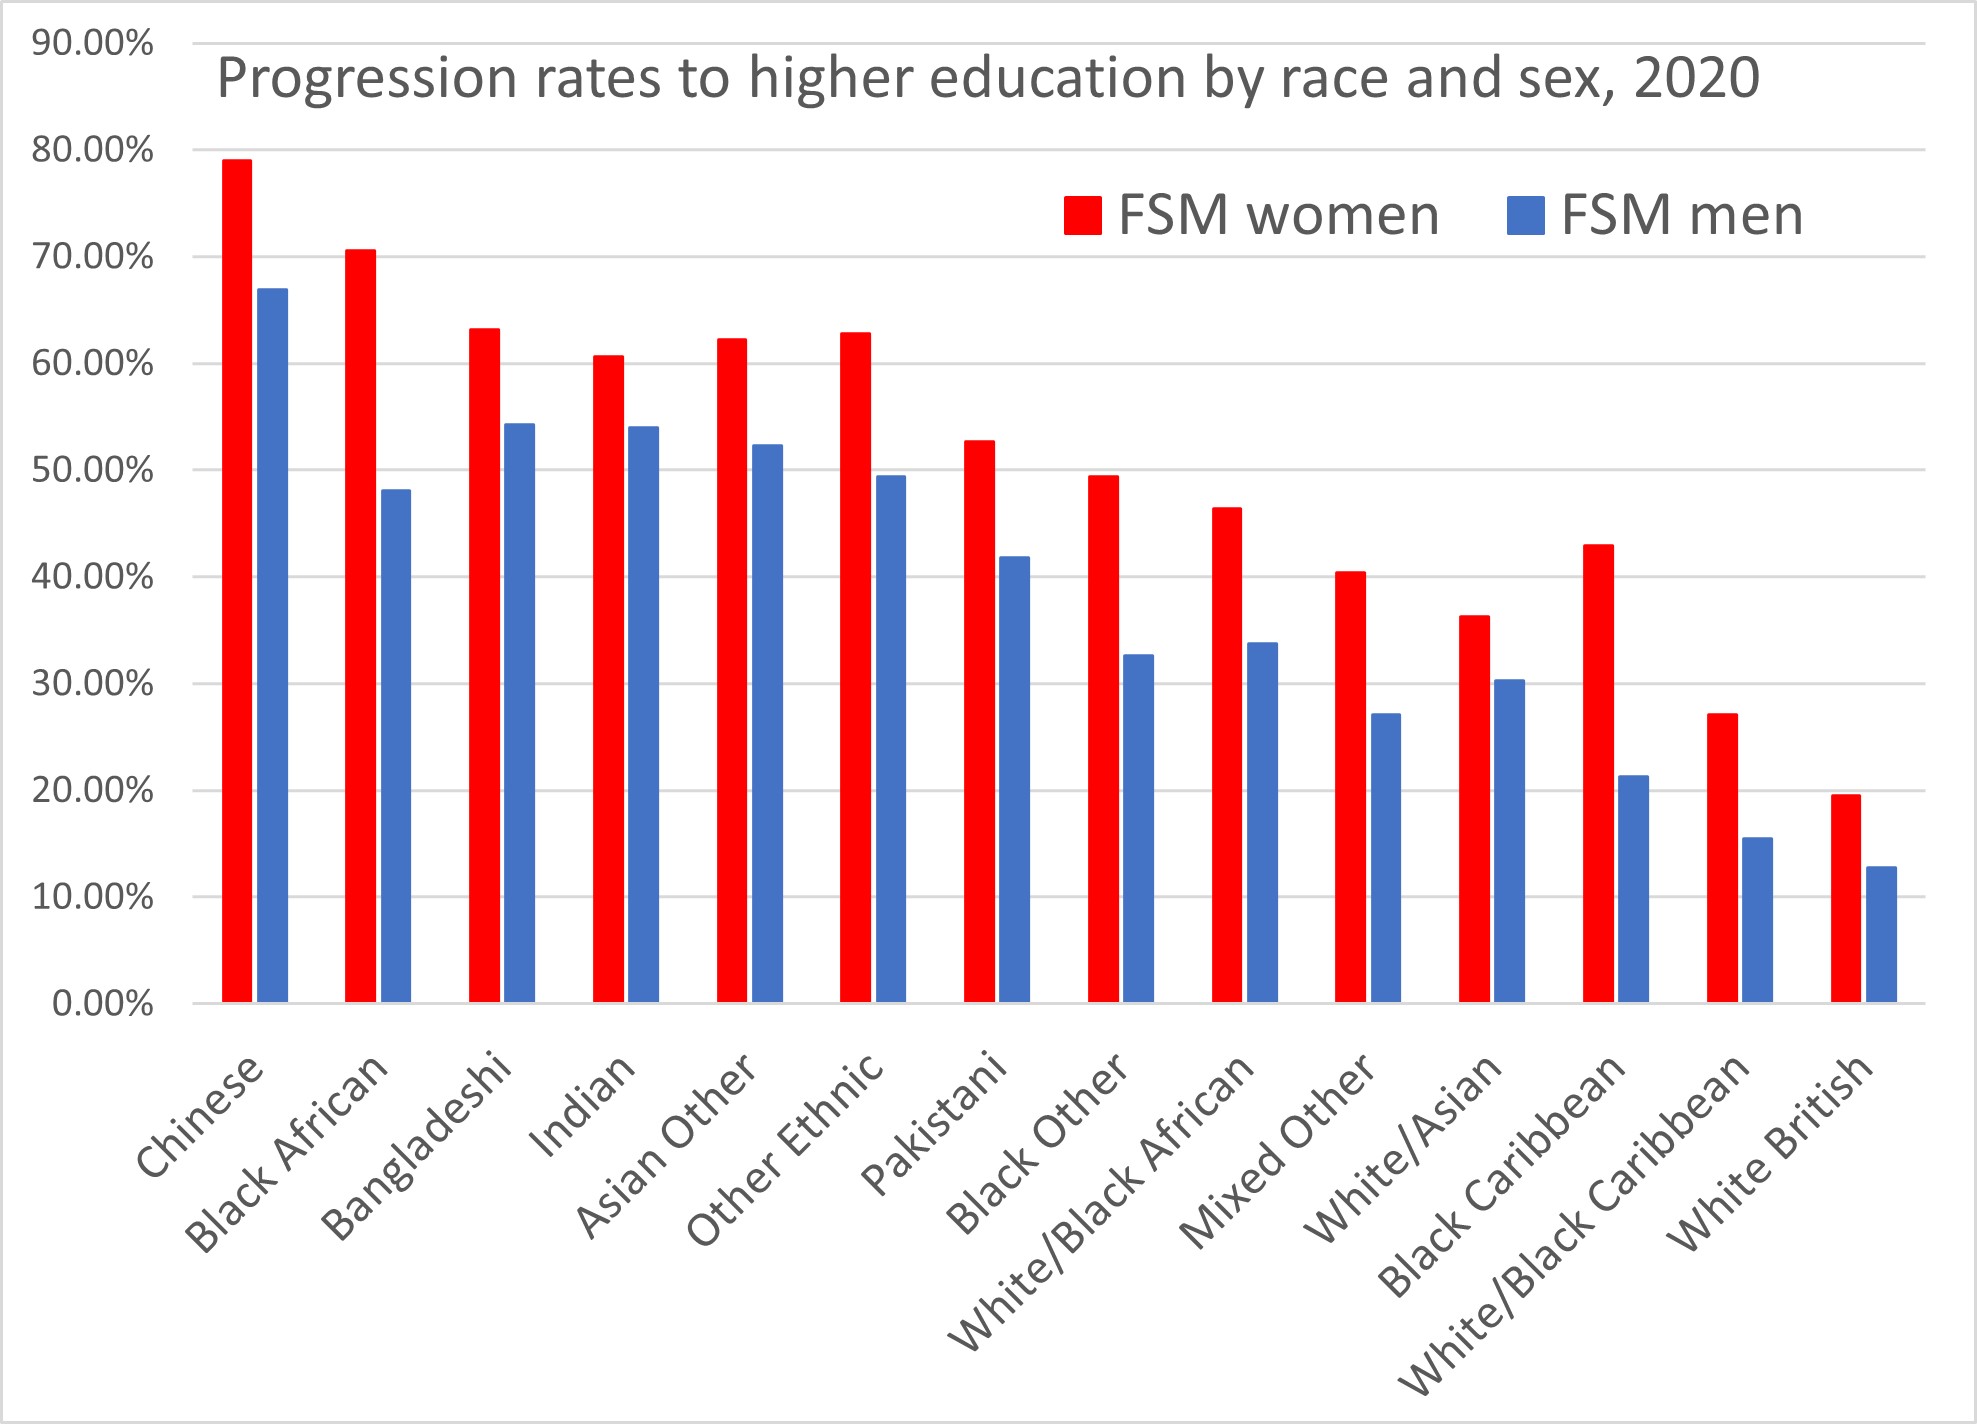
Figure 9 is the resulting histogram of progression to HE for the sexes separately and for non-FSM. Figure 10 is the equivalent for FSM. Comparing the spread due to ethnicity in the two Figures, it is immediately clear that this is far greater for FSM individuals, i.e., socioeconomics accentuates ethnic disparities (as is also clear from Figure 8).
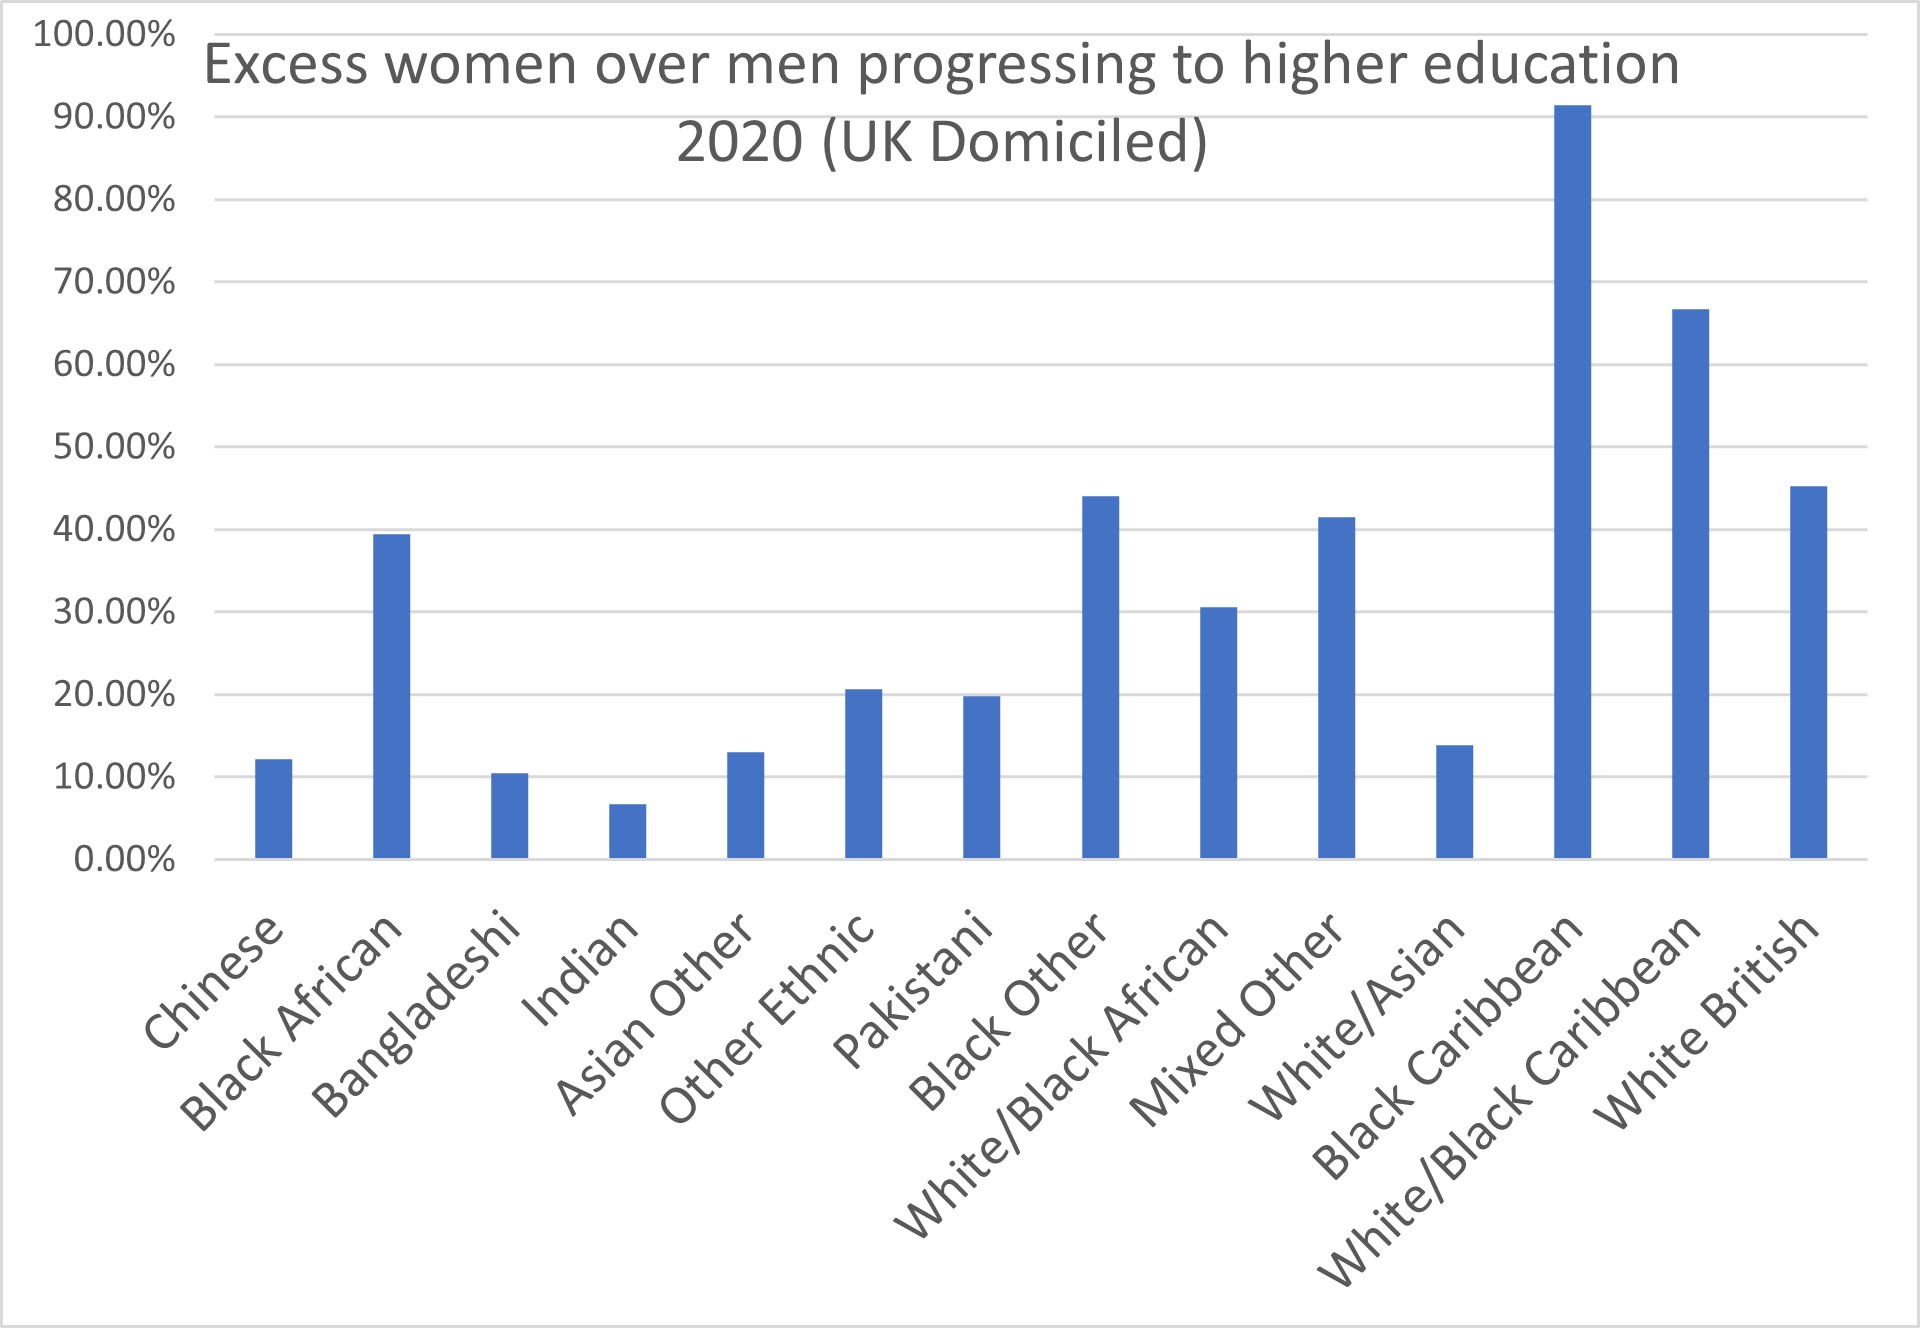
Finally, Figure 11 plots the percentage by which the number of UK domiciled women accepted into HE exceeds that of men in 2020, against ethnic group. This is based on UCAS data alone and is not disaggregated by socioeconomics. The sex disparity is greatest for Whites and Blacks, especially Black Caribbean, and least for the several Asian groups including Chinese.
If you look back at the graphic which heads my 2016 post HEPI Report on Male Underachievement in Higher Education you will see that it shows that, in 2015, a poor black woman was three times more likely to progress to HE in the UK than a poor white man. But that data did not disaggregate Black Africans and Black Caribbeans, which we now see to be at opposite ends of the achievement distribution. Figure 10 allows us to be more specific.
Despite Black Caribbeans as a whole being near the bottom of the educational heap, in 2020 a poor black Caribbean woman was 3.4 times more likely to go to university in the UK than a poor white man. And a poor black African woman was 5.5 times more likely.
Conclusions
At GCSE (age 16) the intersection of race and sex creates the greatest disadvantage to White British Boys and Black Caribbean Boys (Figures 3, 4).
The effect of sex swamps that of ethnicity as regards permanent school exclusions (Figure 6).
As regards entry into higher education, the intersection of race and socioeconomics creates the greatest disadvantage for White groups (Figure 8).
As regards entry into higher education, the intersection of race and sex creates the greatest disadvantage for White and Black groups, especially Black Caribbean, and least for the various Asian groups including Chinese (Figure 11).
In 2020, for UK domiciled people, a poor (i.e., FSM) black Caribbean woman was 3.4 times more likely to go to university in the UK than a poor white man. And a poor black African woman was 5.5 times more likely (Figure 10).