This will be a rather flat-footed presentation of salient data relating to children “in need” and “in care”. All the data herein relates to England alone (not the whole of the UK) unless otherwise stated. Data relates to the year ending March 2018, or at 31 March 2018, unless otherwise stated.
Throughout it will be seen that boys outnumber girls in care, in need, and in all their adverse effects.
(NB: Whilst male babies outnumber female babies at birth, in the UK the sex ratio at birth is, in round numbers, 51% to 49%. This does not explain the extent to which boys outnumber girls in care and in need, which is significantly greater).
Terminology / Definitions
By “in care” I strictly mean a child “looked after by a local authority”, defined under the Children Act 1989. This applies if the child (i) is provided with accommodation for a least 24 hours, or, (ii) is subject to a care order or a placement order.
Children classified as “in need”, or subject to a protection order, are not necessarily included in the “care” statistics. The number of children classed as “in need” is far larger than the number “in care” (nearly ten times as many).
“Child” means all those under 18.
Sources
Number of children in care: https://www.gov.uk/government/statistics/children-looked-after-in-england-including-adoption-2017-to-2018
Characteristics of children in need: https://www.gov.uk/government/collections/statistics-children-in-need
Outcomes for looked-after children: https://www.gov.uk/government/statistics/outcomes-for-children-looked-after-by-las-31-march-2018 and https://www.gov.uk/government/collections/statistics-looked-after-children
National KS2 SATS statistics: https://www.gov.uk/government/statistics/national-curriculum-assessments-key-stage-2-2018-provisional
Number of Children in Care (England)
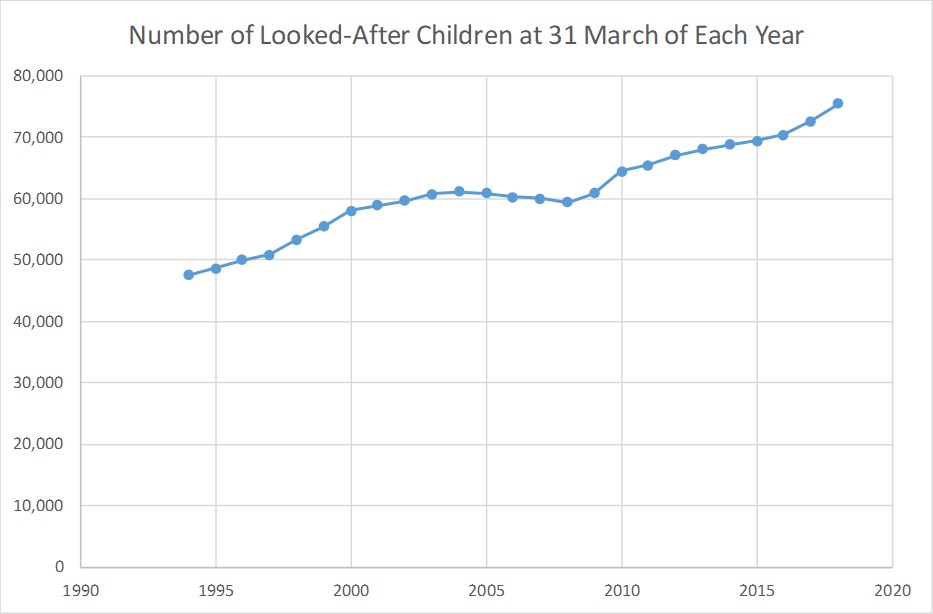
The number of children in care has increased from 47,590 in 1994, shortly after the 1989 Children Act was passed, to 75,420 in 2018, see Figure 1.
Of these, 69% (52,180) had been looked after for a continuous period of at least a year.
The total number of children in care at some time during 2017/18 was 104,100 (58,620 boys, 45,480 girls). That’s 0.9% of the population of children under 18.
There are 28% more boys than girls in care (the gender split is 56.1% to 43.9%).
In 63% of cases the main reason for the child being taken into care was classed as “neglect or abuse”. (Family dysfunction is the second largest category, at 15%, and then absent parenting at 6.4%).
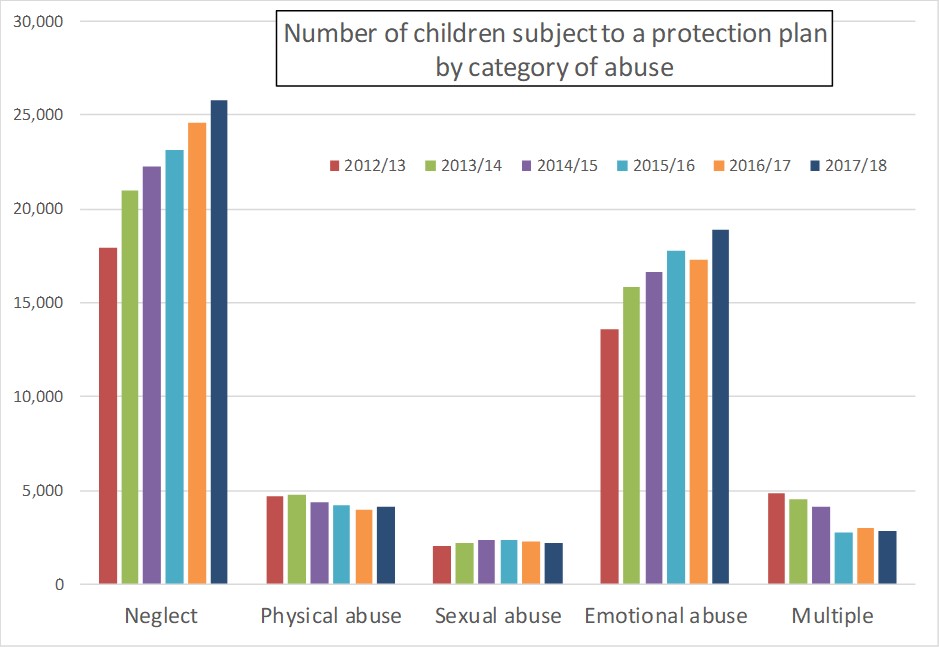
The care data do not disaggregate between neglect and abuse. However, data relating to protection plans do disaggregate and indicate that neglect is four times more frequently the cause than physical and sexual abuse combined (though emotional abuse is also a major factor), see Figure 6.
19% of children in care were placed in care by voluntary agreement. The rest were almost all subject to care orders or placement orders. 290 (0.38%) were remanded to youth detention centres.
280 of the children in care are also mothers.
The average duration of a continuous period in care is 25 months. (But a given child may be subject to more than one such period in care).
The number of boys in care convicted of offences or cautioned during the year was 1,150 (5.5% of boys in care aged between 12 and 17), compared with 360 girls (2.3% of girls in care aged between 12 and 17).
Just under 30,000 children left the care system in the last year, and 32,000 entered care.
Of those leaving care in the last year, 31% did so because they reached 18.
700 children left young offenders’ institutions or prison in the last year (2.3% of those leaving care).
Figure 1: The number of children in care, 1994 – 2018
Ethnicity in Care
Ethnicity of children in care: 30% are not “White British” and 25% are not “White”. (These compare with the national figures of 19.5% and 15% respectively).
The number of unaccompanied asylum-seeking children in care has increased from 2,060 in 2014 to 4,480 in 2018. 92% of these are boys, and 82% are aged 16 or 17.
The ethnicity of unaccompanied asylum-seeking children in care is: White 11%, Black 25%, Asian (excluding Chinese of which there are almost none) 25%, “Other” 36%. I believe that “Other” can probably be interpreted as “Semitic” (recalling that, despite the universal misuse of the term “antisemitic”, Semitic does not mean “Jewish”).
Emotional and Behavioural Health in Care
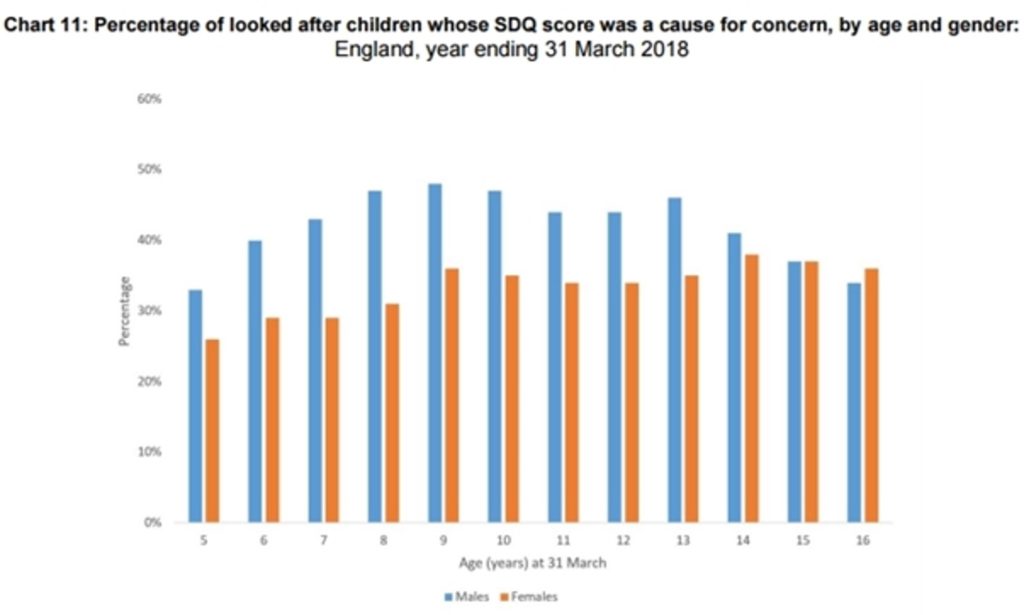
Children in care aged 5 to 16 are subject to a Strengths and Difficulties Questionnaire (SDQ). This is used to indicate a child’s wellbeing, or otherwise. A score of 0 to 13 is considered normal, 14 to 16 is borderline, and 17 to 40 is a cause for concern.
9,350 boys (42% of the relevant cohort) and 6,060 girls (35% of the relevant cohort) scored at the “cause for concern” level, a substantial excess of boys (by 54%). See Figure 2.
Figure 2: SDQ Score, Boys and Girls
Adoption from Care
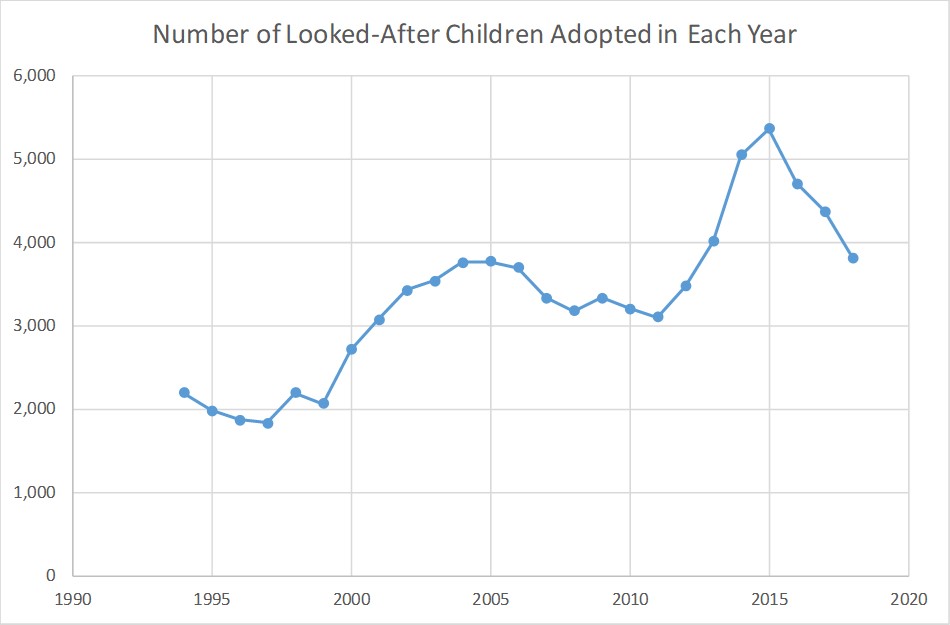
The number of children adopted from care has increased from 2,190 in 1993/94, shortly after the 1989 Children Act was passed, to 3,820 children in 2017/18 (though that is down from 5,050 in 2013/14).
Parental consent was “dispensed with” in 88% of cases of children adopted from care.
The likelihood of adoption from care diminishes rapidly after the age of 4. 78% of those adopted were 4 or younger, 20% were aged 5 to 9.
Girls are (marginally) more likely to be adopted from care than boys (5.5% cf 4.8%).
Just over 10% (400) of the adopters were single (370 women, 30 men).
Just under 70% of the adopters were a married couple of different sex, and a further 8% were an unmarried couple of different sex.
12% (460) of adopters were a couple of the same sex (280 male
couples, 180 female couples).
Figure 3: Number of adoptions from care, 1994 – 2018
Children in Need (England)
705,060 children in England were classed as “in need” at some time during 2017/18, just under 6% of all children in England (see also Figure 4).
The number of children “in need” at 31 March 2018 was 404,710 (see also Figure 4).
Of children in need at 31 March 2018, 54% were boys and 46% girls (an excess of boys of 18%).
The number of children with a protection plan starting during 2017/18 was 68,770. This statistic has been increasing markedly over the preceding 9 years (Figure 5).
The number of children with a protection plan at 31 March 2018 was 53,790. This statistic has been increasing markedly over the preceding 9 years (Figure 5).
Figure 6 shows the breakdown of the categories of abuse leading to protection orders. Neglect is the most common reason (48%), with emotional abuse easily the second most common (35%). Moreover, these are the two categories which have been increasing, and together account for the overall increase in protection plans seen in Figure 5. Physical abuse (8%) has been falling as a cause, and sexual abuse (4%) roughly static.
These datasets do not include information on perpetrators. However, the nature of the dominant abuse categories suggests that mothers rather than fathers are the main perpetrators, and moreover that it is abuse by mothers which is mainly leading to the increasing incidence of protection orders. It would be valuable to obtain specific data to confirm this implication.
At 31 March 2018, more boys (27,160) than girls (25,410) were the subject of a child protection plan. More boys had protection plans in every abuse category except sexual abuse. Sexual abuse was the abuse category leading to a protection plan for 1,330 girls and 810 boys.
Ethnicity in Need
Where ethnicity was recorded, at 31 March 2018, 27.4% of children in need were non-white (cf., 15% in the general population).
Where ethnicity was recorded, at 31 March 2018, 23.1% of children with a protection plan were non-white (cf., 15% in the general population).
Figure 4: Number of children in need (England)
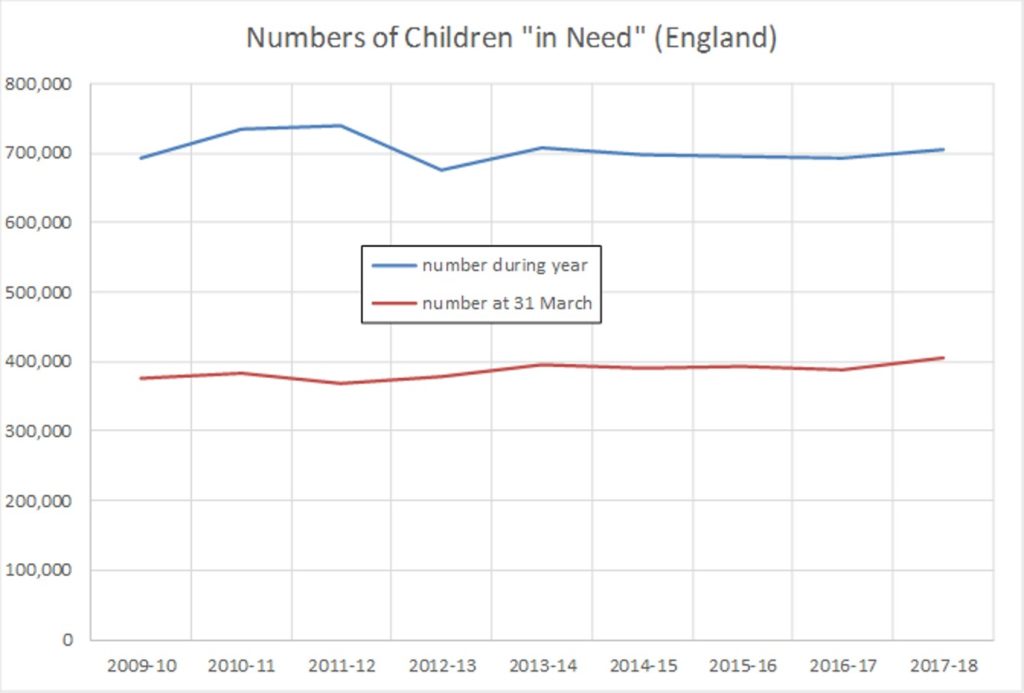
Figure 5: Number of children with protection plans
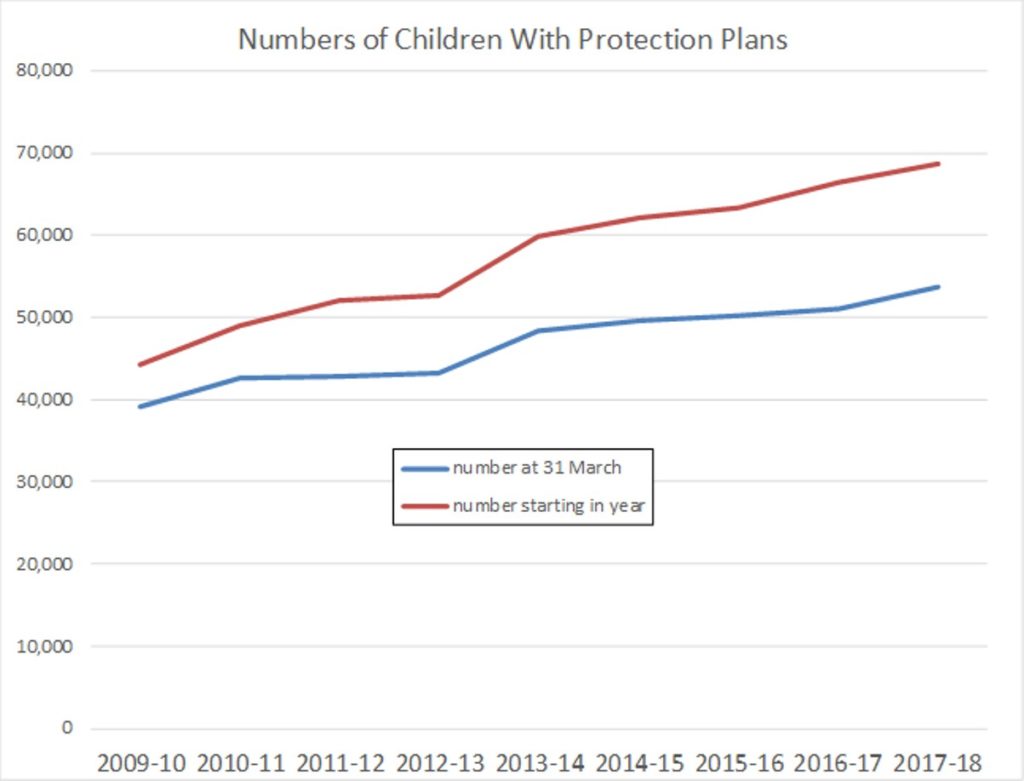
Figure 6: Number of children subject to a protection plan by category of abuse

Educational Attainment of Children in Need or in Care
The datasets consider outcomes for specific subsets of those in need or in care. For brevity I shall use the same shorthand but note that, for the purpose of educational outcomes,
- “looked-after children” means children aged 5 to 16 who have been looked after for a continuous period of at least 12 months at 31 March 2018;
- “children in need” means children in need aged 5 to 16 but not also looked after at 31 March 2018.
55.5% of looked after children were classed as SEN (Special Educational Needs). This compares with the national average of 14.4%.
45.7% of children in need were classed as SEN.
With such high prevalence of SEN in these demographics it is inevitable that educational attainment will be poor compared with the national average. Whether the disadvantages that lead to a child being in need (or in care) are causally implicated in the observed incidence of SEN, or whether the two things relate to a common third variable (e.g., genetics) I do not know. It would be interesting to investigate this further. These datasets do not address the issue.
Table 1a compares the Key Stage 2 SATS results (10/11 year olds) for in-need and in-care children identified as SEN with the national average, for boys and girls separately. The data are the percentages of the cohort achieving the expected standard. Unsurprisingly, the children rated as SEN perform very poorly compared with the national average.
Table 1b is the same for the non-SEN children in-care or in-need. For these in-care/in-need children the attainment is much closer to the national average, especially for the boys. The in-care/in-need girls are a little behind the (higher) national average for girls. However, comparing Tables 1a and 1b shows how meaningless it would be to concentrate on the attainment level for the in-need/in-care children as a whole, without disaggregation according to SEN categorisation (which is sometimes done). The non-SEN contingent is broadly comparable with the national average at age 11.
But things change dramatically by age 16 at GCSE. Tables 2a and 2b are a savage indictment of the care and “in need” processes in terms of educational attainment at secondary school. Table 2a indicates that the SEN contingent achieve even the 9-4 grade range in both English and Maths only in single figures of percent. The performance of SEN pupils would not be expected to be stellar, but the national average for SEN pupils is at least in double figures of percent (11% – 27%).
More concerning still is Table 2b for the non-SEN contingent within the in-need and in-care demographics. Performance at KS2 SATS (Table 1b) implies that this cohort is not lacking in ability compared with the national average. And yet, by age 16 they have fallen radically behind the national average in GCSE performance (Table 2b). This is true for both boys and girls, with boys doing even worse than girls (as is the case nationally, of course). This underperformance at GCSE is clearly attributable to the disadvantages associated with being in care / in need.
Table 1a: Key Stage 2 SATS Results: Percentages Reaching the Expected Standard, 2018
| Subject | SEN Males* | SEN Females* | National Male | National Female |
| Reading | 23(33) | 23(32) | 72 | 79 |
| Writing | 17(25) | 23(30) | 72 | 84 |
| Maths | 22(32) | 20(24) | 75 | 76 |
| Grammar, spelling, etc | 20(29) | 23(30) | 73 | 82 |
| All of Reading, Writing & Maths | 11(17) | 13(16) | 61 | 69 |
*In Need (Looked After)
Table 1b: Key Stage 2 SATS Results: Percentages Reaching the Expected Standard, 2018
| Subject | Non-SEN Males* | Non-SEN Females* | National Male | National Female |
| Reading | 75(69) | 77(74) | 72 | 79 |
| Writing | 77(70) | 84(80) | 72 | 84 |
| Maths | 77(72) | 69(68) | 75 | 76 |
| Grammar, spelling, etc | 77(71) | 79(77) | 73 | 82 |
| All of Reading, Writing & Maths | 62(53) | 60(58) | 61 | 69 |
Table 2a: GCSE: Percentages Achieving Grades 9-4 and 9-5 in Both English and Maths, 2018
| Grade Range | SEN Males* | SEN Females* | National Male | National Female |
| 9 – 4 | 5(7) | 7(9) | 55 | 64 |
| 9 – 5 | 2(3) | 3(3) | 37 | 44 |
Table 2b: GCSE: Percentages Achieving Grades 9-4 and 9-5 in Both English and Maths, 2018
| Grade Range | Non-SEN Males* | Non-SEN Females* | National Male | National Female |
| 9 – 4 | 31(29) | 35(38) | 55 | 64 |
| 9 – 5 | 16(13) | 17(18) | 37 | 44 |