You sure?
In 2014 I published “The Trouble with Boys in Education”. In it I showed how published SATS results at Key Stage 2 (11 year olds) contained clear indication of teacher bias against boys. The data extended to year 2013. Here I repeat the exercise using more recent data, up to 2016. The data up to 2015 can be found here, and that for 2016 here.
Until 2015 the KS2 SATS results were expressed as an attainment ‘level’ of 2, 3, 4, 5 or 6. Level 5 was the expected attainment at age 11, whereas Level 6 was a superior score. Level 4 was OK, but a little below the target attainment, whilst Levels 2 and 3 were seriously below expectation.
The KS2 SATS comprised of both tests and teacher assessments. The comparison of the two provides an opportunity to examine teacher bias.
All the results used here refer to the total pupils at the Level in question, summed over all schools in England, expressed as a percentage of the total cohort size of the same sex.
Figure 1 shows the results of the reading test, in the form of the percentage of the cohort which scored (i) Level 4 or above, and (ii) Level 5 or above. Figure 2 is the equivalent based on teacher assessment. (The teacher assessment for reading has been used from 2012 onwards, but the teacher assessment for “English” prior to that year, there being no separate reading assessment before 2012). Girls do consistently better than boys at reading, in both Figures, but the gender gap is clearly larger for the teacher assessment.
Figures 3 and 4 are the equivalents for maths, respectively for the test results and the teacher assessments.
Teacher bias is defined as follows,
Bias = (Ag – Tg) – (Ab – Tb)
where A refers to the teacher assessment and T refers to the test result, and g and b refer to girls and boys respectively. The term (Ag – Tg) indicates the extent to which the teachers tended to mark girls higher than suggested by the test results. If negative, they tended to mark them lower than the tests. However, this alone does not indicate gender bias. If the teachers were (say) more lenient in their assessments than the tests, but were equitable, then their leniency towards girls, (Ag – Tg), would be the same as their leniency towards boys, (Ab – Tb). In this case the “bias”, as defined above, would be zero.
The bias, as defined, indicates the extent to which, on average, teachers tend to be more lenient towards girls than towards boys, or more harsh towards boys than towards girls. If negative, reverse that.
Figure 5 shows the bias apparent in the 2015 KS2 SATS in reading, writing and maths, by attainment Level. It is immediately apparent that teachers bias girls’ score up in the higher Levels, 5 and 6, whilst unfairly assigning more boys to the lower Levels 2, 3 and 4. This is apparent in all subjects.
(NB: In the case of “writing” I have paired up the teachers’ writing assessments with tests on “grammar, punctuation and spelling”, which was the nearest equivalent).
Figure 6 is the equivalent of Fig.5 for year 2013 and shows the same phenomenon.
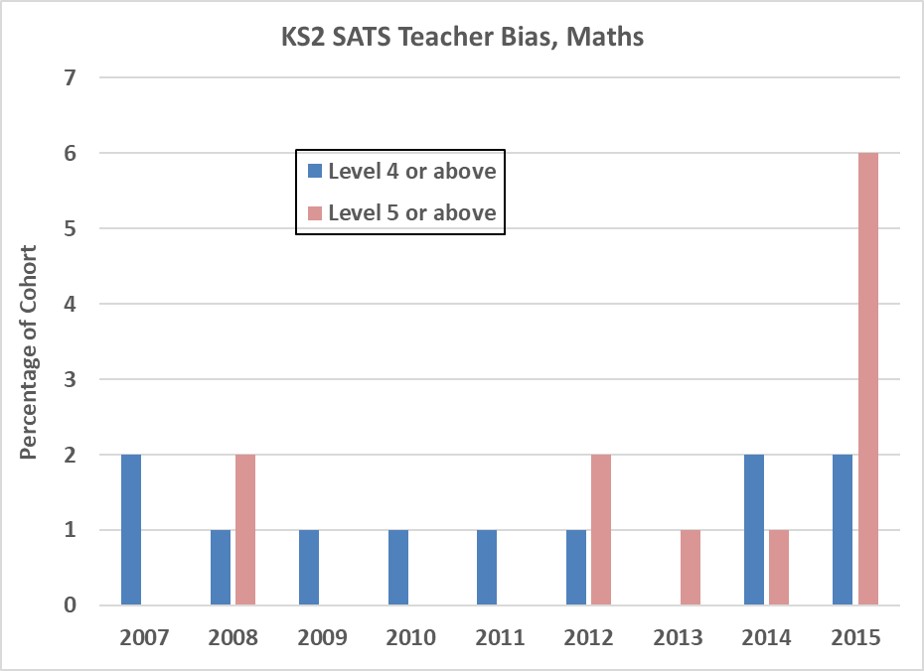
Figures 7 and 8 show how the teacher bias has varied between 2007 and 2015. In these Figures the bias is with respect to “Level 4 or above” or “Level 5 or above”. Figure 7 is for reading and writing, Figure 8 is for maths. The bias is almost always in favour of girls (i.e., positive), and persistently so over the years and across all subjects.
The teachers’ bias in favour of girls is up to 6% (i.e., up to 6% of the cohort of girls are up-graded compared to boys). However, many of the biases are only 1% or 2%, though these are persistent and appear statistically significant. The bias appears to be rather larger in reading and writing than in maths.
Whilst the bias is small in absolute terms, it is a large proportion of the gender gap in attainment. Hence, the apparent gender gap would be significantly smaller if the bias were zero.
Based on test scores alone, girls do outperform boys in reading and writing. Based on test scores alone, boys outperform girls at maths at Level 5 and above (by 8% in 2015).
Results for year 2016 no longer used the same system of Levels, so are difficult to compare quantitatively. (My hand-written summary of the 2016 results is here). However, the same trends are apparent. In both maths and writing/grammar the teacher bias was in favour of girls by 2% as regards “meeting the standard”. As regards being below standard, the teacher bias accounted for 2% to 3% downgrading of boys compared to girls in these same subjects. (There was no teacher bias in reading in 2016).
The teacher assessments in 2016 had girls outperforming boys in all subjects: reading, writing, maths and science, as regards “meeting the expected standard”. However, in the maths test, boys did better than girls at the “higher than expected standard” level (18% cf 15%). There was no science test.
In 2016, 50% of boys and 57% of girls achieved the expected standard in all three of reading, writing and maths.
Conclusion
Teacher bias in favour of girls continues to be demonstrated by the KS2 SATS results. Bias in favour of girls occurs in all subjects and all years (2007 to 2016). Bias can be as high as a 6% relative upgrading, though typically rather less (see Figures 5 to 8).
Figure 1 – click on any Figure to enlarge
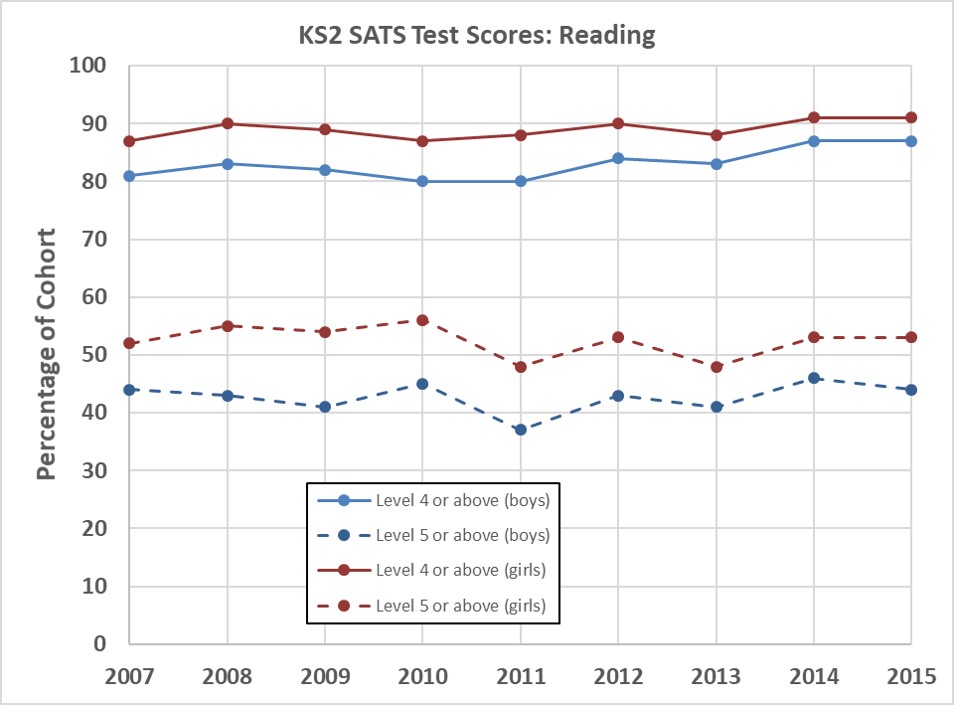
Figure 2

Figure 3
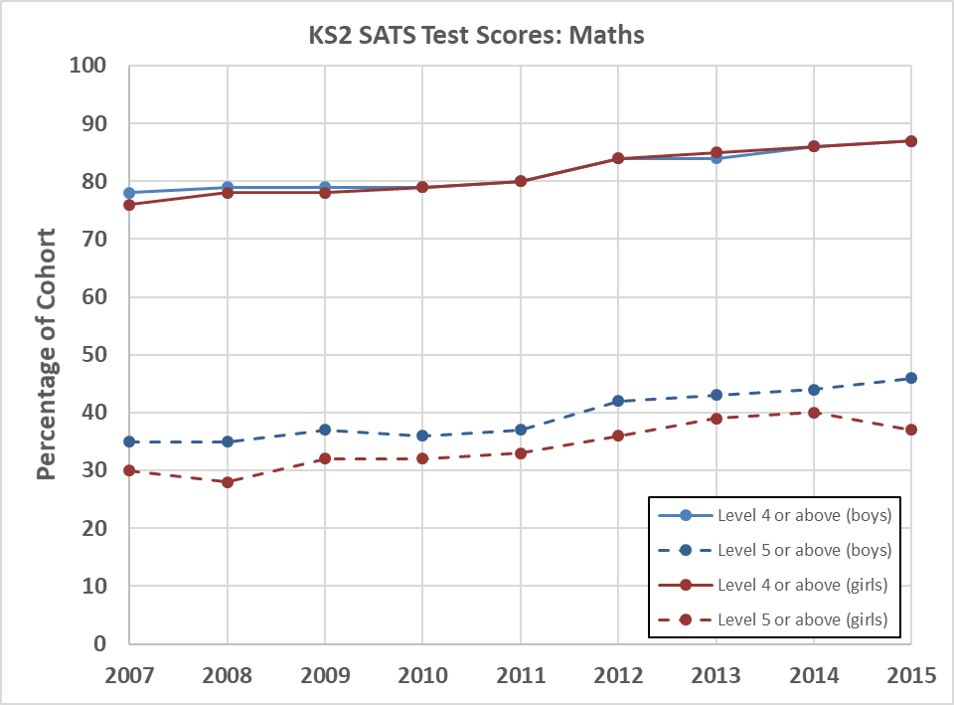
Figure 4
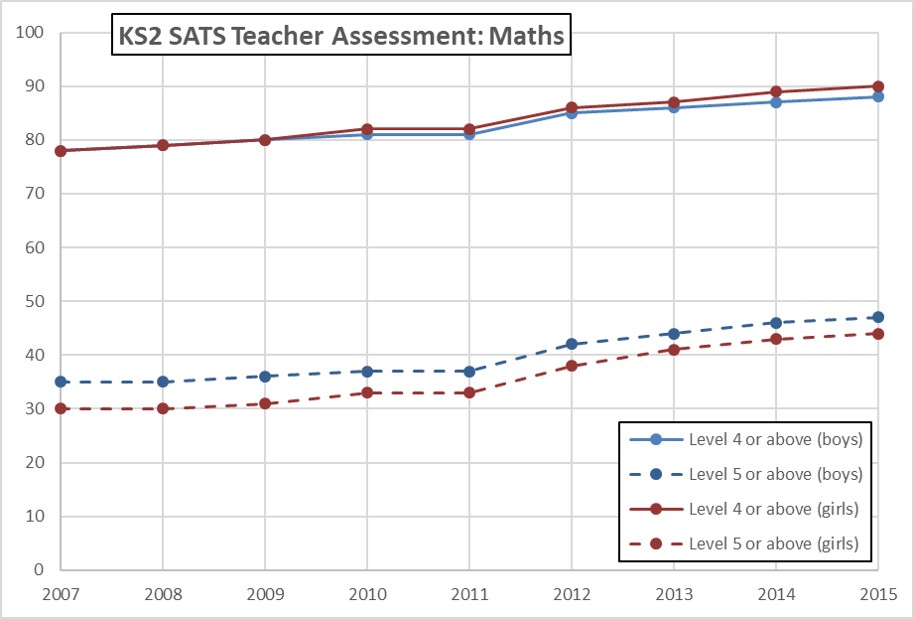
Figure 5

Figure 6
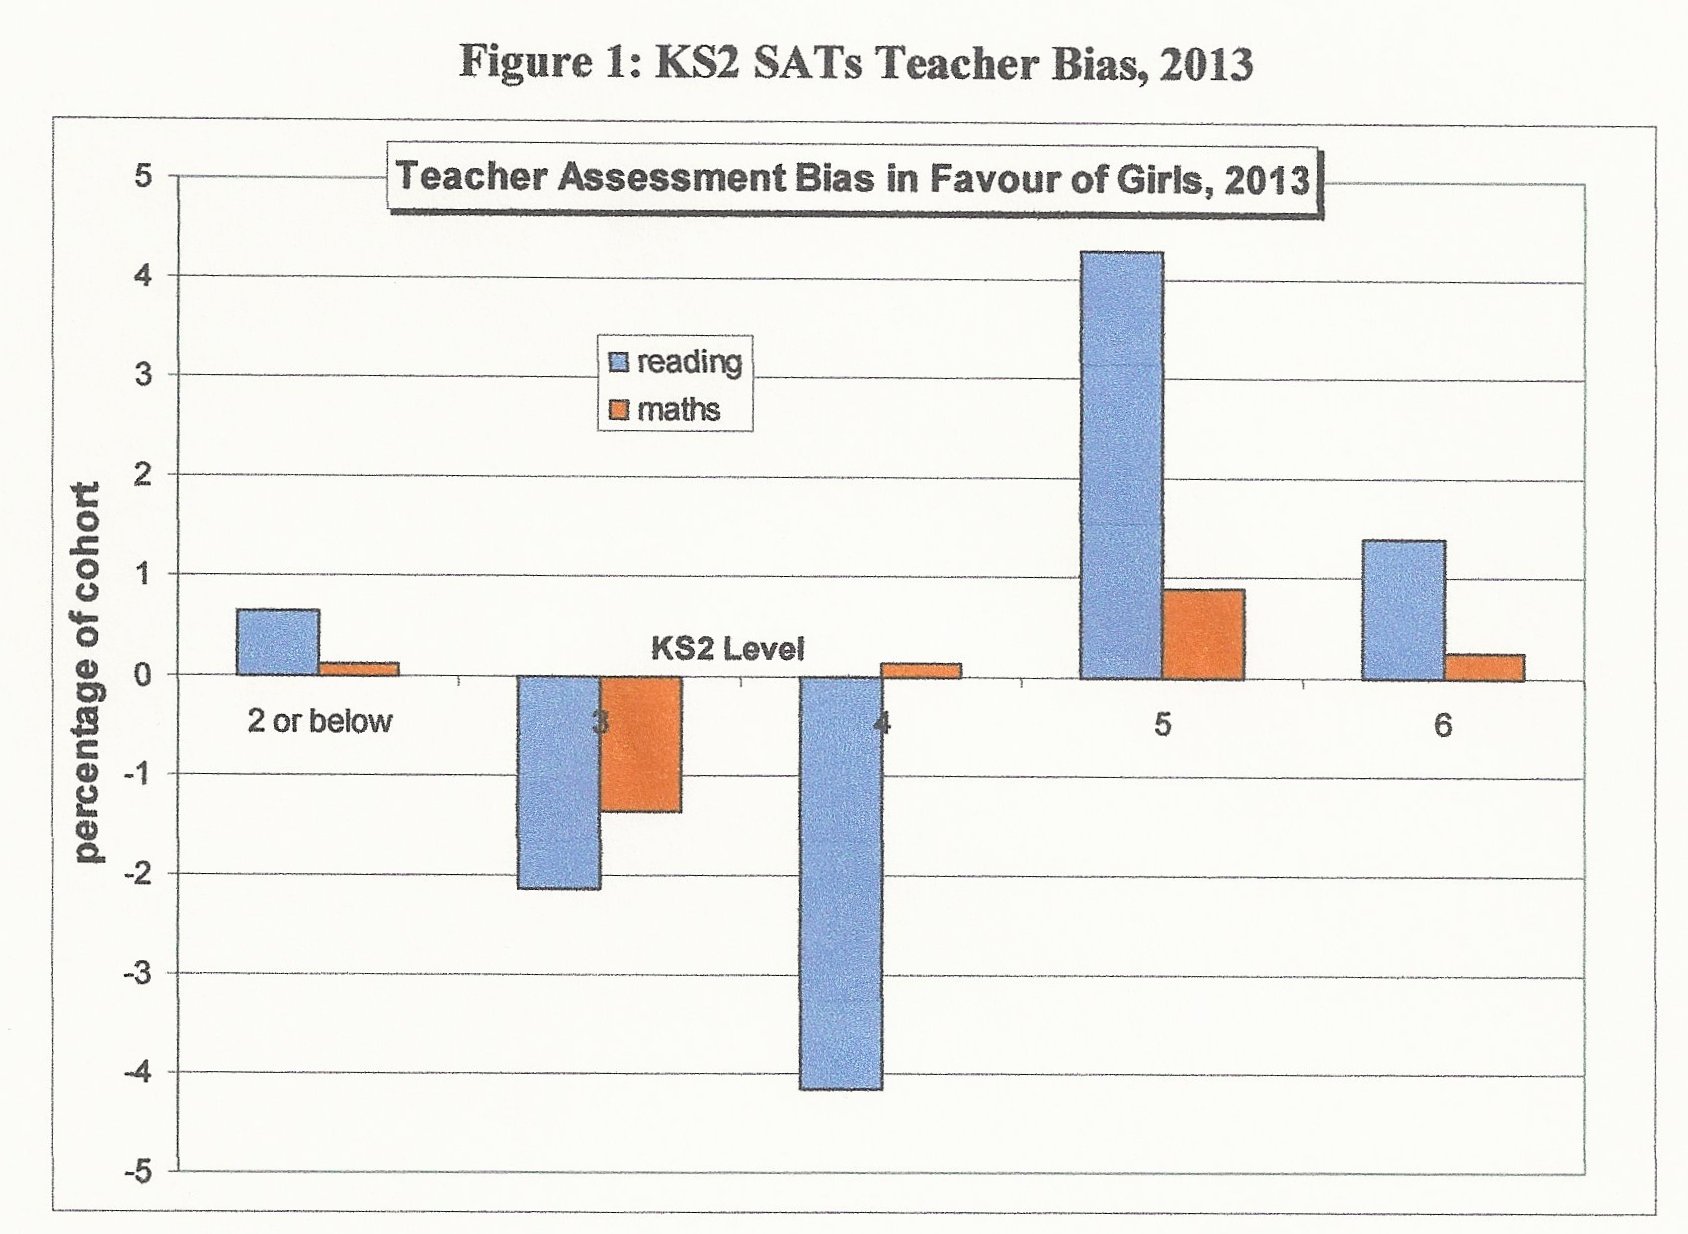
Figure 7

Figure 8