In The Great Covid Domestic Abuse Epidemic That Never Was I reported data for incidents of domestic abuse obtained via FOI from police forces in England and Wales. For most police forces I also obtained offender or suspect data, disaggregated by sex, for calendar years 2018, 2019 and 2020. Here I report the analysis of those data.
I also make some observations regarding offending by, and against, trans people based on a couple of police forces’ data.
The impatient can skip to the Conclusions.
Bear in mind throughout that the data refer to domestic abuse not partner abuse, so, for example, parent-child abuse and child-parent abuse will be included, as will other victim-offender combinations within the home.
Police forces variously referred to “offenders” or “suspects”. Here I draw no distinction and shall use “offender” to mean either/both.
For simplicity of exposition I shall refer to “offenders” and “victims” throughout, but bear in mind that the data relate to incidents, not individuals. Consequently, for example, “number of male offenders” really means “number of incidents involving male offenders”, etc.
There are 42 police forces in England and Wales (excluding City of London). I obtained offender data from 35 forces. However, in four cases the total number of offenders was so small compared with the number of victims (6% to 16%) that I discarded the data from these police forces as too hopelessly incomplete to be indicative. Hence, I have usable offender data for 31 forces.
My earlier post ( The Great Covid Domestic Abuse Epidemic That Never Was) showed that the proportion of reported DV victims who are male has been trending up for ten years, and this trend continued in years 2018 to 2020. The offender data shows that the proportion of offenders who are female has similarly been trending up over the last three years, Table 1.
Across the 31 forces, the proportion of offenders who were female increased from 2019 to 2020 in 84% of forces. That proportion increased from 2018 to 2019 for 71% of forces, and increased monotonically from 2018 to 2019 to 2020 in 61% of forces. The upward trend, though modest, appears to be a genuine trend.
| item | 2018 | 2019 | 2020 |
| % of offenders who were female (a) | 22.4% | 22.6% | 23.5% |
| % of victims who were male (b) | 24.3% | 24.5% | 25.5% |
In fact, the proportion of victims who are male, and the proportion of offenders who are female are very close, within 2%. It should not be concluded from this that virtually all DV is between people of opposite sex. Unfortunately, with one exception, I did not obtain data broken down by the four possible combinations (mm, mf, ff, fm) and it is not mathematically possible to deconvolute these four combinations deterministically for each police force separately. However…
By the magic of statistical analysis, something can be said about the most likely breakdown into combinations mm, mf, ff, fm if a couple of assumptions are made, namely: (i) that the proportion of male offenders who abused males can be taken to be the same across all police forces (ditto for females), and, (ii) these proportions do not vary greatly over years 2018, 2019 and 2020. The analysis is as follows,
Let x be the fraction of male offenders who abused males, and let y be the proportion of female offenders who abused females. I then perform a linear regression of the number of male victims per force, Vm, against the two independent variables Om and Of, which are the number of male and female offenders respectively. The relationship is Vm = x*Om + (1-y)*Of, so the regression provides best-fits to x and y.
There is a problem, though. The number of female victims can also be written in terms of x and y, namely Vf = (1-x)*Om + y*Of. Summing the two equations gives Vm + Vf = Om + Of, i.e., that the total number of victims equals the total number of offenders, as indeed it should be. (Recall that these data are really for incidents, not individuals, so that conclusion is correct because the number of incidents with victims clearly equals the number of incidents with abusers). The problem is that the data does not respect that equality, e.g., because not all complainants’ incidents were matched with offender data. To correct for that, the number of offenders of each sex is scaled by the same factor so that the total equals the number of victims for every force, keeping the male:female ratio unchanged.
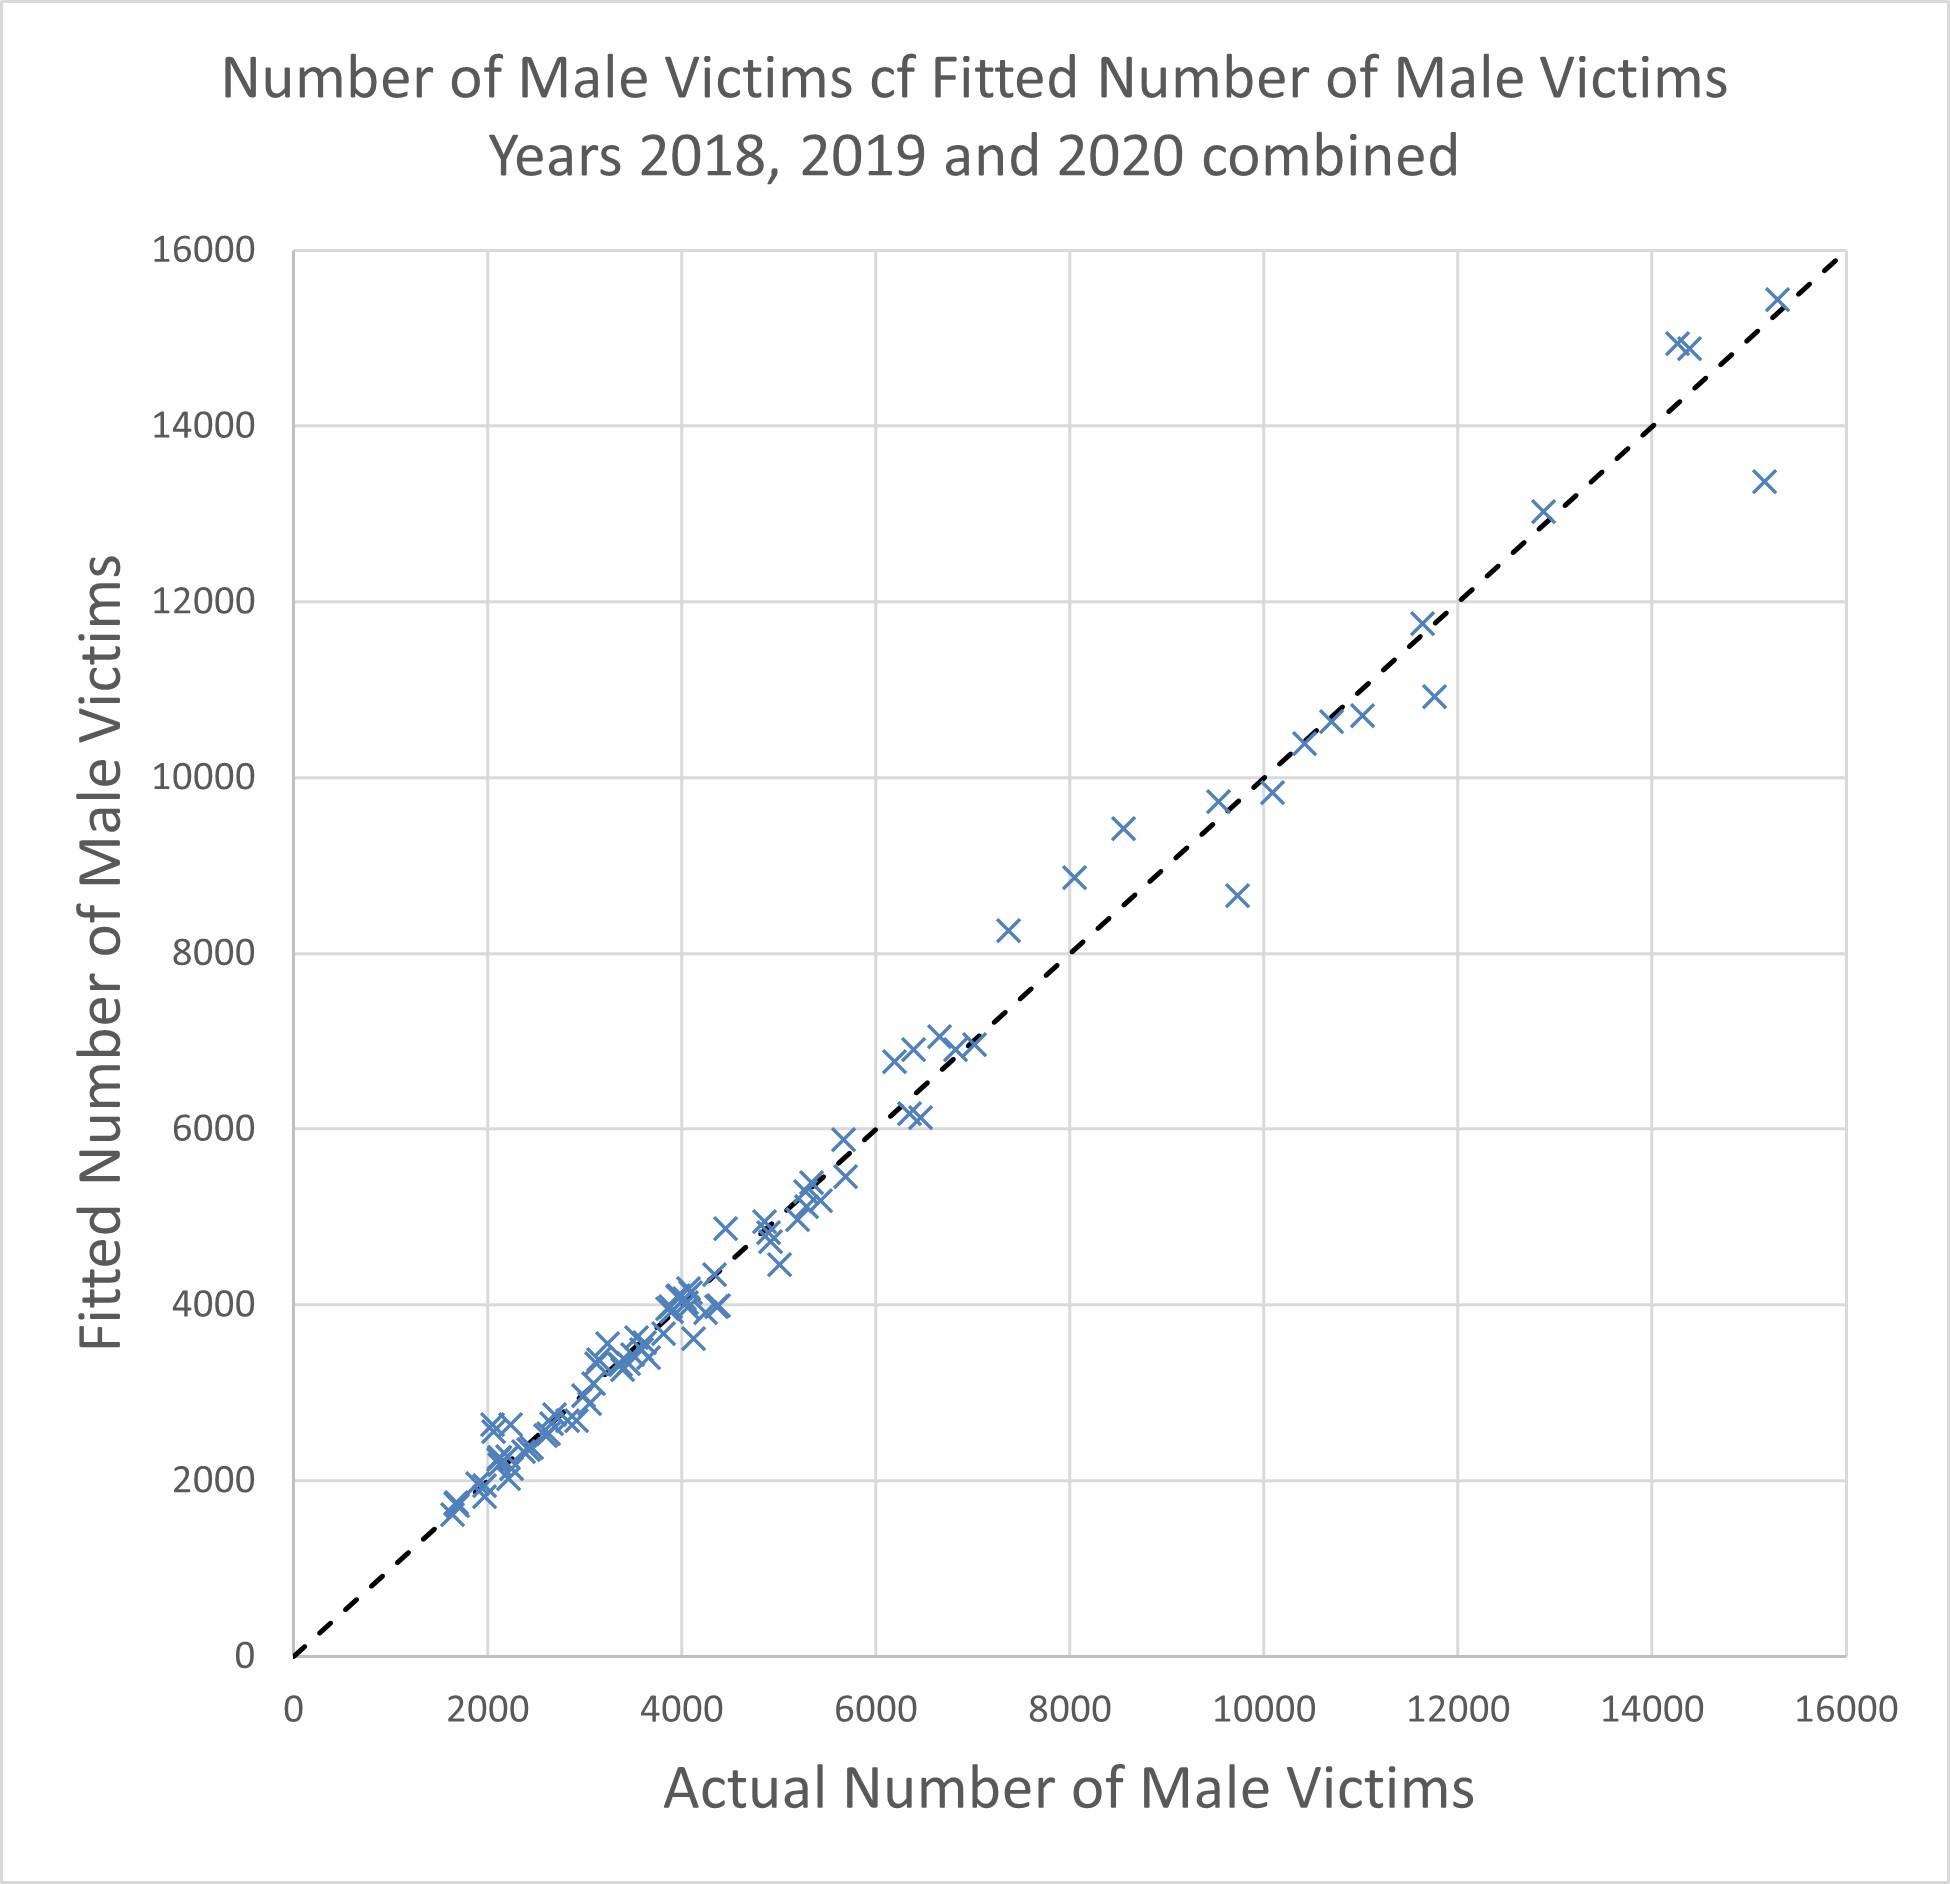
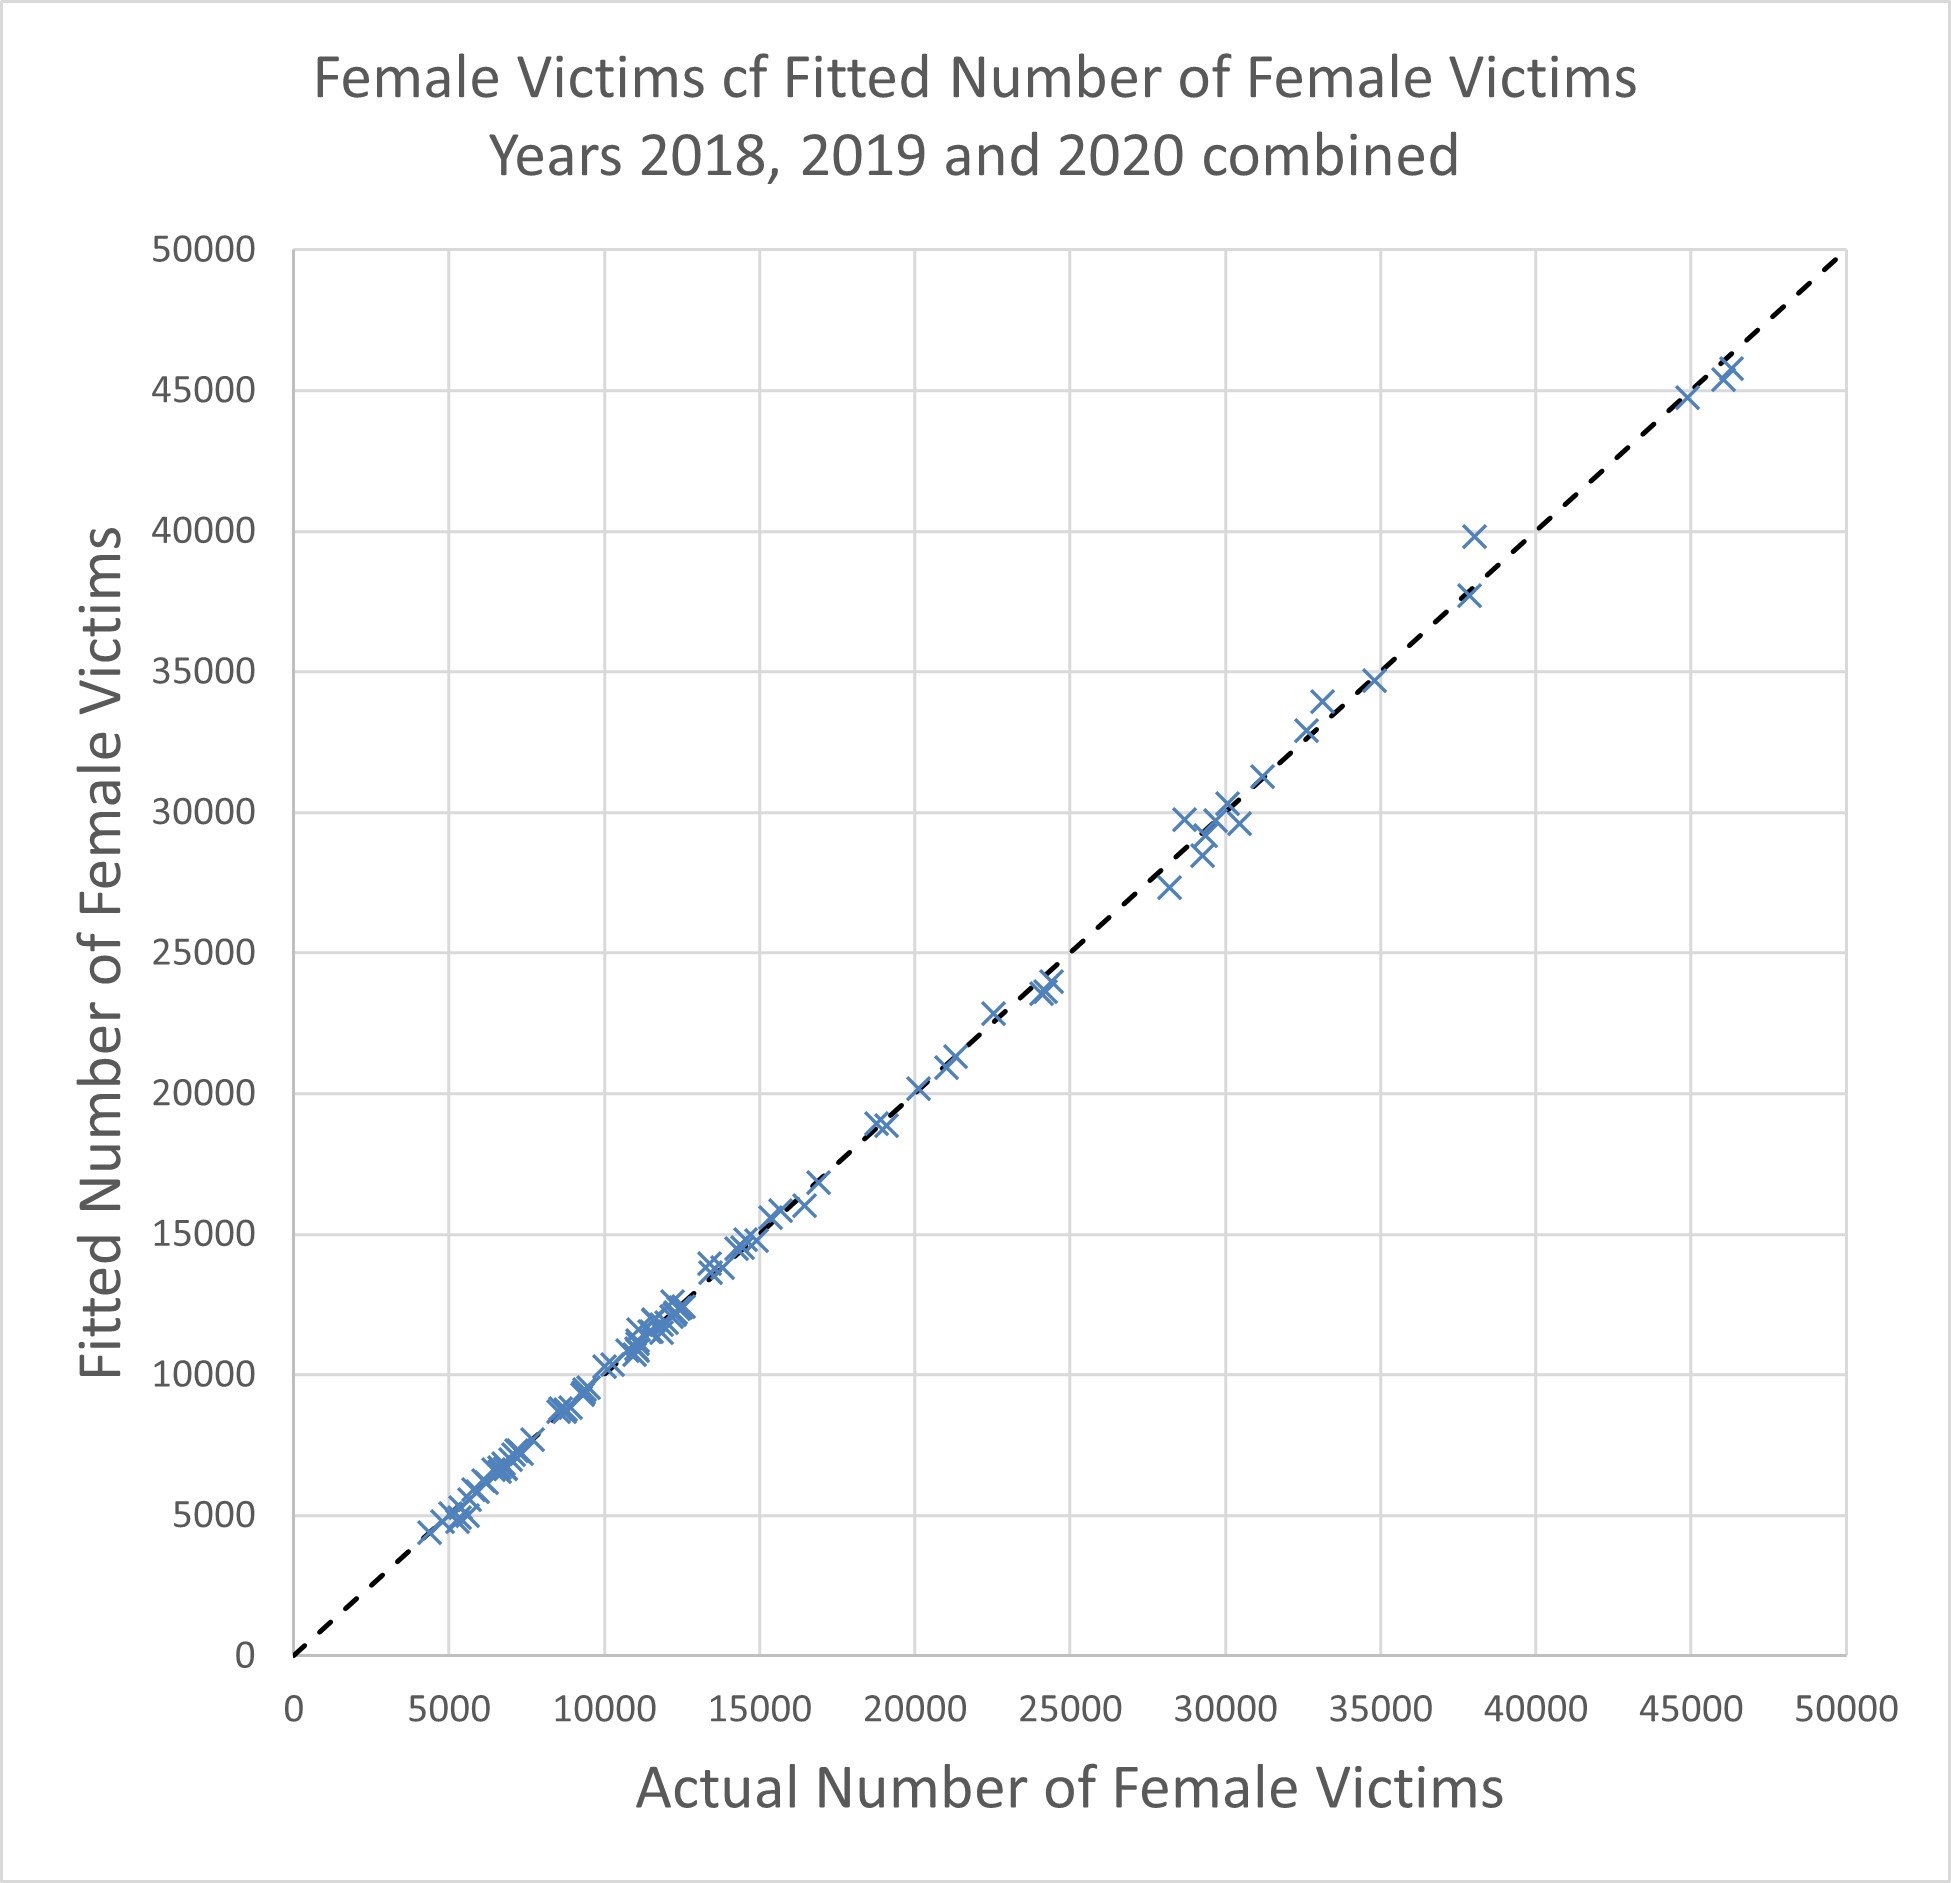
This done it makes no difference if Vm is regressed or Vf is regressed, exactly the same values for x and y result. Summing the data across all three years, 2018, 2019 and 2020, and carrying out the regression gives best estimates x = 0.117 and y = 0.327. Figure 1 compares the actual number of male victims with the value resulting from the regression fit against offender data, that is x*Om + (1-y)*Of. The dashed line is the line of equality. The fit is good. Figure 2 is the equivalent for female victims, the fit being very good.
Actually the quantities x and y are not independent if the quantities a and b, defined in Table 1, are known. Summing all three years’ data, the fraction of offenders who were female was a = 0.229 and the fraction of victims who were male was b = 0.247. The fraction of abused females who were abused by a female (i.e., y) is given in terms of a, b and x as follows,
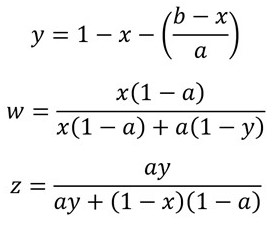
Putting the values for a, b and x into the first of these relations gives y = 0.313, which is very close to the regression result of 0.327, confirming a good degree of self-consistency.
Also given above are the formulae for w, defined as the fraction of male victims who were abused by a male, and z, defined as the fraction of female victims who were abused by a female. Do note that w and z are not the same as x and y. Using the formulae with the above values for a, b, x and y gives w = 0.369 and z = 0.099.
I must emphasise that deducing x, y, w and z in this indirect statistical manner is subject to considerable uncertainty. To check that it seems reasonable I have used data from the one force, namely Surrey police, which provided a detailed breakdown of the gender of victim against the gender of offender. (Yes, I do mean gender, not sex, see below). Summing the data over the three years 2018, 2019 and 2020 the data from Surrey were,
| gender of victim | gender of offender | number of incidents |
| female | female | 1,897 |
| male | male | 2,556 |
| female | male | 18,246 |
| male | female | 4,942 |
The quantities a, b, x, y, w, z specific to Surrey can all be calculated directly from the above breakdown. The comparison between this directly-calculated Surrey data and the estimates derived statistically for the whole dataset covering England and Wales is shown by Table 3. The results are quite close so the Surrey data supports the credibility of the estimates for the whole dataset.
| Quantity | Surrey | Whole Dataset |
| % of offenders who were female, a | 24.7% | 22.9% |
| % of victims who were male, b | 27.1% | 24.7% |
| % of male offenders who abused males, x | 12.3% | 11.7% |
| % of female offenders who abused females, y | 27.7% | 32.7% |
| % of male victims abused by a male, w | 34.1% | 36.9% |
| % of female victims abused by a female, z | 9.4% | 9.9% |
The above results suggest that about 63% of domestic abuse of males is perpetrated by females. But, note carefully the following…
(1) These data relate to all domestic abuse and should not be interpreted as partner abuse. Moreover, the data include children as well as adults. The high proportion of male victims who were abused by other males (36.9%) will, in part, be fathers abusing sons, and vice-versa, and the mothers’ new partner abusing her son, or vice-versa, as well as potentially involving grandfathers.
(2) The other issue to bear in mind is that police data is likely to be biased in favour of recording cases involving female victims and/or male perpetrators. That the percentage of victims who are male (24.7%) is less than CSEW estimates (around 35%) is evidence of this.
I have previously provided data for the four mm, mf, ff, fm combinations, especially in the context of partner abuse, in Domestic Abuse: The Latest Lie. For partner abuse the various estimates of the proportion of male victims who were abused by females was: 95.7%, 91.8%-94%, 83%-87%, 90.7%, 91.4%-94.3% and 95% (average of these sources 91.4%). Mankind Initiative quotes 98% derived from the March 2018 CSEW. However, for all domestic abuse the only figures I obtained for the proportion of males victimised by females were 89% or “at least 76%”. The value of 63% derived here is therefore – unsurprisingly – almost certainly an underestimate.
Finally, I present some data for trans victims and trans perpetrators. Two police forces supplied data (unasked), Sussex and Surrey. Trans male to female data have been included in the above analyses under “female gender”, whilst trans female to male data have been included under “male gender”. The Home Secretary, Priti Patel, has recently instructed the police not to record as “female” biological males identifying as the female gender. Personally I think that only biological sex should be used – not only for crime recording, but for everything – such as exam results, for example. However, it was noteworthy that Patel was only concerned about biological male offenders identifying as female, not the reverse. Biological women, of course, can do no wrong, even when they identify as male – according to the TERF credo. So what do the data say?
Table 4 gives the numbers of victims and offenders for both male-to-female and female-to-male trans, for both Sussex and Surrey – and the sum of the two. The data relate to the sum of incidents over the three years 2018, 2019 and 2020.
| County | Gender Change | Victims | Offenders |
| Sussex | male to female | 21 | 38 |
| Sussex | female to male | 13 | 24 |
| Surrey | male to female | 1 | 7 |
| Surrey | female to male | 11 | 25 |
| Sum | male to female | 22 | 45 |
| Sum | female to male | 14 | 49 |
The statistics in Table 4 are too small to permit any strong conclusion. However, they do serve to illustrate that the Home Secretary’s selective focus on perpetration only by the male to female variety of trans is misplaced. In this (admittedly very small) dataset, it is female to male trans who commit the larger number of offences.
The other thing to note is that it appears that trans, of either variety, are more likely to be offenders than offended against (again with the proviso of having very few data).
Which gender do trans offenders abuse? Data for this was obtained only for Surrey and is summarised in Table 5.
| Gender of Victim | male-to-female offender | female-to-male offender |
| male | 2 | 4 |
| female | 4 | 21 |
| female-to-male trans | 1 | 0 |
Again I must stress that one cannot really conclude anything from such small statistics. But it is interesting that, for the one county for which I have data, the trans abusers of females are overwhelmingly of the female-to-male variety, not the reverse. The Home Secretary should take note. Actually, this is not surprising, for two reasons.
Firstly, many people believe that a large number of trans are, in truth, homosexual. If so, and a large proportion of female-to-male trans are actually lesbians, then the high rate of offending against other females is in line with what is known, i.e., that lesbian relationships are significantly more abusive than heterosexual or gay male relationships. The second possible reason is that female-to-male trans may be taking testosterone. The naive equation of testosterone with violence is false (see the first chapter of this book, or this one). However, anyone who has a suddenly increased level of testosterone, externally administered, elevating their testosterone well above the level to which they are accustomed, will indeed be prone to increased aggression.
Finally, who are the abusers of trans people? Again I have data only for Surrey. These are shown in Table 6.
| Gender of Offender | male-to-female trans victim | female-to-male trans victim |
| male | 0 | 2 |
| female | 1 | 8 |
| male-to-female trans | 0 | 1 |
Again, the statistics are far too small to draw any conclusion – except to motivate getting more data. Nevertheless it is interesting that, for Surrey at least, the trans who are being victimised are almost all female-to-male, and the gender (indeed, the sex) abusing them is predominantly female. This is consistent with the data on trans as perpetrators, i.e., it is the combination of females with female-to-male trans which seems to have the largest incidence of abuse involving trans people. This is likely to be for the reasons already enunciated above.
Conclusions
Police recorded domestic abuse incident data in England and Wales imply that,
(1) The proportion of victims that are male is increasing (25.5% in 2020) and the proportion of offenders who are female is increasing (23.5% in 2020).
(2) Although disaggregated data was not obtained, statistical estimates of the victim-offender pairing prevalences have been made as follows, noting that these relate to all domestic abuse and all ages (not just partner abuse),
- 11.7% of male offenders offend against another male;
- 32.7% of female offenders offend against another female;
- 36.9% of male victims were victimised by another male;
- 9.9% of female victims were victimised by another female.
(3) The above results, derived from police recorded incidents, probably do not faithfully represent actual prevalences, but will be biased towards female victims and male offenders.
NB: For partner abuse alone, the proportion of male victims who are victimised by a female is certainly greater than 90%, perhaps in the high-90s of percent.
(4) Some interesting results were obtained from two counties on trans people as victims and perpetrators of domestic abuse. Statistics are too small for firm conclusions, but suggest that the popular (and political) narrative which concentrates on male-to-female trans as the chief culprits may be misguided. The suggestion from sparse data is that the combination of a female and a female-to-male trans is the combination involving a trans person where domestic abuse is most prevalent (whichever is the victim). This requires confirmation with a larger dataset.