One can say very little about valid educational attainment based on the A Level awards in the last three years, 2020, 2021 and 2022. However, important observations can be made about political interference and sex bias.
In 2020 and 2021 there were no exams.
In 2020 the awards were, bluntly but honestly stated, essentially just made up by teachers. Having got away that year with massive grade inflation – and sex bias – in 2021 both the inflation and the sex bias were worse.
The one good thing about this debacle is that it has provided statistically unambiguous evidence of teachers’ bias by sex.
The grade inflation has been widely reported in the press. The sex bias, needless to say, has not.
The Department for Education, responding to allegations by the former head of UCAS, Mary Curnock Cook, has claimed that any evidence of systemic bias against boys was ruled out by an analysis by Ofqual. This is factually incorrect, as I demonstrated in this article. The Ofqual analysis does identify the bias, but expresses it in such an anodyne and technical manner that the casual reader would not notice. The Ofqual report plots the key results using a graphical scale so small that the 4.36% bias identified becomes invisible to the naked eye. This is an embarrassingly crude burying of an important result. My conclusion was then, and remains,
“There is more to honesty than merely never being untruthful. Here’s an example of a honest depiction of what has happened: the excess of top A/A* grades awarded to girls over boys (in 2021) has nearly tripled since the last exam year, 2019.”
In 2022 exams returned, but do not assume that means a return to fairness. There was always going to be a problem returning to the grade percentages of 2019. Ofqual have therefore opted to attempt to do so only by 2023. In contrast, in 2022 grade boundaries have been set at “a mid-point between 2019 and 2021”. Exactly what this means is not clear to me, though – as we shall see – the results speak for themselves. It’s all very well to refer to this as “grading more generously”, but that completely misses the fact that this generosity is biased by sex – and hence, in competitive university entry, it means reduced chances for young men.
Ask yourself, what is the “mid-point” between fair and grossly unfair?
Data here are taken from Brian Stubbs’ Student Performance Analysis. I give the raw data in graphical form below, plotting against year from 2010 to 2022. This puts the last three years in proper perspective. One needs no sophisticated statistical analysis to demonstrate that the last three years have been utter nonsense – this is immediately apparent from the graphs.
I show data here for “all subjects”. Based on past experience I expect individual subjects to be qualitatively similar.
There are two data points plotted for 2020. The first (lower) of these is the provisional award with an algorithm applied, the second (higher) is the final award based on the unadjusted teachers’ assessments. The use of the algorithm sensibly put the results close to the 2019 data, and was obviously needed to counter the teachers’ grade inflation. Nevertheless, a purely political storm led to these initial awards being withdrawn in favour of the teachers’ unadjusted assessments, complete with inflation and bias.
Readers will see that the use of the “mid-point” approach this year, 2022, has led to award statistics which also lie roughly at the mid-point between 2019 and 2021. Not surprisingly, then, as sex bias is still implicit within this prescription, boys have fallen back on every metric compared with girls when the basis of comparison is 2019 – the last year there was no manipulation of the grading.
A subterfuge which is used frequently in the press is to compare the awards to boys and girls in percentage terms. This misses the key point, which is that far more girls take A Levels. This year, 81,124 (21%) more A Levels were awarded to girls than boys, and 70,908 (31%) more top grades (A*, A, B) were awarded to girls than boys.
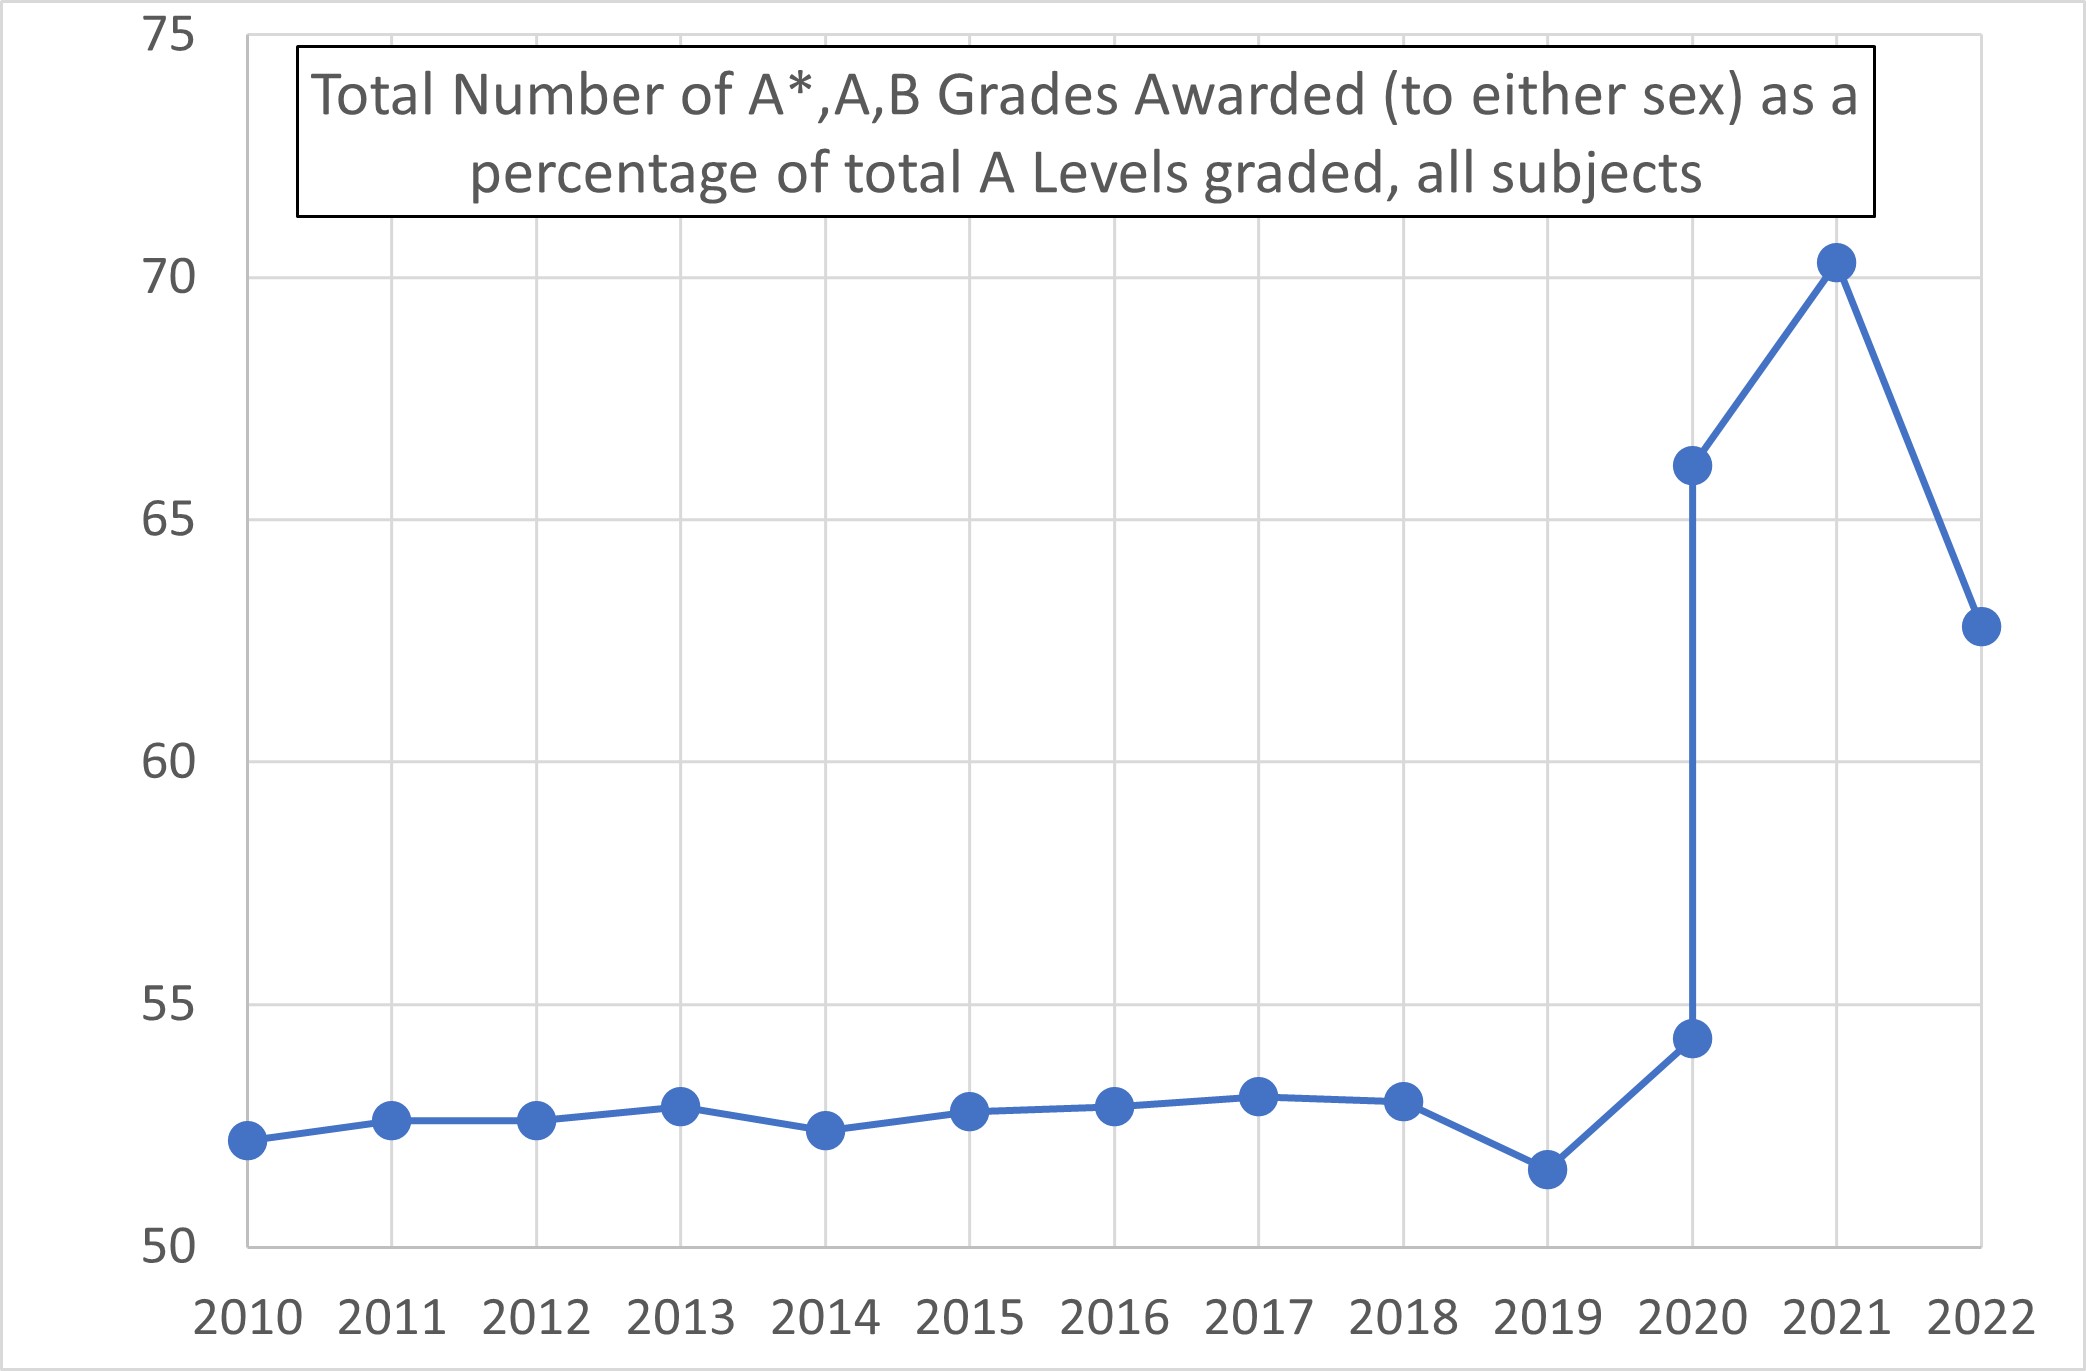
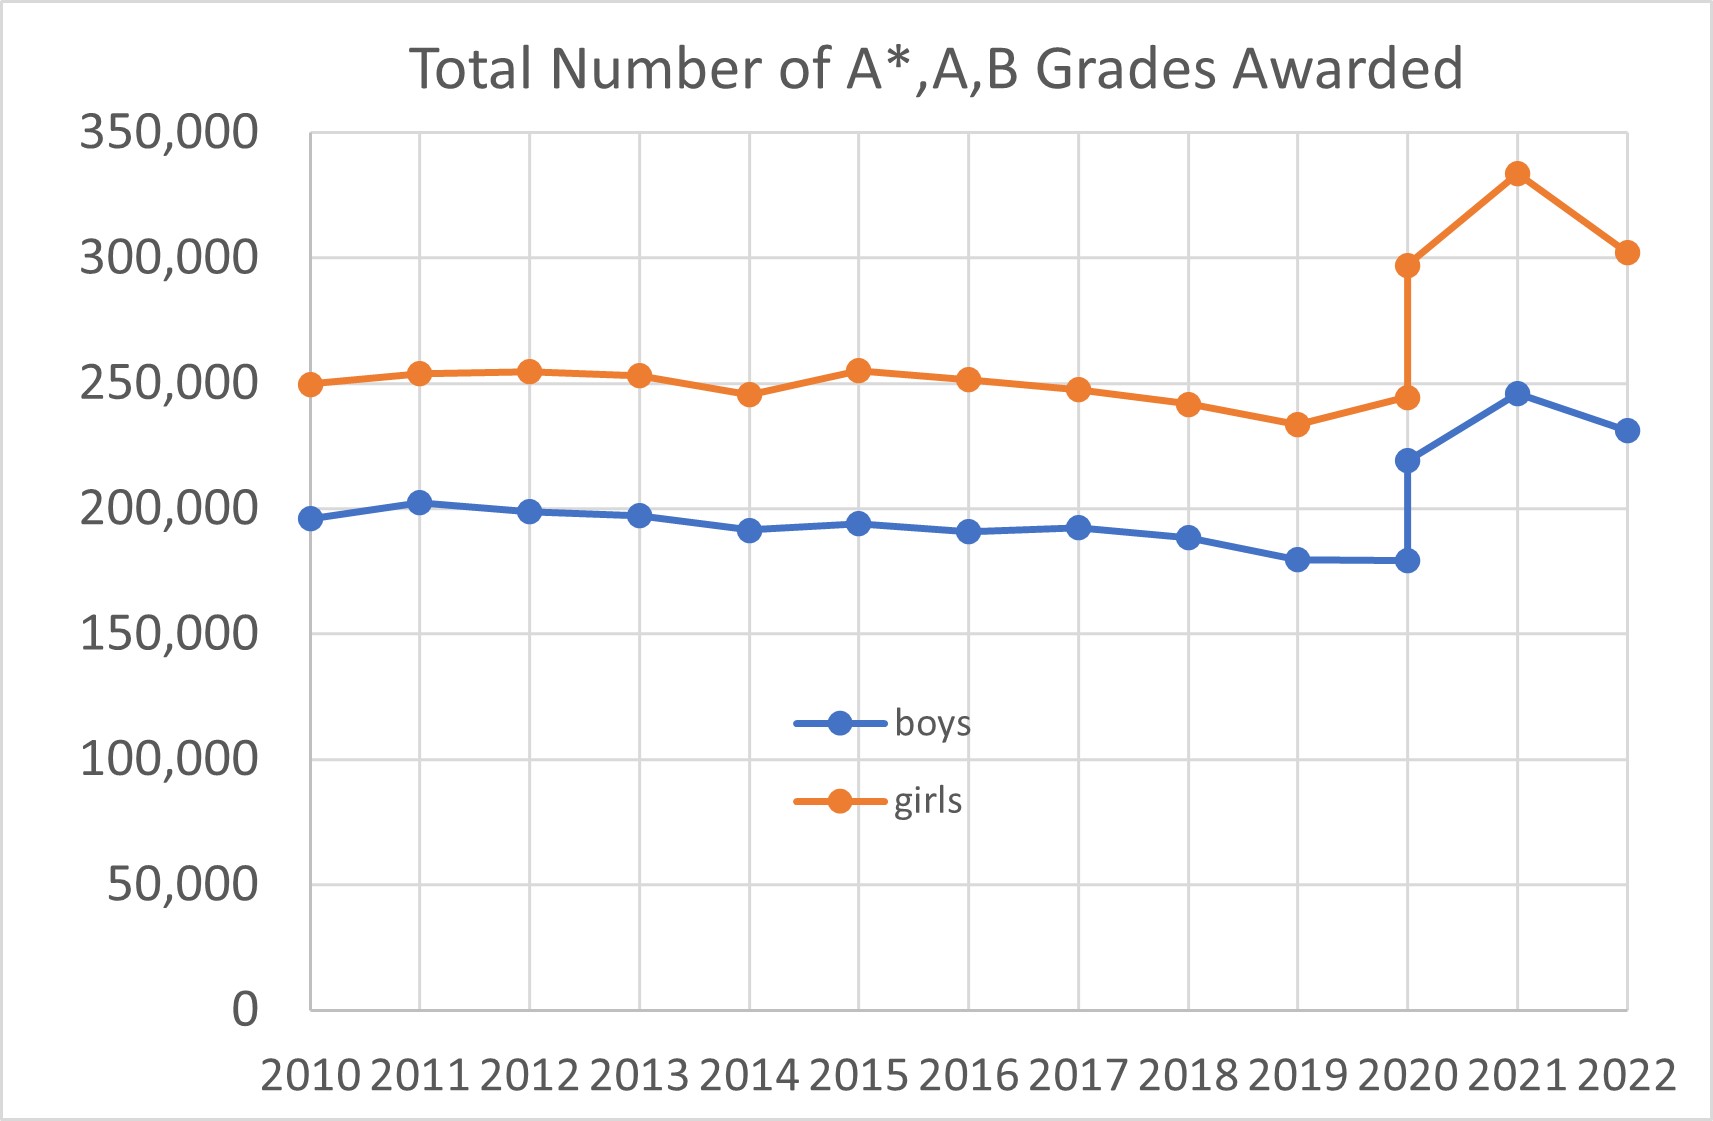
Figures 1 and 2 show the inflation in the top grades, A*, A, B.
Figure 3 shows the sex bias in top grade awards (A*, A, B). Up to 2019 there were between 50,000 and 60,000 more top grades awarded to girls than to boys. In the last three years this has leapt to between 70,908 (this year) and 88,000 (2021, based on teachers’ assessments).
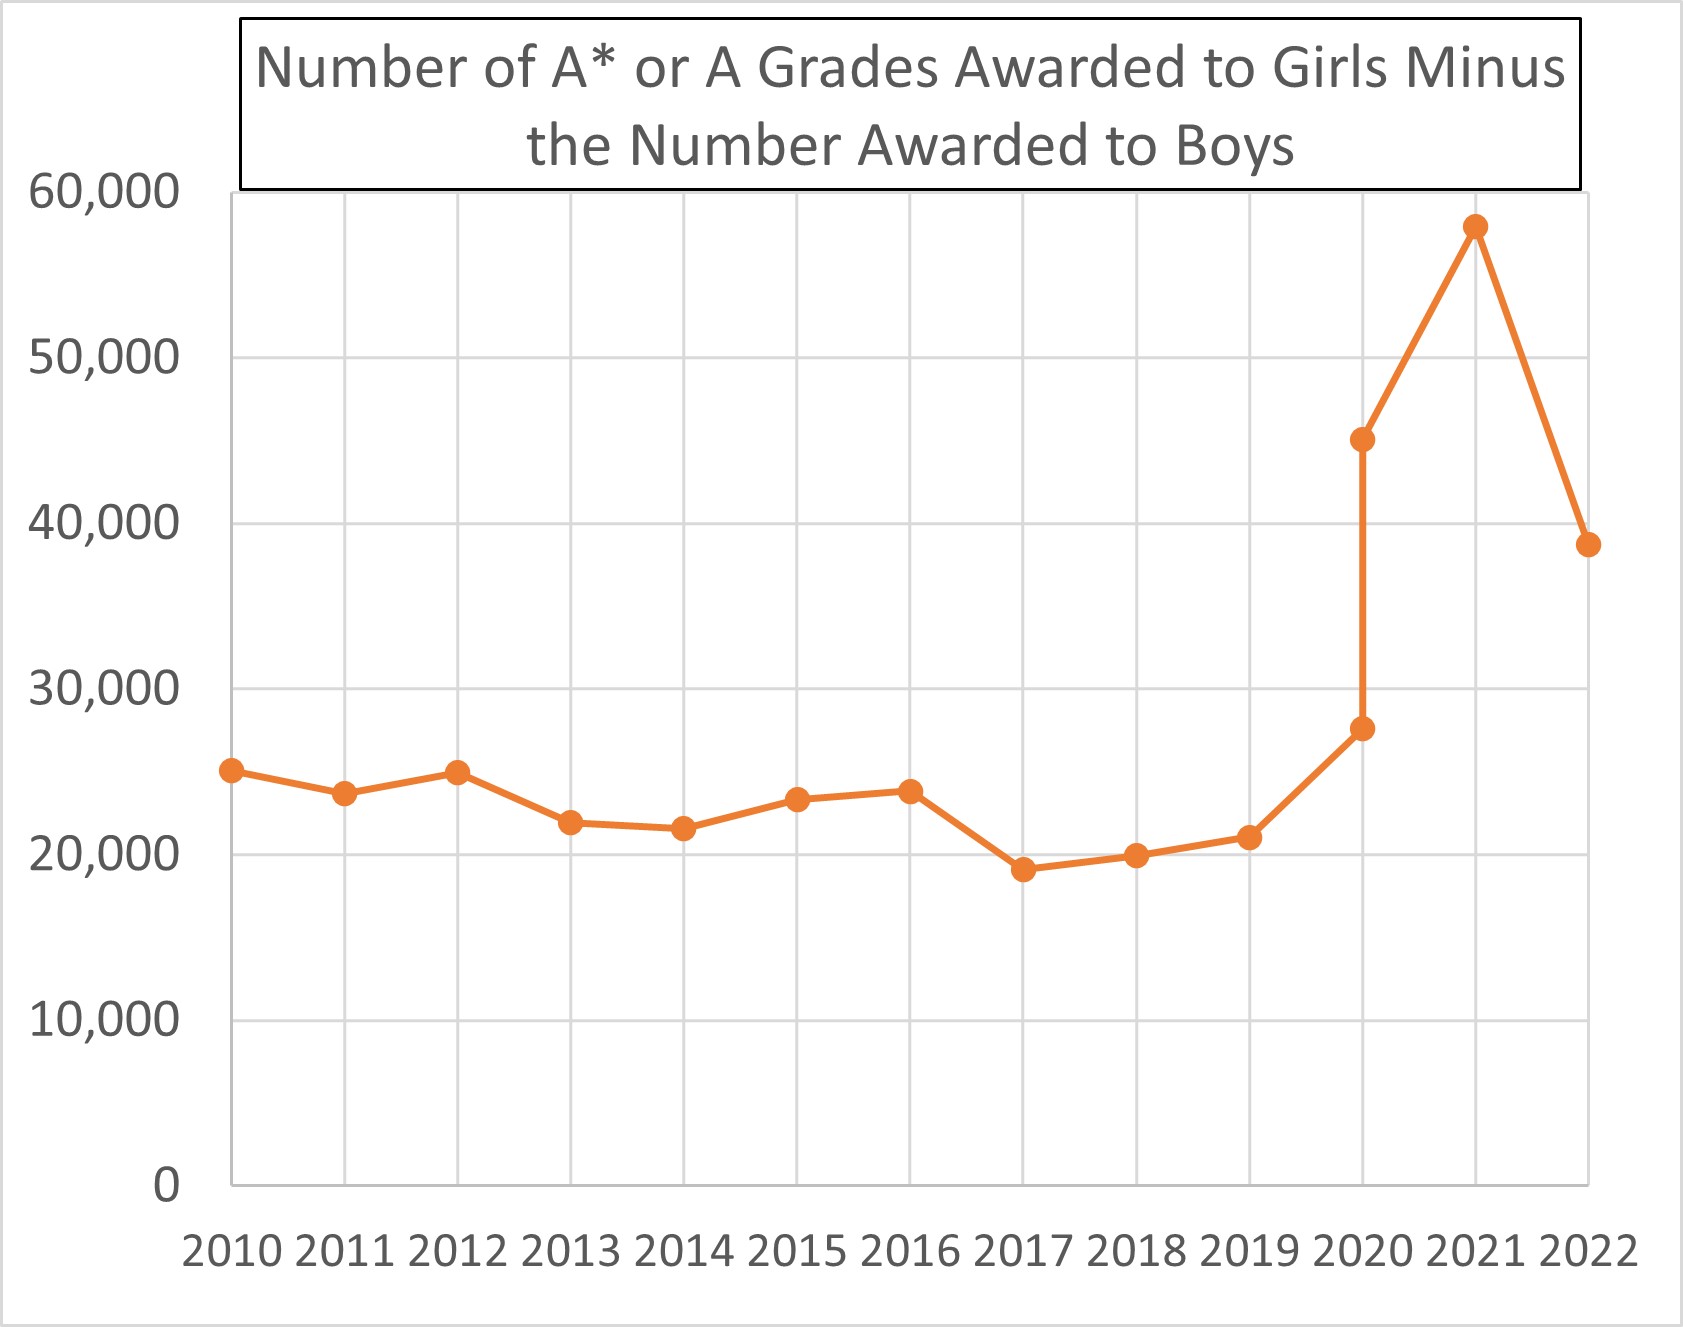
Figure 4 plots the number of A* plus A grades awarded to girls minus the number awarded to boys. This is the metric in which the sex bias in 2020 and 2021 is greatest, being nearly three times greater in 2021 based on teachers’ assessments than in 2019 based on exams. Given the importance of these top grades in gaining entry to the best universities, an excess of nearly 40,000 A*/A grades in girls favour is highly significant – and yet the Department for Education pretends this does not exist. They are a disgrace.
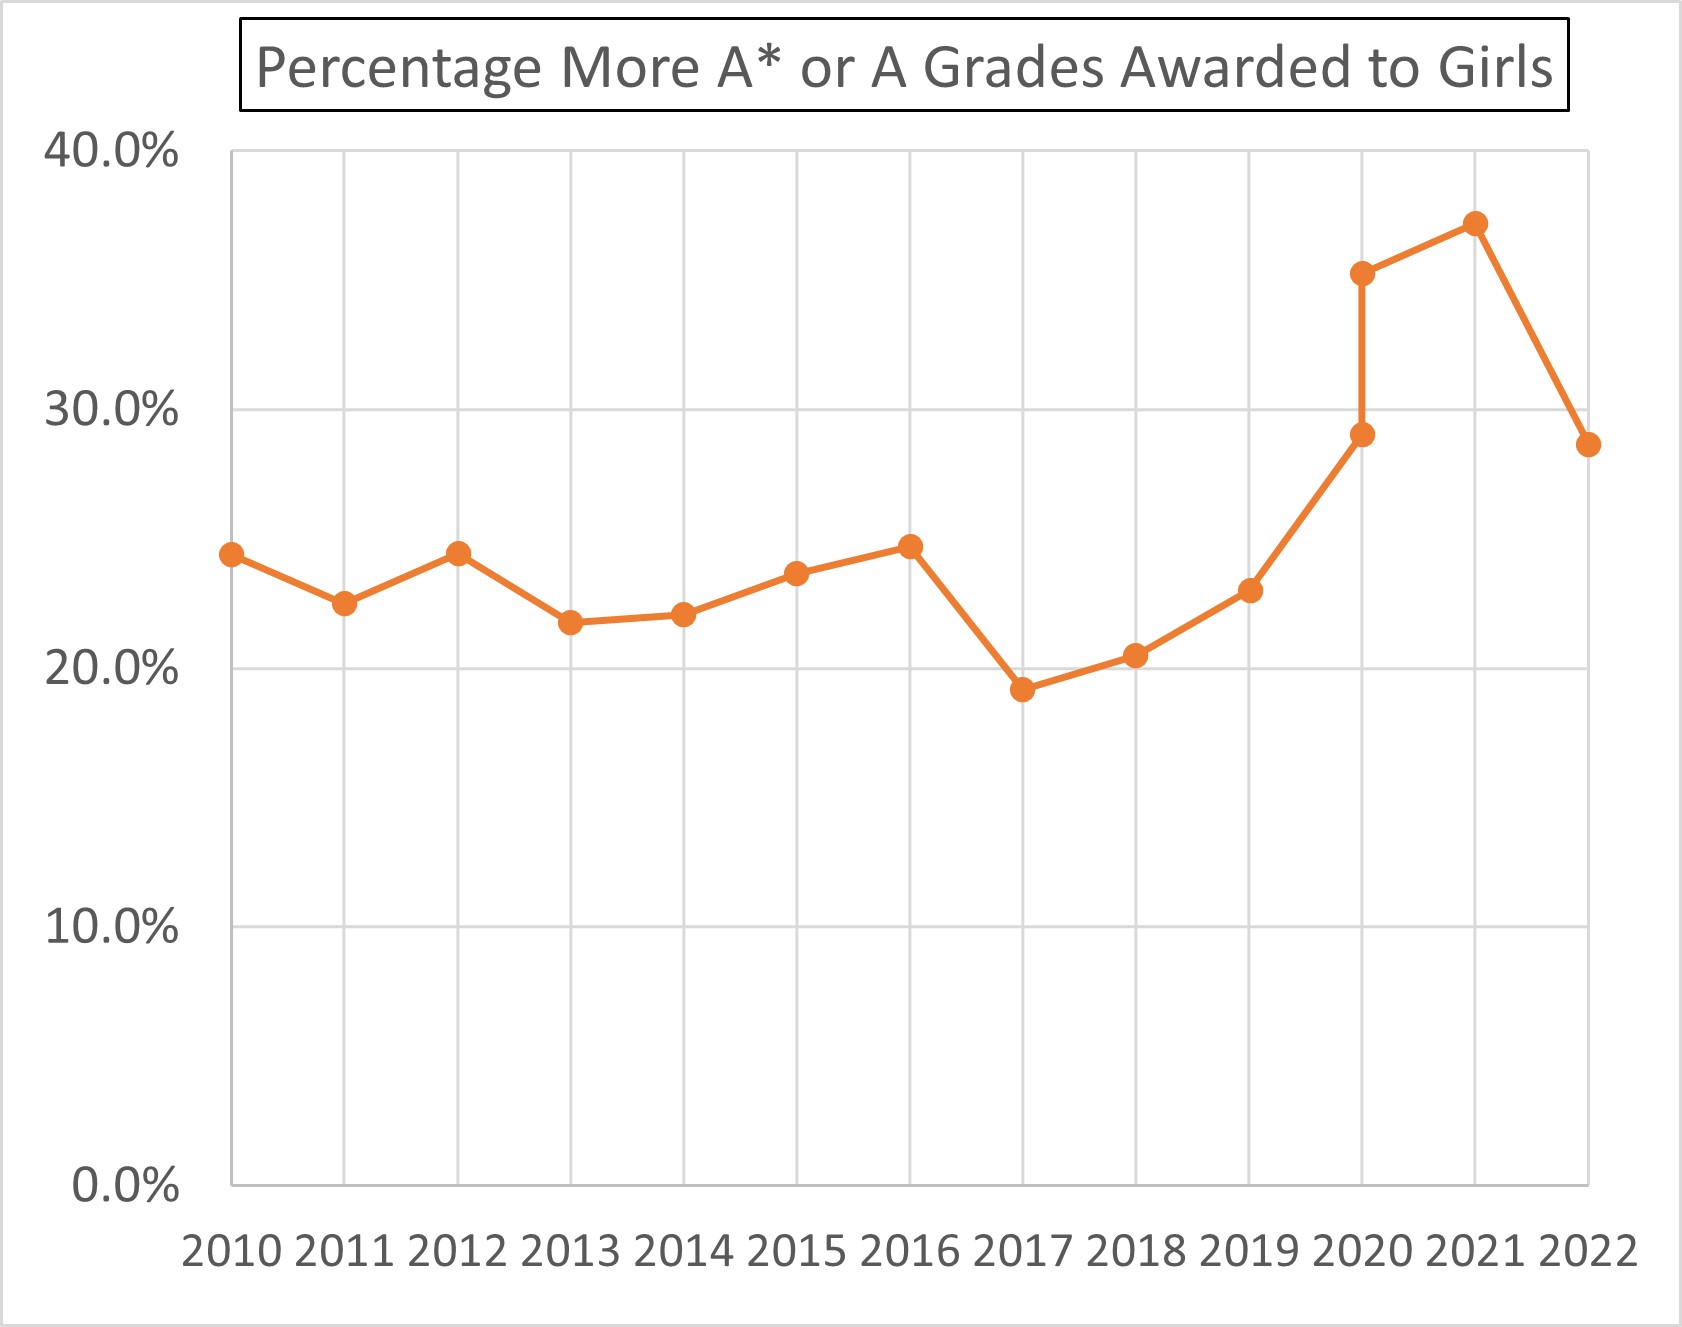
Figure 5 is the same metric as Figure 4 expressed in percentage terms.
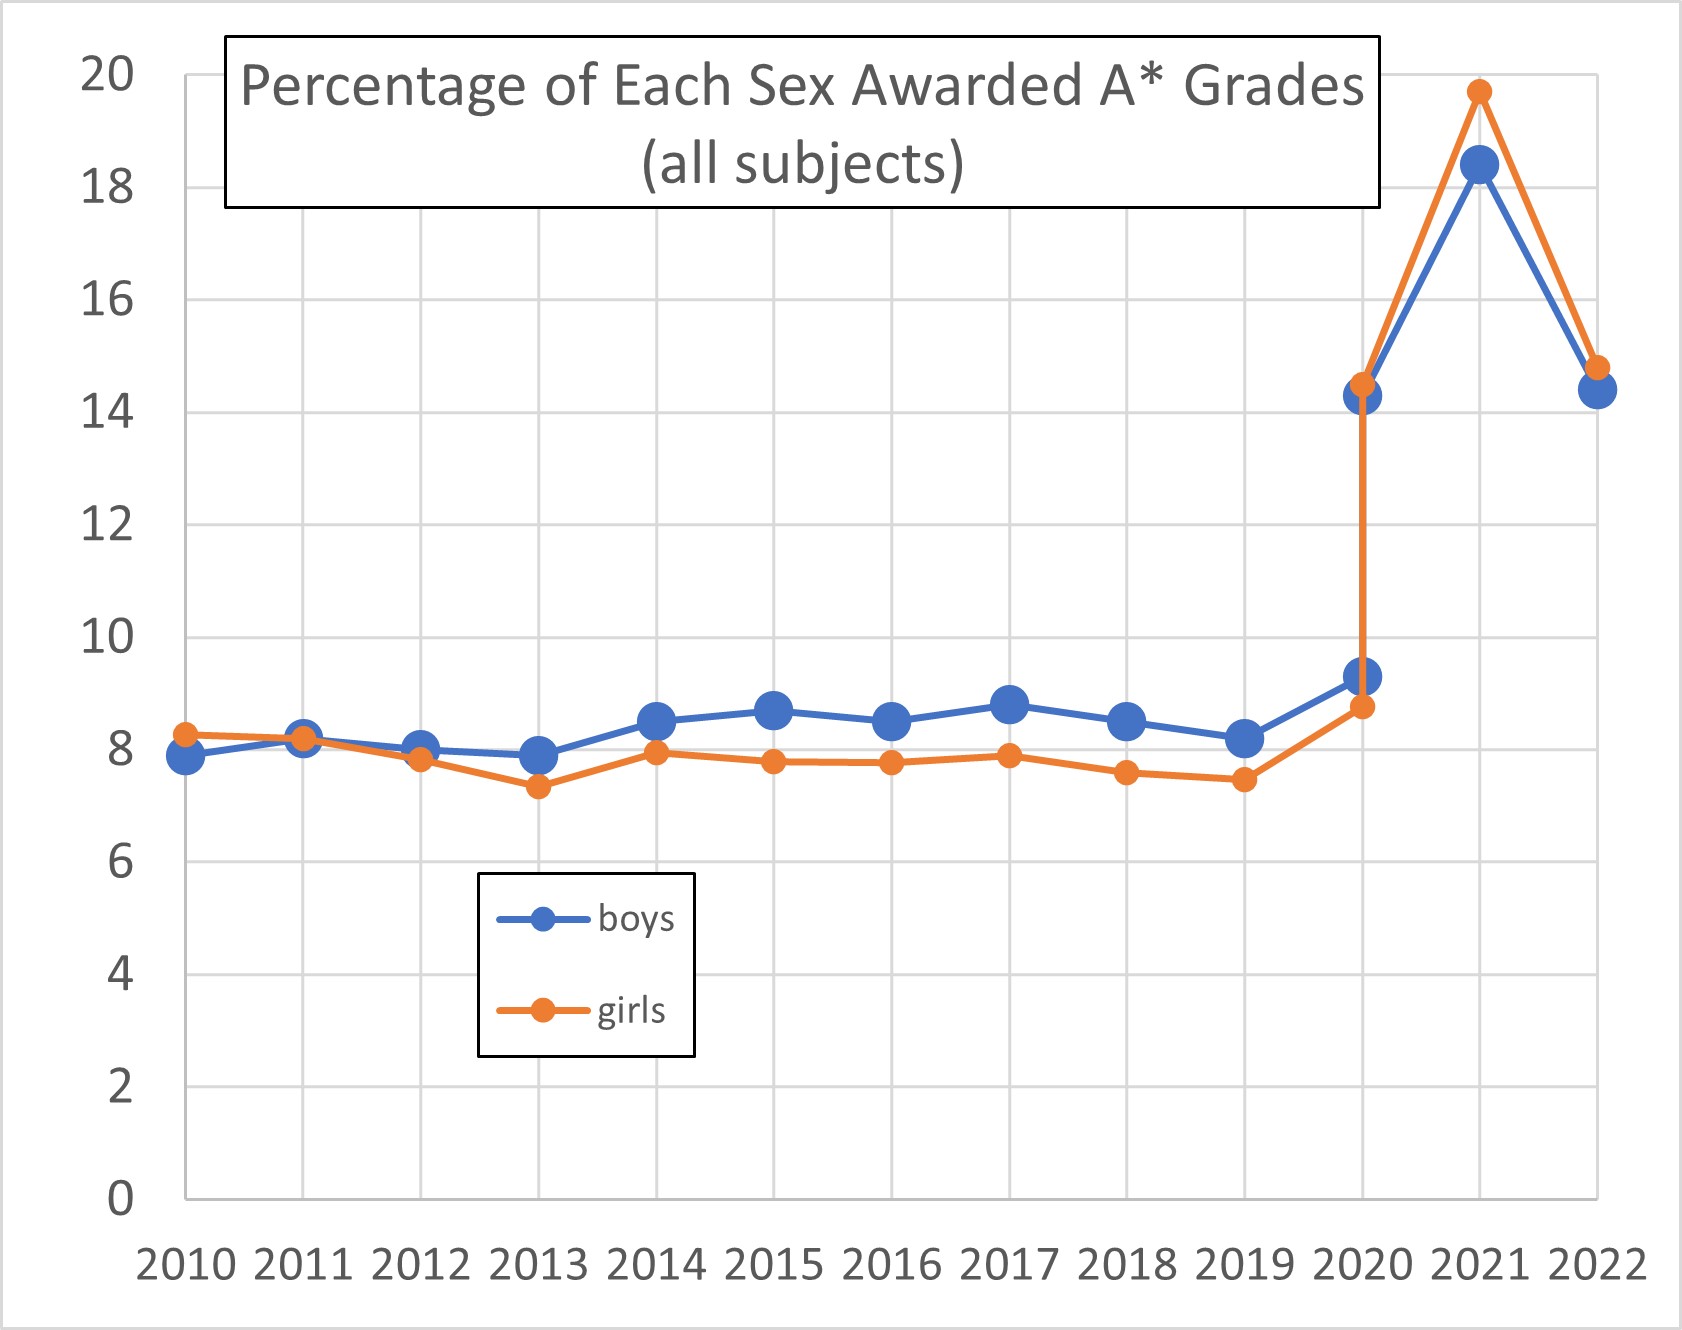
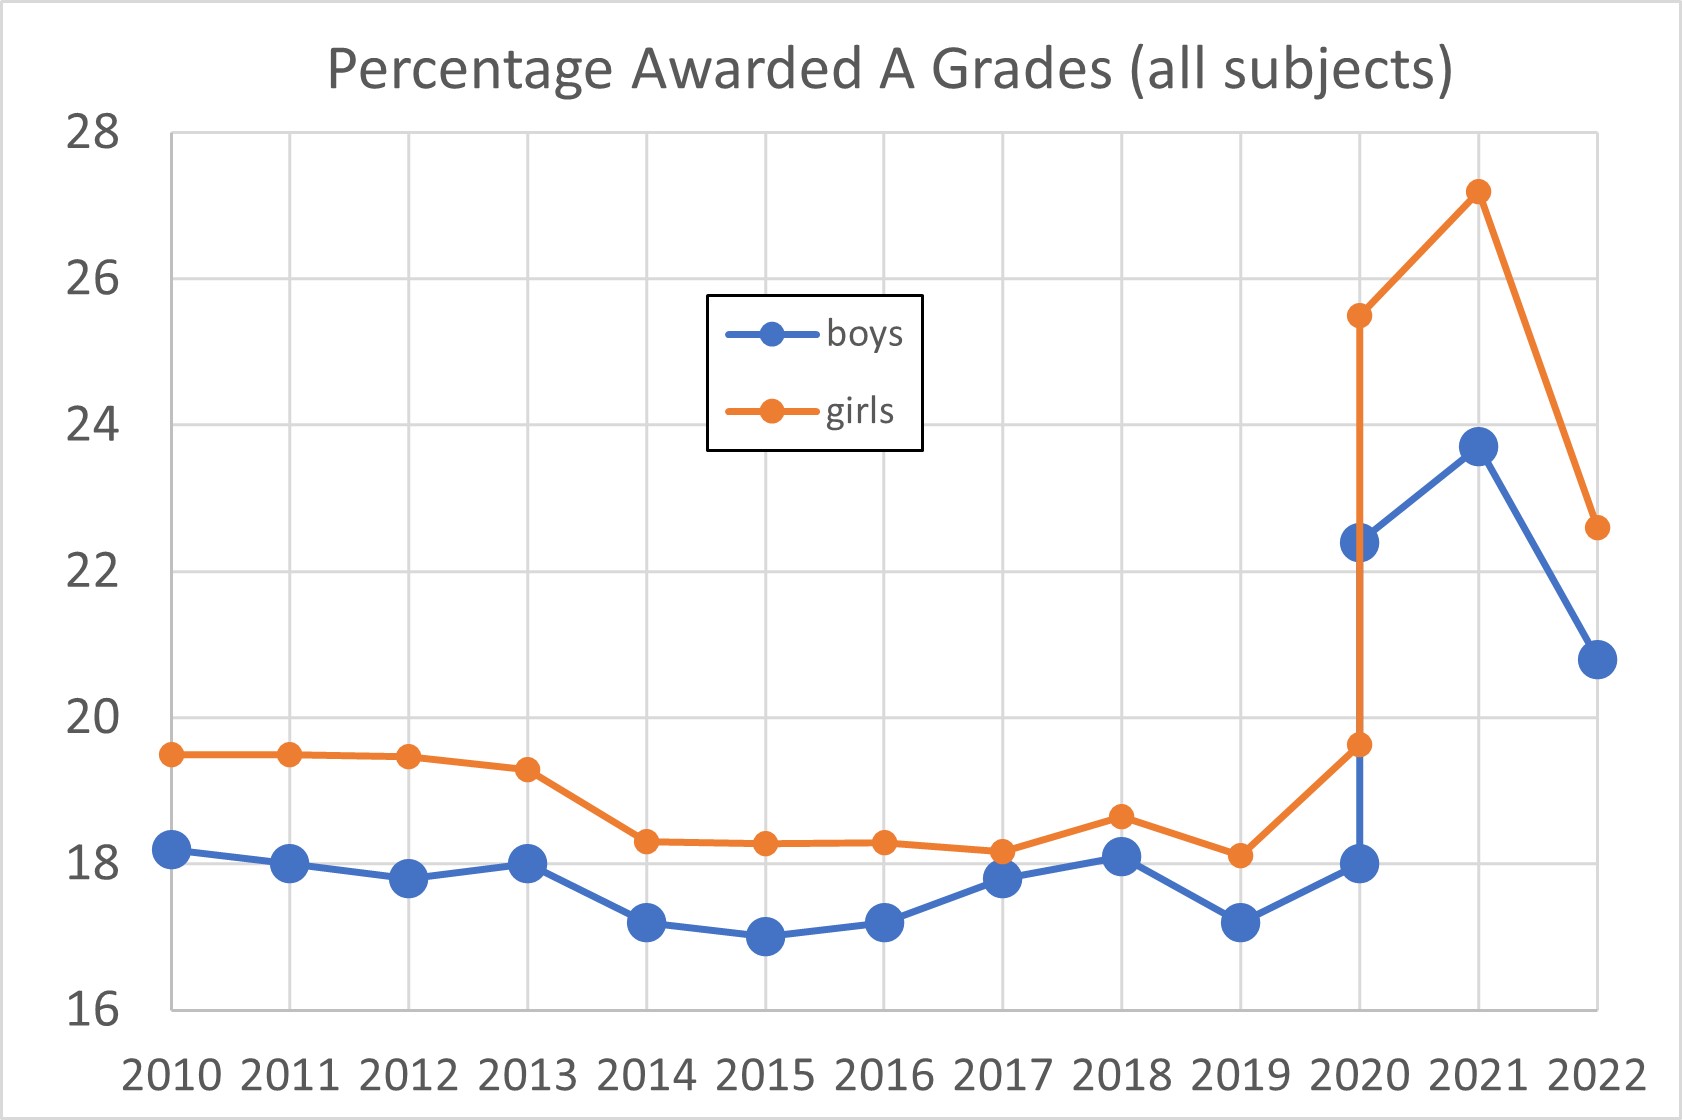
Figure 6 and 7 show the grade inflation in grades A* and A separately. These graphs also show the sex bias, as grades were inflated for both sexes but clearly more so for girls.
Figures 8 and 9 are as Figures 4 and 5 but in terms of the percentages of the same sex being graded. Figure 8 is the only statistic relating to the top grades in which boys apparently outperformed girls previously, namely the percentage gaining grade A*. But the last three years has reversed this. In any case this statistic disguises the more important issue that there are substantially fewer boys taking A Levels or gaining any grade of award.
Conclusion: The poorer A Level awards to boys compared with girls, which have been worsening for decades, has been further exacerbated by basing these awards on teachers’ assessments in 2020 and 2021, and this bias has persisted in 2022 probably due to the use of the “2019-2021 mid-point” grade boundaries. As a result boys have faired comparatively less well in 2022 than in the last exam year, 2019. The Department for Education steadfastly refuses to acknowledge that there is bias inherent in these recent awards despite the matter being statistically unambiguous.