
Proportion of men ever married against age; trend over time (click to enlarge)
I have not previously posted any pieces on marriage, divorce, families, children, and child custody. This is not because I don’t consider these issues to be important, but the opposite. I have been rather frightened to approach them. By way of an initial foray, I present here a data tsunami of UK statistics on marriage as a precursor to further pieces on households, families, divorce, children, and child custody (when I have the strength). To avoid drowning in the tsunami proceed straight to the conclusions.
The data refer to England and Wales unless otherwise stated.
Terminology: The term “single” is used here to denote someone who has never been married (or in a civil partnership) and is at least 16 years old. The term “unmarried” is used to denote someone aged 16 or older who is either single or divorced or widowed.
Table 1 gives the number of single and unmarried people in England & Wales in 2012. These data have been deconvoluted from Tables 2a and 3 of the ONS Marriage summary statistics 2012. The calculation deriving these figures is here.
In 2012 there were 1,069,702 more single men than single women, but there were 1,184,171 more unmarried women than unmarried men. This stark difference is accounted for primarily by men’s shorter life expectancy, leading to far larger numbers of widows than widowers – thus increasing the number of unmarried women compared with unmarried men.
It is interesting that there are over a million more never-married men than never-married women, despite there being nearly a million fewer males in the population.
Table 1: Number of single and unmarried people in England & Wales in 2012
| People over 16 years | Men | Women |
| Single | 8,765,487 | 7,695,785 |
| Unmarried | 11,303,448 | 12,487,619 |
Marriage Rates
Figure 1 shows the marriage rate against year from 1862 to 2012. In this Figure the marriage rate has been defined as the number of marriages in the year per 1000 people of the same sex who are unmarried (and hence over 16 years old). The curves for men and women are surprisingly different, given that the actual number of men and women getting married was precisely the same prior to same-sex marriage. The curves differ only because the number of unmarried men is smaller than the number of unmarried women. The curves were particularly far apart in the past due to the high marriages rates – meaning that relatively few people were unmarried.
[An example illustrates this effect: Consider 100 people, 49 men and 51 women. There are thus ~4% more women than men, i.e., 100 x (51 – 49) / 49. But if 90% are married, i.e., 45 men and 45 women are married, then there are only 4 unmarried men and 6 unmarried women. There are thus 100 x (6 – 4) / 4 = 50% more unmarried women. The slight imbalance in the initial population becomes a marked imbalance in the unmarried population if most people are married].
Figure 1: Marriage rates per 1000 unmarried men or women Data taken from ONS Marriage summary statistics 2012
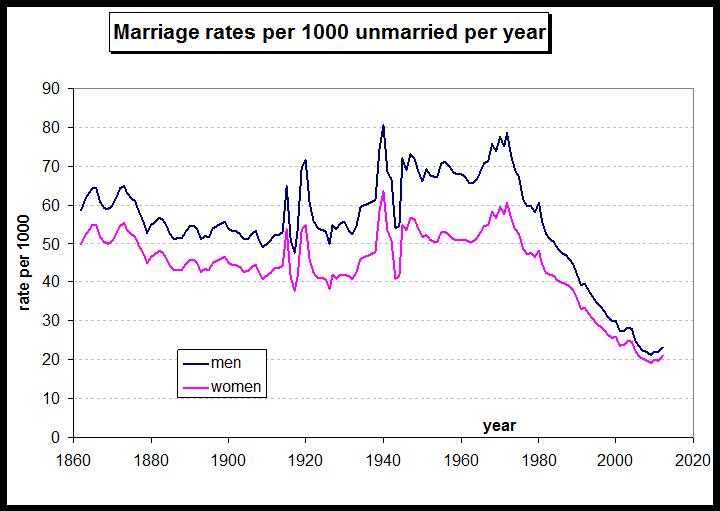
There was a dramatic fall in marriage rates after 1972. By 2012 the marriage rate had fallen to a mere one-third or one-quarter of its 1972 level. However, this Figure rather exaggerates the decreasing popularity of marriage. This is because this definition of marriage rate is 1000M/U, where M is the number of marriages in the year and U is the number of unmarried people of the required sex. This exaggerates the decreasing popularity of marriage because it measures not only the reduction in the absolute number of marriages, M, but also the increase in the number of unmarried people, U. This might be regarded as fair, but in truth the increase in the unmarried population is partly due to people opting to marry later, rather than not at all (as we will see below).
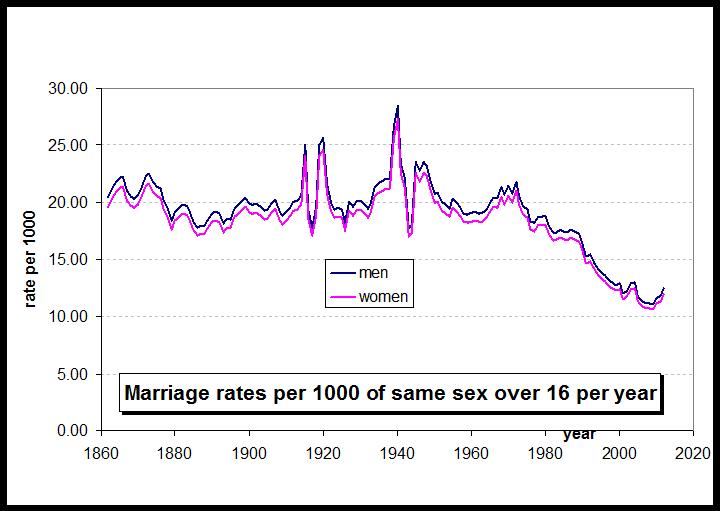
On the other hand it would be pointless to plot the absolute number of marriages, M, because the total population of England & Wales has changed so much over the above time period (namely from ~20 million in 1862 to just over 53 million in 2012). Figure 2 plots an alternative marriage rate, defined as 1000M/T, where T is the total population aged 16 and over for the sex in question, whether married or not.
Figure 2 confirms that there has been a real decrease in the popularity of marriage since 1972. The marriage rate in 2012 based on this definition was about half that in 1972 – rather than one-quarter to one-third as implied by Figure 1. Take your pick as to which you regard as more indicative.
The slight up-turn in marriage rates after 2008 might be due to the increasing influence of ethnic minorities with traditional behaviours (but I’m guessing).
Figure 2: Marriage rates per 1000 men or women over 16 (total population) Data from ONS Marriage summary statistics 2012 and population data from here
Perhaps the best indication of the declining popularity of marriage is to ask what proportion of people eventually get married, perhaps when older, and perhaps only temporarily. Figure 3 shows the proportion of men who have ever been married versus their age, and compares the results for men born in years 1940, 1950, 1960, 1970 and 1980. Figure 4 is the same plot for women, but every ten years from 1900. The results are not yet complete for birth year 1980 because a substantial number will yet marry. Even for birth year 1970 this is strictly true but to a much lesser extent. Nevertheless, the trend is absolutely clear in Figures 3 and 4.
In 1940 some 92% of men eventually married. Figures 1 and 2 suggest this was probably true back as far as the early Victorian era, at least (and the data in Table 2 of ONS Cohabitation and Cohort Analyses confirm this as far back as 1900). For women born between 1900 and 1960, between 85% and 95% eventually married.
For men the declining popularity of marriage is evident by birth year 1960, and increasingly so thereafter. For women the decline in marriage is evident from birth year 1970 onwards. Extrapolating Figure 3 by eye suggests that, of the cohort of men born in 1980, perhaps about 55% will eventually marry. For women Figure 4 suggests about 60% of the 1980 birth year cohort will eventually marry. This cohort attained its peak marrying age just as the marriage rate reached its lowest level to-date. The longer term prognosis is unclear. If marriage rates have bottomed-out, as Figures 1 and 2 might suggest, then the long term prognosis might be for about half the population to eventually marry. It is not clear (as yet, at least) that marriage is declining towards extinction, as some have suggested.
Figure 3: Proportion of men ever married against age; trend over time Taken from ONS Cohabitation and Cohort Analyses

Figure 4: Proportion of women ever married against age; trend over time The curves are labelled with the birth year. Data taken from ONS Cohabitation and Cohort Analyses Table 2

Age at Marriage
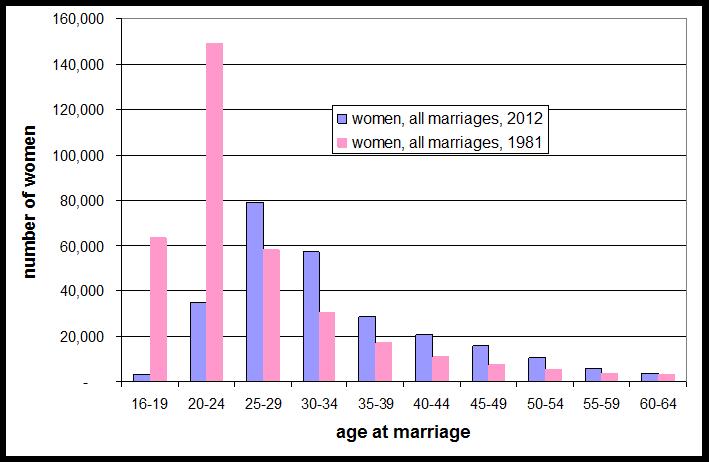
In addition to the declining popularity of marriage overall, a very marked feature of the changing pattern of marriage is the trend to marry later. Figures 5a to 5d illustrate this by comparing the histograms of age at marriage for years 1981 and 2012. (The Figures are respectively for: men at first marriage; women at first marriage; men counting first and subsequent marriages; women counting first and subsequent marriages). The data is from ONS Marriage summary statistics 2012.
In 1981 by far the most common age to marry was in the range 20 to 24. For women the second most common was to marry in their teens. By 2012 dramatically fewer people marry below the age of 25. In 1981 the median age at first marriage was 22.0 for women and 24.1 for men. By 2012 these had increased to 29.1 and 31.0 respectively. Including re-marriages, the mean age at marriage in 2012 was 36.5 years for men and 34.0 years for women. The trend for people to marry in their 30s has implications for fertility. This is widely appreciated in the context of women. It is perhaps less widely appreciated that male fertility also declines.
Figure 5a
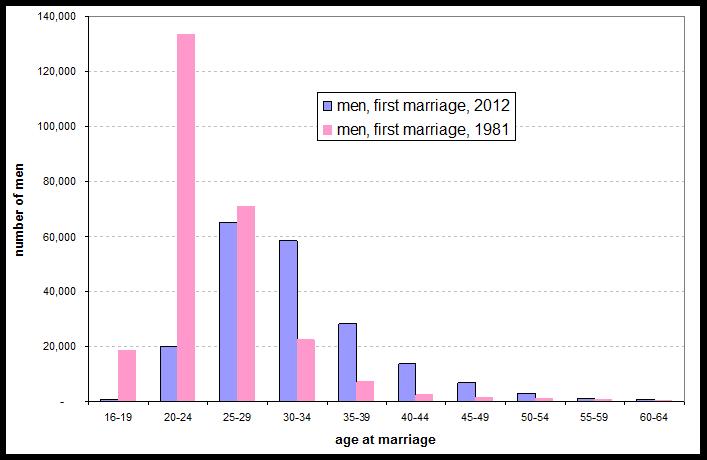
Figure 5b
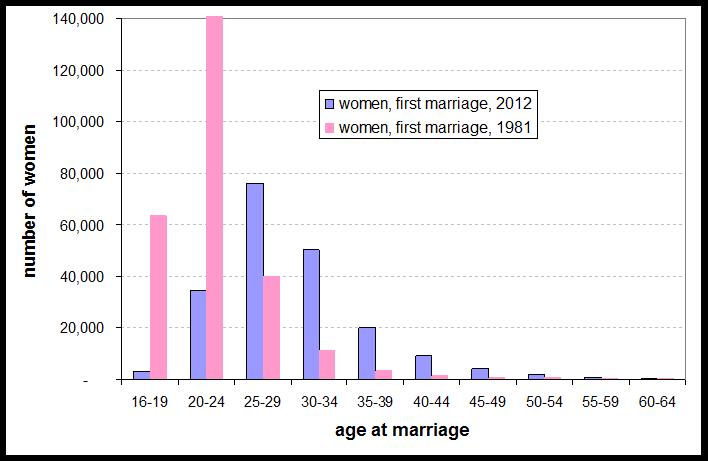
Figure 5c
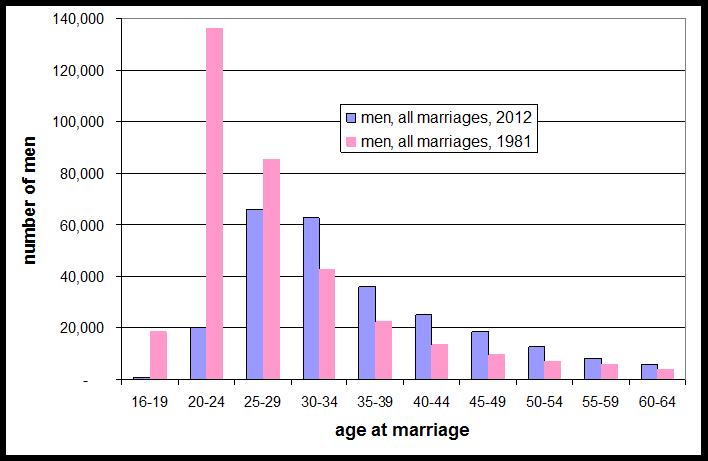
Figure 5d
First Marriages versus Subsequent Marriages
Table 2 shows the number of marriages involving single and previously married people, the latter including both divorcees and widows/widowers. Data for 2012 are compared with those for 1981 in brackets. In 2012, 67% of marriages were between men and women neither of whom had been married previously (up from 65% in 1981).
Table 2: First marriages compared with re-marriages: 2012 (1981 in brackets) Data from ONS Marriage summary statistics 2012
| Women, first marriage | Women, re-marriage | |
| Men, first marriage | 175,040 (227,713) | 23,060 (31,393) |
| Men, re-marriage | 25,820 (35,655) | 38,320 (57,212) |
Marital Status of Whole Population in 2014
Data in this section are taken from ONS Population Estimates by Marital Status and Living Arrangements: England and Wales, 2002 to 2014
For people aged 16 and over,
- Married 51.2%
- Single 33.9%
- Divorced 8.2%
- Widowed 6.5%
- Civil partnership 0.2%
Note that the percentages of the population ever divorced or ever widowed will be larger than indicated above since some people in these categories will have subsequently re-married and hence be currently counted in the married category.
The distribution of these total percentages over age is shown in Figure 6. In the 60 – 70 age range roughly 70% of people are married at present.
The change between 2002 and 2014 in the percentages married, single, divorced and widowed are shown in Figures 7a and 7b.
Figure 7a suggests that the proportion of people over 15 who are married may have bottomed-out at ~51%.
Figure 6: Percentages of population in various marital categories (2014).
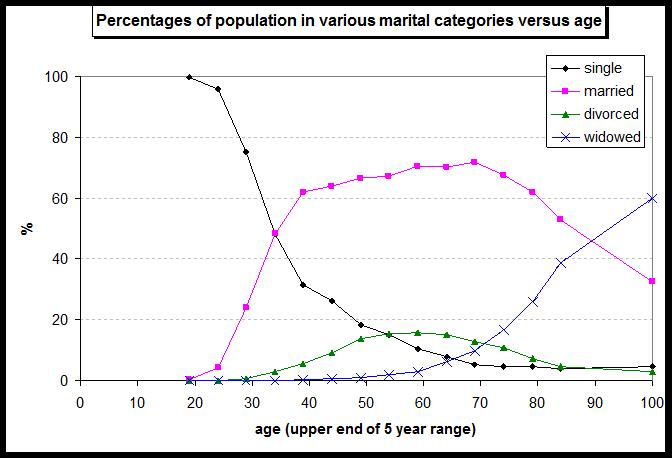
Figure 7a: Percentages of people aged 16 and over who are married or single, against year from 2002

Figure 7b: Percentages of people aged 16 and over who are divorced or widowed, against year from 2002

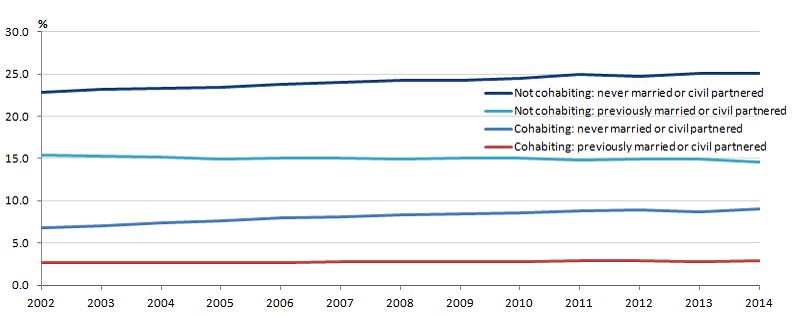
Living Arrangements
In 2014 the overall living arrangements of people aged 16 and over were,
- Living together as a couple 48.7%
- Cohabiting but never married 9.0%
- Cohabiting but previously married 2.9%
- Not living as a couple, never married 24.9%
- Not living as a couple, previously married 14.4%
The bulk of people “not living as a couple and never married” are young people, some of whom will later marry. This is illustrated by Figure 8 which shows the break-down of the above categories by age. Figure 9 shows how the above data have changed since 2002.
At the present time, only 5% of septuagenarians are in the “not living in a couple and never married” category. However, this is the 1940/50 birth cohort. Figures 3 and 4 show how dramatically this is due to change. By 2050, the 1980 birth cohort will be septuagenarians and it appears that around 40% – 45% of them will be living alone having never married. (Some will escape this fate by the expedient of being dead).
Figure 8: Percentages in various living arrangements versus age
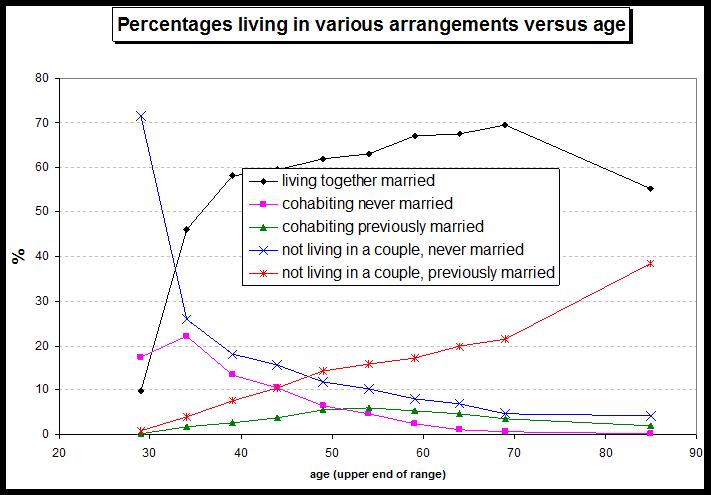
Figure 9: Percentages of people (age 16 and over) by living arrangements, 2002 to 2014
Demographics of Marriage
Figure 10 is taken from the 2013 Centre for Social Justice report “Fractured Families“. It shows the proportion of new parents who are married by income. In the lowest income group, barely more than half of new parents are married. In the highest income group approaching 90% of new parents are married.
[Incidentally, the latter observation shows how rare are successful career women who choose to have a child outside marriage, being financially independent – the alpha females. Not only are few women in the highest income category, but barely more than 10% of them choose to be unmarried. Being unmarried is a fate generally left to poor mothers].
Figure 11 is taken from “Cohabitation trends and patterns in the UK” by Ann Berrington and Juliet Stone of the ESRC Centre for Population Change, University of Southampton (February 2015). These data present characteristics of married and cohabiting women living with a partner and at least one child under the age of 16 years (in 2012-13). Salient points are,
- Married mothers enjoy a higher household income than cohabiting mothers at every percentile (see also Figure 12);
- Married mothers are more likely to be employed than cohabiting mothers;
- Cohabiting mothers are 2.4 times more likely to be in a partnership in which neither partner is employed or in full time education;
- More than three-quarters of married mothers live in owner-occupied premises, compared with fewer than one-half of cohabiting mothers;
- More than one-half of married mothers have a degree, whereas the commonest highest educational attainment for cohabiting mothers is GCSE level.
- Cohabiting mothers are far more likely to be in their twenties than married mothers; married mothers are far more likely to be in their forties than cohabiting mothers (see Figure 13).
Figure 10: Proportion of new parents who are married (2012)
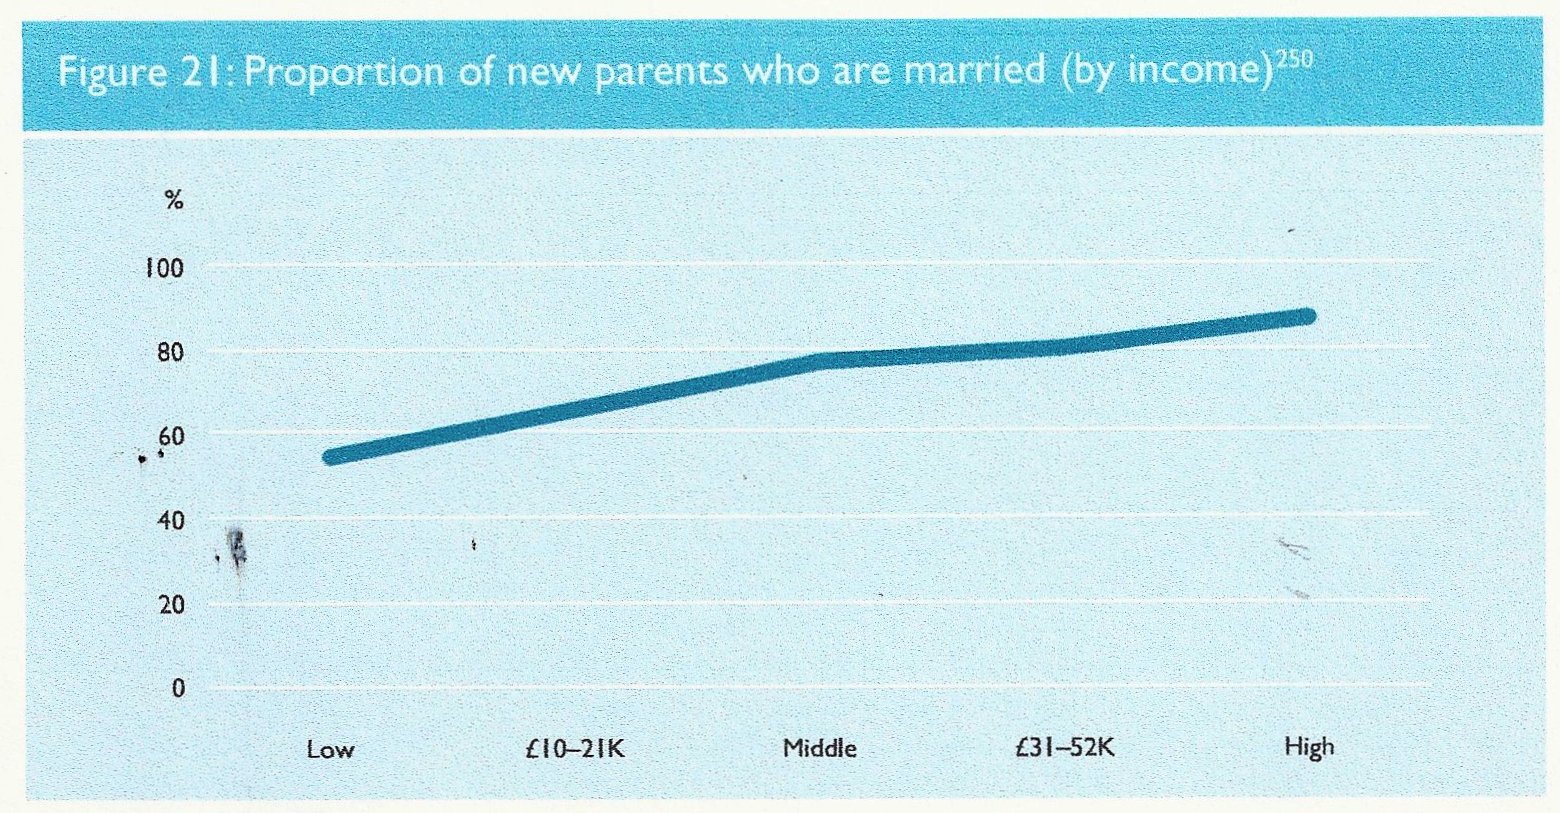
Figure 11: Characteristics of married and cohabiting mothers (2012/13)
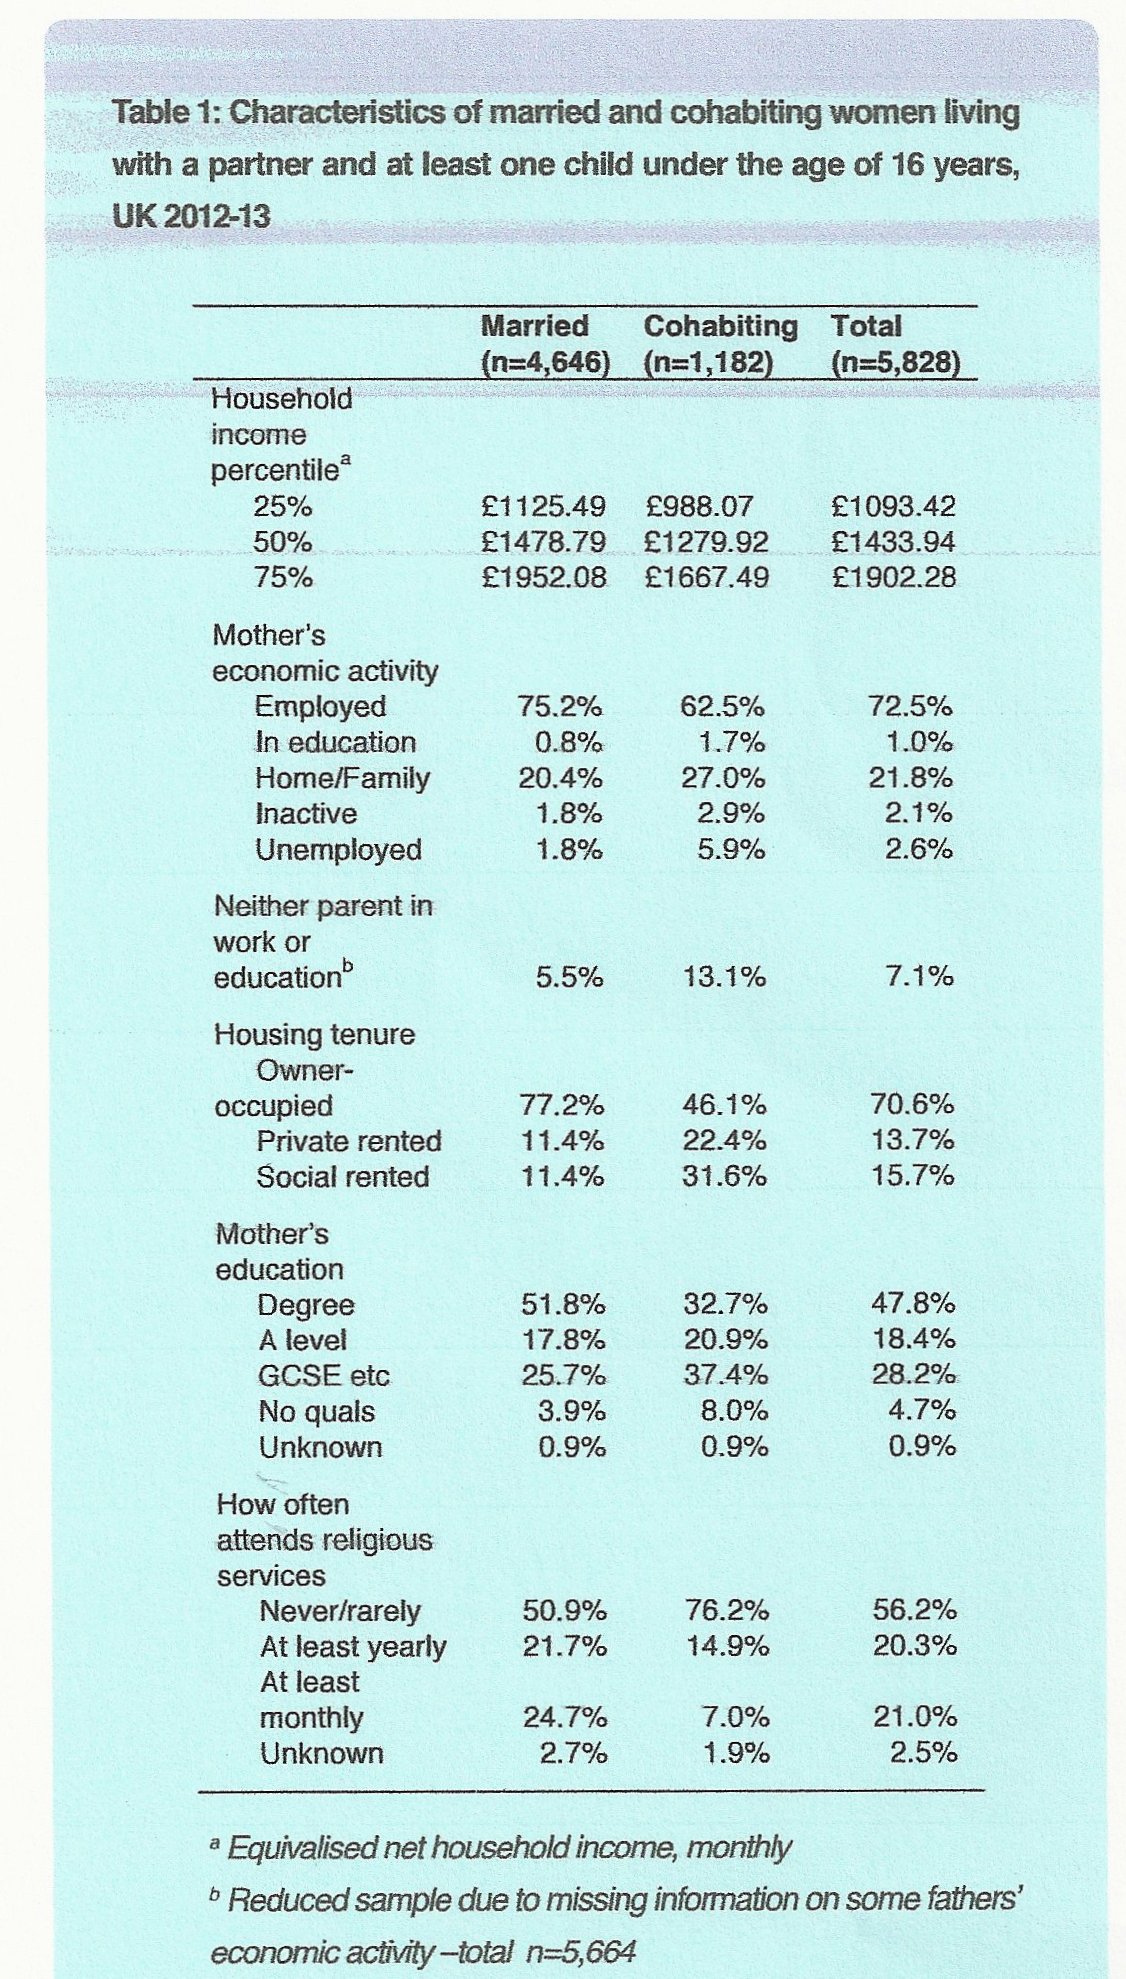
Figure 12: Household Income: Married and Cohabiting Mothers Compared
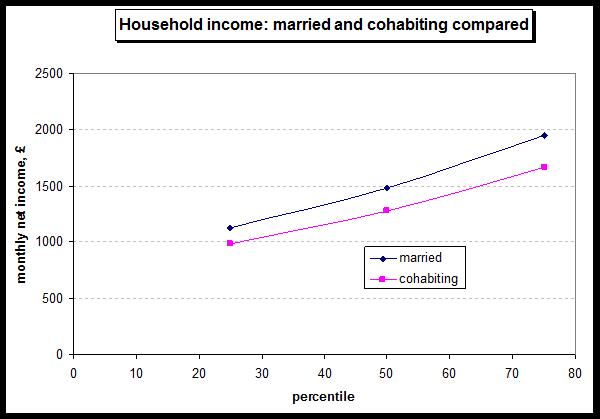
Figure 13: Age distribution of married and cohabiting mothers (2012/13)

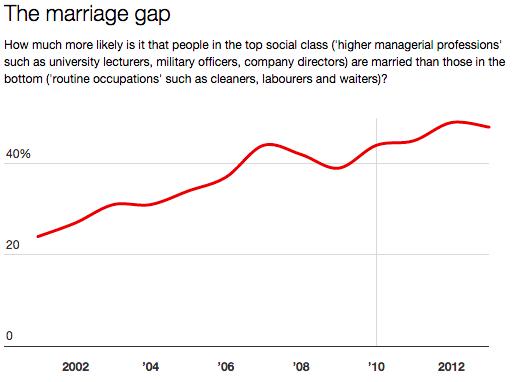
Figure 14: From The Spectator, 15/11/14 (Fraser Nelson)
Conclusions
Talk of the imminent demise of marriage is inaccurate. It is true that the proportion of adults who are married has fallen over the last four decades, but this is in part due to people getting married later. This inevitably results in a smaller proportion of the population being married at any one time, but many of the currently unmarried will marry eventually. At present ~51% of adults are married, but 70% of 70 year olds are married, and 95% of 70 year olds have been married at some time. In other words, only 5% of the 1940/1950 birth cohorts have never married.
However, this will change. Extrapolation of Figures 3 and 4 suggests that around 40% of women and 45% of men of the 1980 birth cohort will never marry. This is the ultimate effect of the declining marriage rates shown in Figures 1 and 2.
Whilst there are signs that the proportion of people who are married may be bottoming-out at ~51%, it hardly seems possible that this can be the case if the never-married are heading towards ~40% over the next decade or two. This is because it seems unlikely that the proportion of people divorced or widowed by their late sixties will fall much below the current level of ~25%. This suggests that the proportion of people who are married may drop to ~35% over the next decade or two.
However, I suspect that marriage will then achieve a new ‘equilibrium’ level rather than continue a decline towards obliteration. And this brings us to the most pernicious aspect of this tale of marriage. What is happening is the creation of a two-tier society. Let’s call them the middle class and the working class for want of a better terminology. The current decline of marriage is, I believe, a transition period from the old regime in which marriage was for all, to the new regime in which marriage is predominantly the preserve of the better off. Fraser Nelson has made this observation in his Spectator article, illustrated by the demographic “marriage gap” of Figure 14. The same point is made by Figures 10, 11 and 12, above.
In historic times, marriages were often seen as economically driven mergers between families. Perhaps they still are. For the financially buoyant middle class, a marriage may still be like a merger between two successful companies, looking to leverage their capabilities and earnings. But who wants a merger with a financially failing company? Time was that marriage was financially beneficial even for the relatively poor: “two can live cheaper than one”, etc. But thanks to the combined operation of the taxation and benefit systems this is no longer the case. In fact, couples claiming benefits are now often obliged to live apart (or pretend to do so) in order not to loose benefits without which they could not manage. And amongst the working class, marriage has largely lost the appeal it once enjoyed as a source of financial security.
This marriage gap between the working class and the middle class is arguably the most serious, and certainly the fastest growing, of social inequalities. But this creeping social segregation, as Fraser Nelson has put it, goes unremarked. Why? It is because it would be transgressive of feminist orthodoxy to suggest that the presence of men in the family might be beneficial. The key aim of feminism has always been to make women financially independent of men, because their ideology insists that being financially coupled to a man is necessarily an hegemony. The idea that marriage might be a mutually beneficial symbiosis is anathema to these ideologues. And so feminism has driven an increasing class divide. Those women who are not able to be careerists must needs rely on the State if their own earnings are insufficient, and the State is becoming an increasingly parsimonious husband.
Political and social debate is unable to recognise the seriousness of the decline of working class marriage, or to correctly identify its cause, because such debate is constrained by political correctness, controlled by the feminist perspective. And feminists are ideologically prevented from admitting that marriage might be required for women’s well-being. It is here that the decline of marriage amongst the working class, and the consequent impact on women, is crucially linked to the disadvantaging of men. As Belinda Brown has explained, single parenthood is a major source of poverty in contemporary society and it is directly related to our complete lack of interest in the well-being of men. Feminism drives the inescapable propaganda that presents men as dangerous to women. This hardly encourages marriage. Also, for the poorer working class, many men are not an attractive financial proposition either. This can have the result that marriage in the lowest socioeconomic groups can leave the woman even worse off than as a single parent – further driving down the popularity of marriage in such groups. And the reducing economic fortunes of working class men are driven by educational failure and the decrease in male employment – both issues which feminism does its best to hide. This is how middle class feminism damages working class women via working class male disadvantage.
I am bound to observed that there is one universal of human life: if someone is getting trashed, it’ll be the working class.