Many people will have noticed that GP’s surgeries have not returned to their pre-lockdown arrangements. Moreover, for some years prior to Covid it had been notoriously difficult to get a GP appointment, especially in some areas and especially in less than a few days.
Commentators are becoming more outspoken regarding the reason for this diminishing performance of general practice: it is due, they claim, to the increases in the proportion of GPs who work part-time. Writing in The Spectator on 4/6/22, Meirion Thomas observed,
“Currently, an astonishing 58% of GPs work three days or fewer per week. We’re told that seeing patients is such a stressful business that part-time working is the only way to prevent burnout. In my 33 years working as an NHS consultant surgeon, I don’t remember this ever happening to heart, brain, cancer or other specialists who take life and death decisions every day. GPs’ work is far less complicated. Why should they be so badly affected by burnout?”
However, only the bravest commentators will proceed to the next step – that the increase in part time working by GPs in recent decades is a result of the huge increase in women GPs. Kathy Gyngell did so in an interview on GB News, to the visible discomfort of the presenter. Even GB News, it seems, does not want to air anything that sounds supportive of the idea that the old workaholic patriarchy might have been a social good – and still less can any criticism of the feminist equity obligation be voiced.
Here I do my usual thing and examine the data. Is it true that the pressure on GPs has increased over recent decades? And is it true that GPs’ part-time working has increased markedly and that this is attributable mostly to women GPs?
One issue that must be mentioned immediately in the context of the pressure on GPs is the Blair-era revised GP contract (2004). In simple terms this made being a GP a 9 to 5 job (or, often, less than this). Out went the idea of GPs “doing their rounds” after hours and at weekends – essentially working whatever hours it took to get through the workload. This was, at a stroke, a massive diminishing of pressure on GPs. This is forgotten now. The attention span of the feminist-progressive mind is conveniently short: historical reality does not play well with their narrative.
Readers may like to skip the details and proceed straight to the Summary.
Ambiguities in the Data
I will quote many disparate sources below. There will be inconsistencies between sources and ambiguities in defining what is measured. The bulk of the inconsistencies between sources probably results from said ambiguities, i.e., they relate to different definitions of the measured quantity. The matter is exacerbated by politicians who spin the data according to their political prejudice. Some of the issues are as follows,
- Exactly who is counted as a “GP” (General Practitioner)? Is it only those fully qualified, or does it include GP trainees (who are already doctors and are currently working in practices as the final step towards qualification)? Does it include locums? Does it include “GP Partners” or salaried GPs? Does it include “Registrar GPs”? Sources will differ; some give data for all the above, some just one number without clearly stating what it is.
- Also numerically very important is whether we are counting all registered GPs, or only those for whom there is evidence that they are currently working as a GP. Do GPs on the specialist register count as “registered”? Basing a definition on evidence of being currently employed as a GP depends upon one of two things, both unreliable. The first is surveying GP practices, which inevitably results in only a proportion of practices responding, and so will always be incomplete. The second method is to use the NHS Practice History Records for individual registered GPs. Unfortunately, as of 2016 at least, only 87% of registered GPs have a practice history record, and only 79% both such a record and a valid practice history entry, see What our data tells us about GPs (gmc-uk.org).
- A GP may have more than one contract, and some sources may count contracts rather than GPs.
- If you are a politician of the Party in power you will most likely quote headcount numbers of GPs. If you are an opposition politician seeking to demonstrate how the Government is running down the NHS, you will quote either FTE (Full-Time Equivalent) or the number of GPs per 100,000 of the population. The latter is as much a measure of population increase as of GP numbers. The bleakest picture is provided by FTE per 100,000, but this is also the best measure of how much GP time is available per patient.
However, despite all these opportunities for political obfuscation or inconsistent definitions, we shall see that all sources indicate the same qualitative answers to the questions posed above, i.e., the pressure on GPs, the issue of part-time working and the increasing proportion of women GPs.
England
Most of the data used here derives from NHS Digital’s publications on workforce, current or historical, plus some data from the General Medical Council.
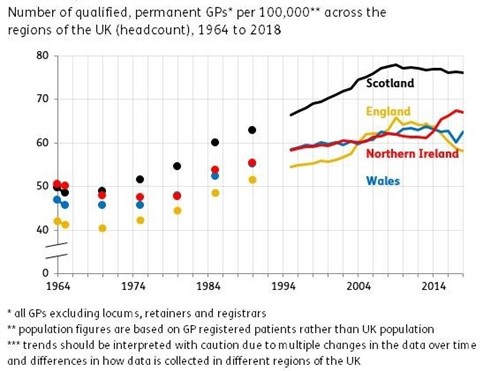
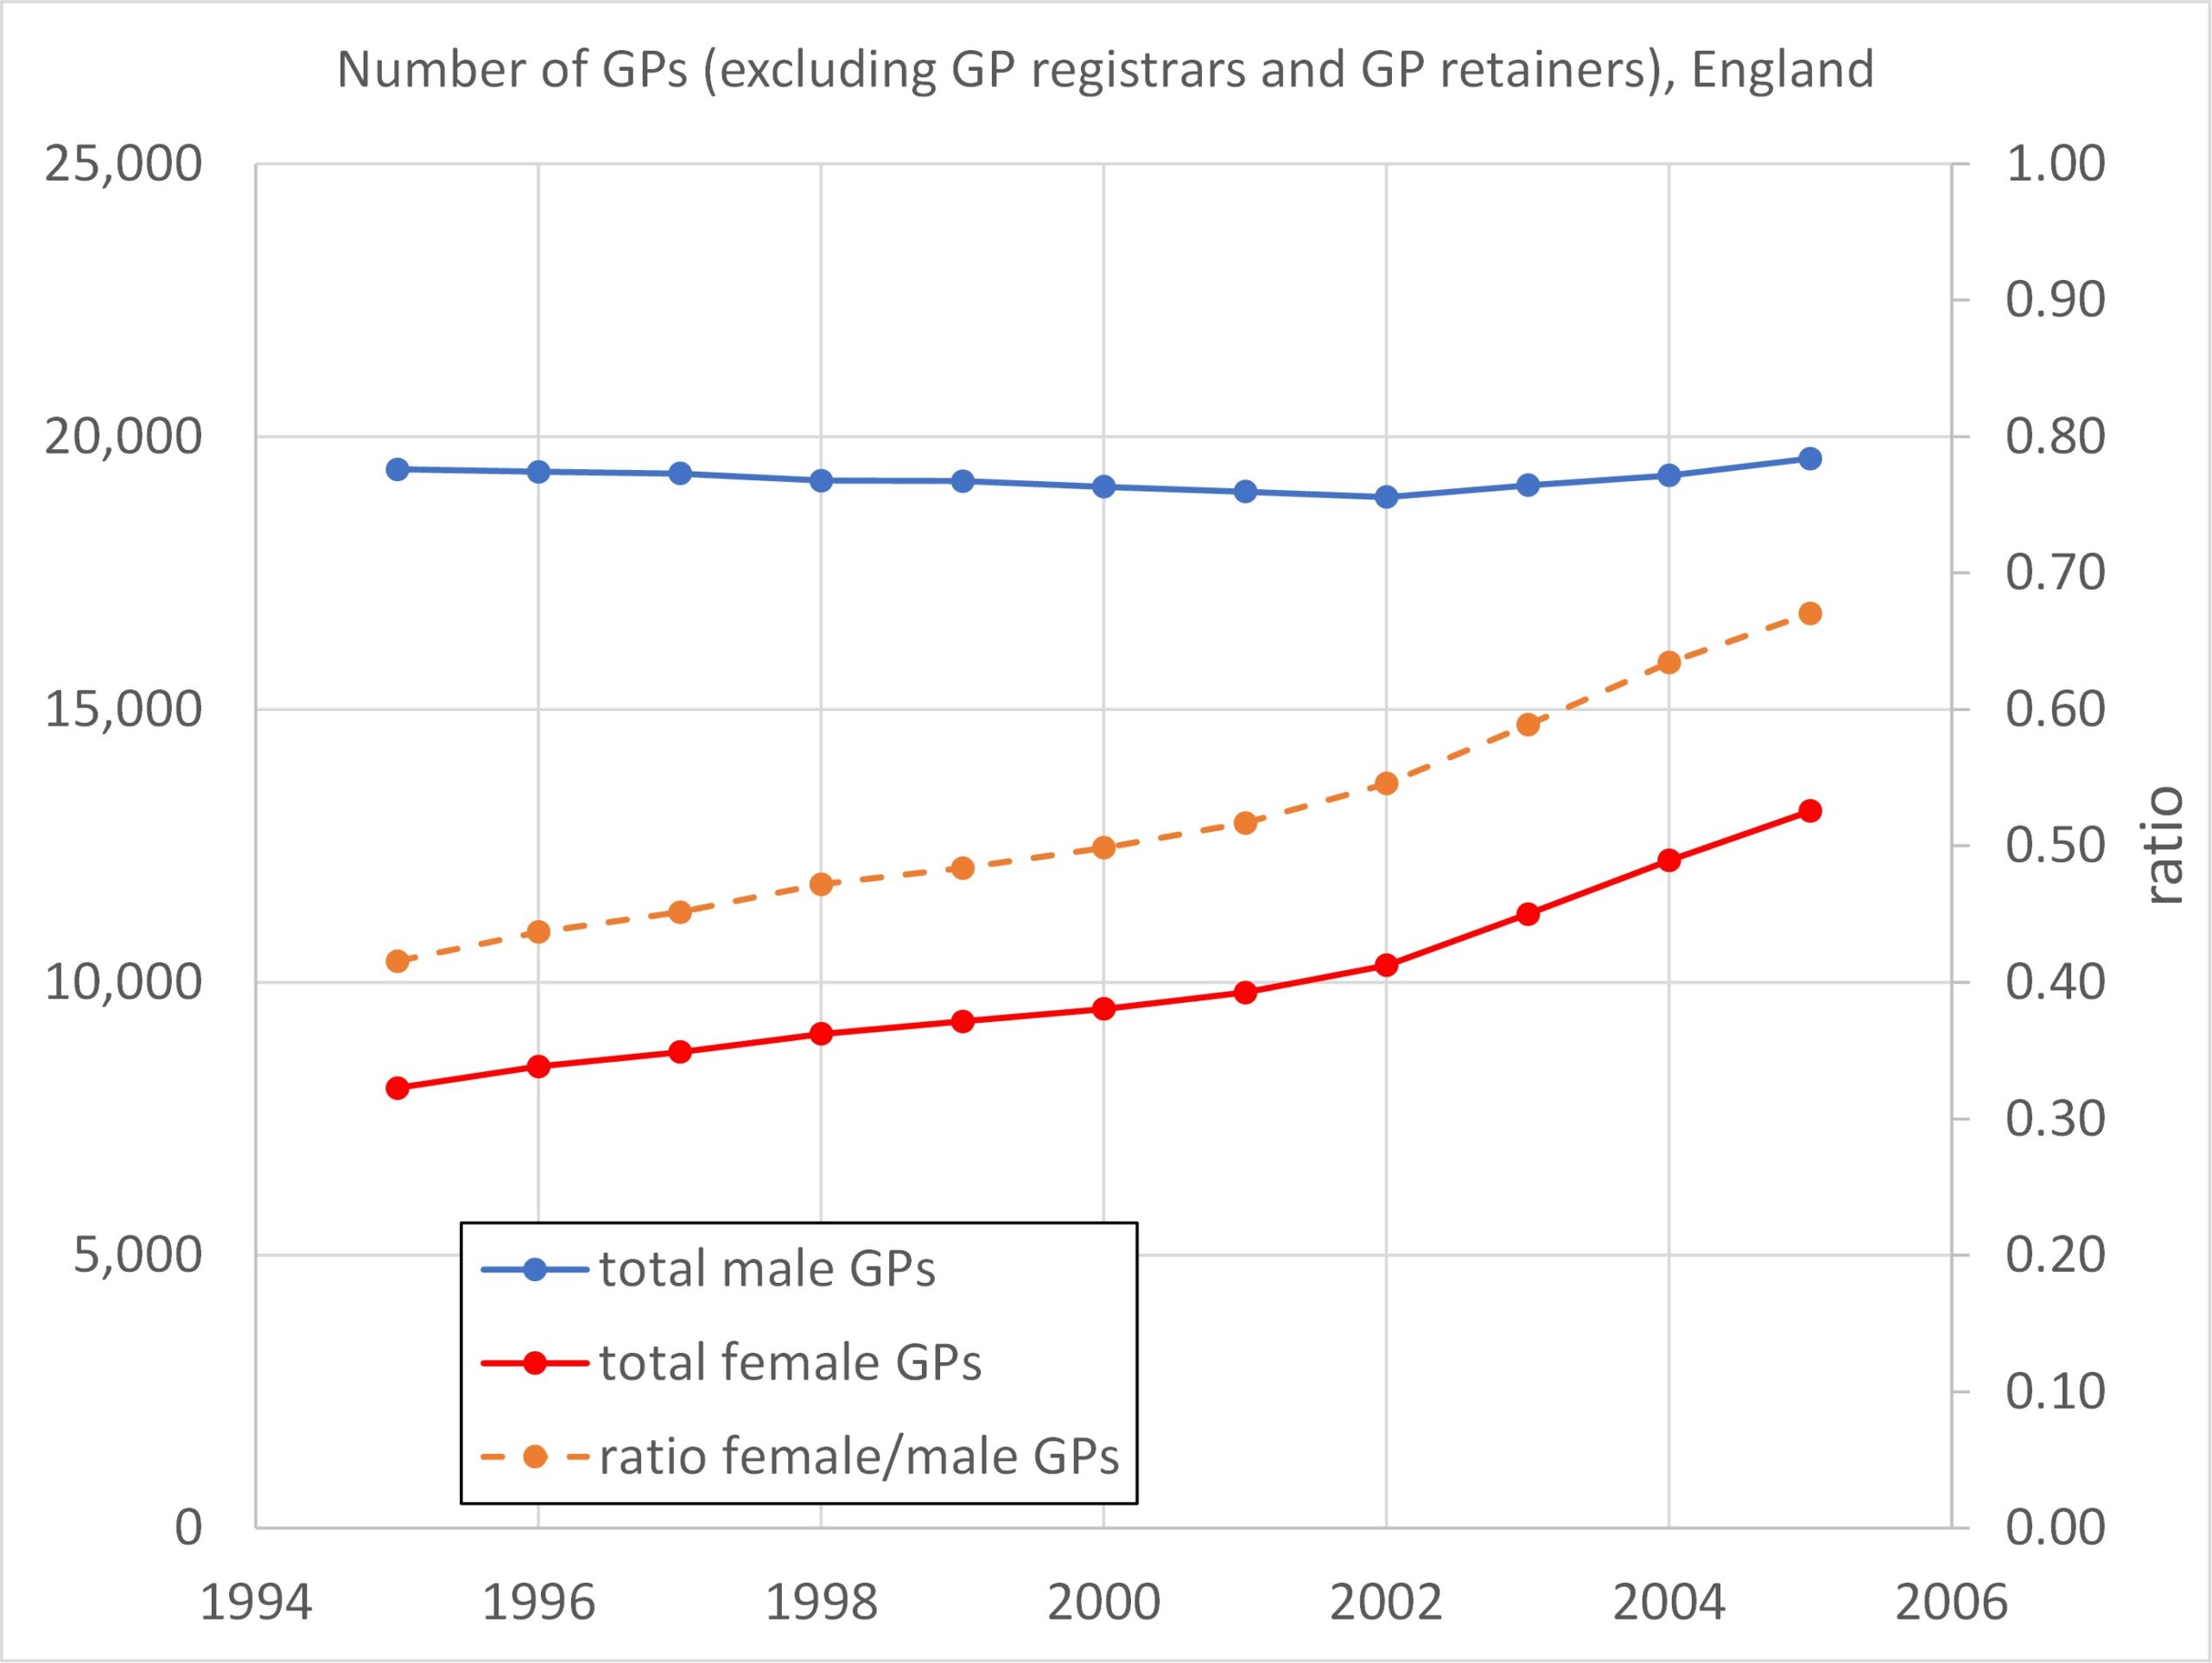
Figures 1 and 2: Over the period 1995 – 2005 the number of male GPs remained constant while the number of women GPs increased substantially (hence an increasing total number of GPs). Over this period there were around three times as many female part-time GPs as male, even when male GPs outnumbered female GPs by more than 2-to-1.
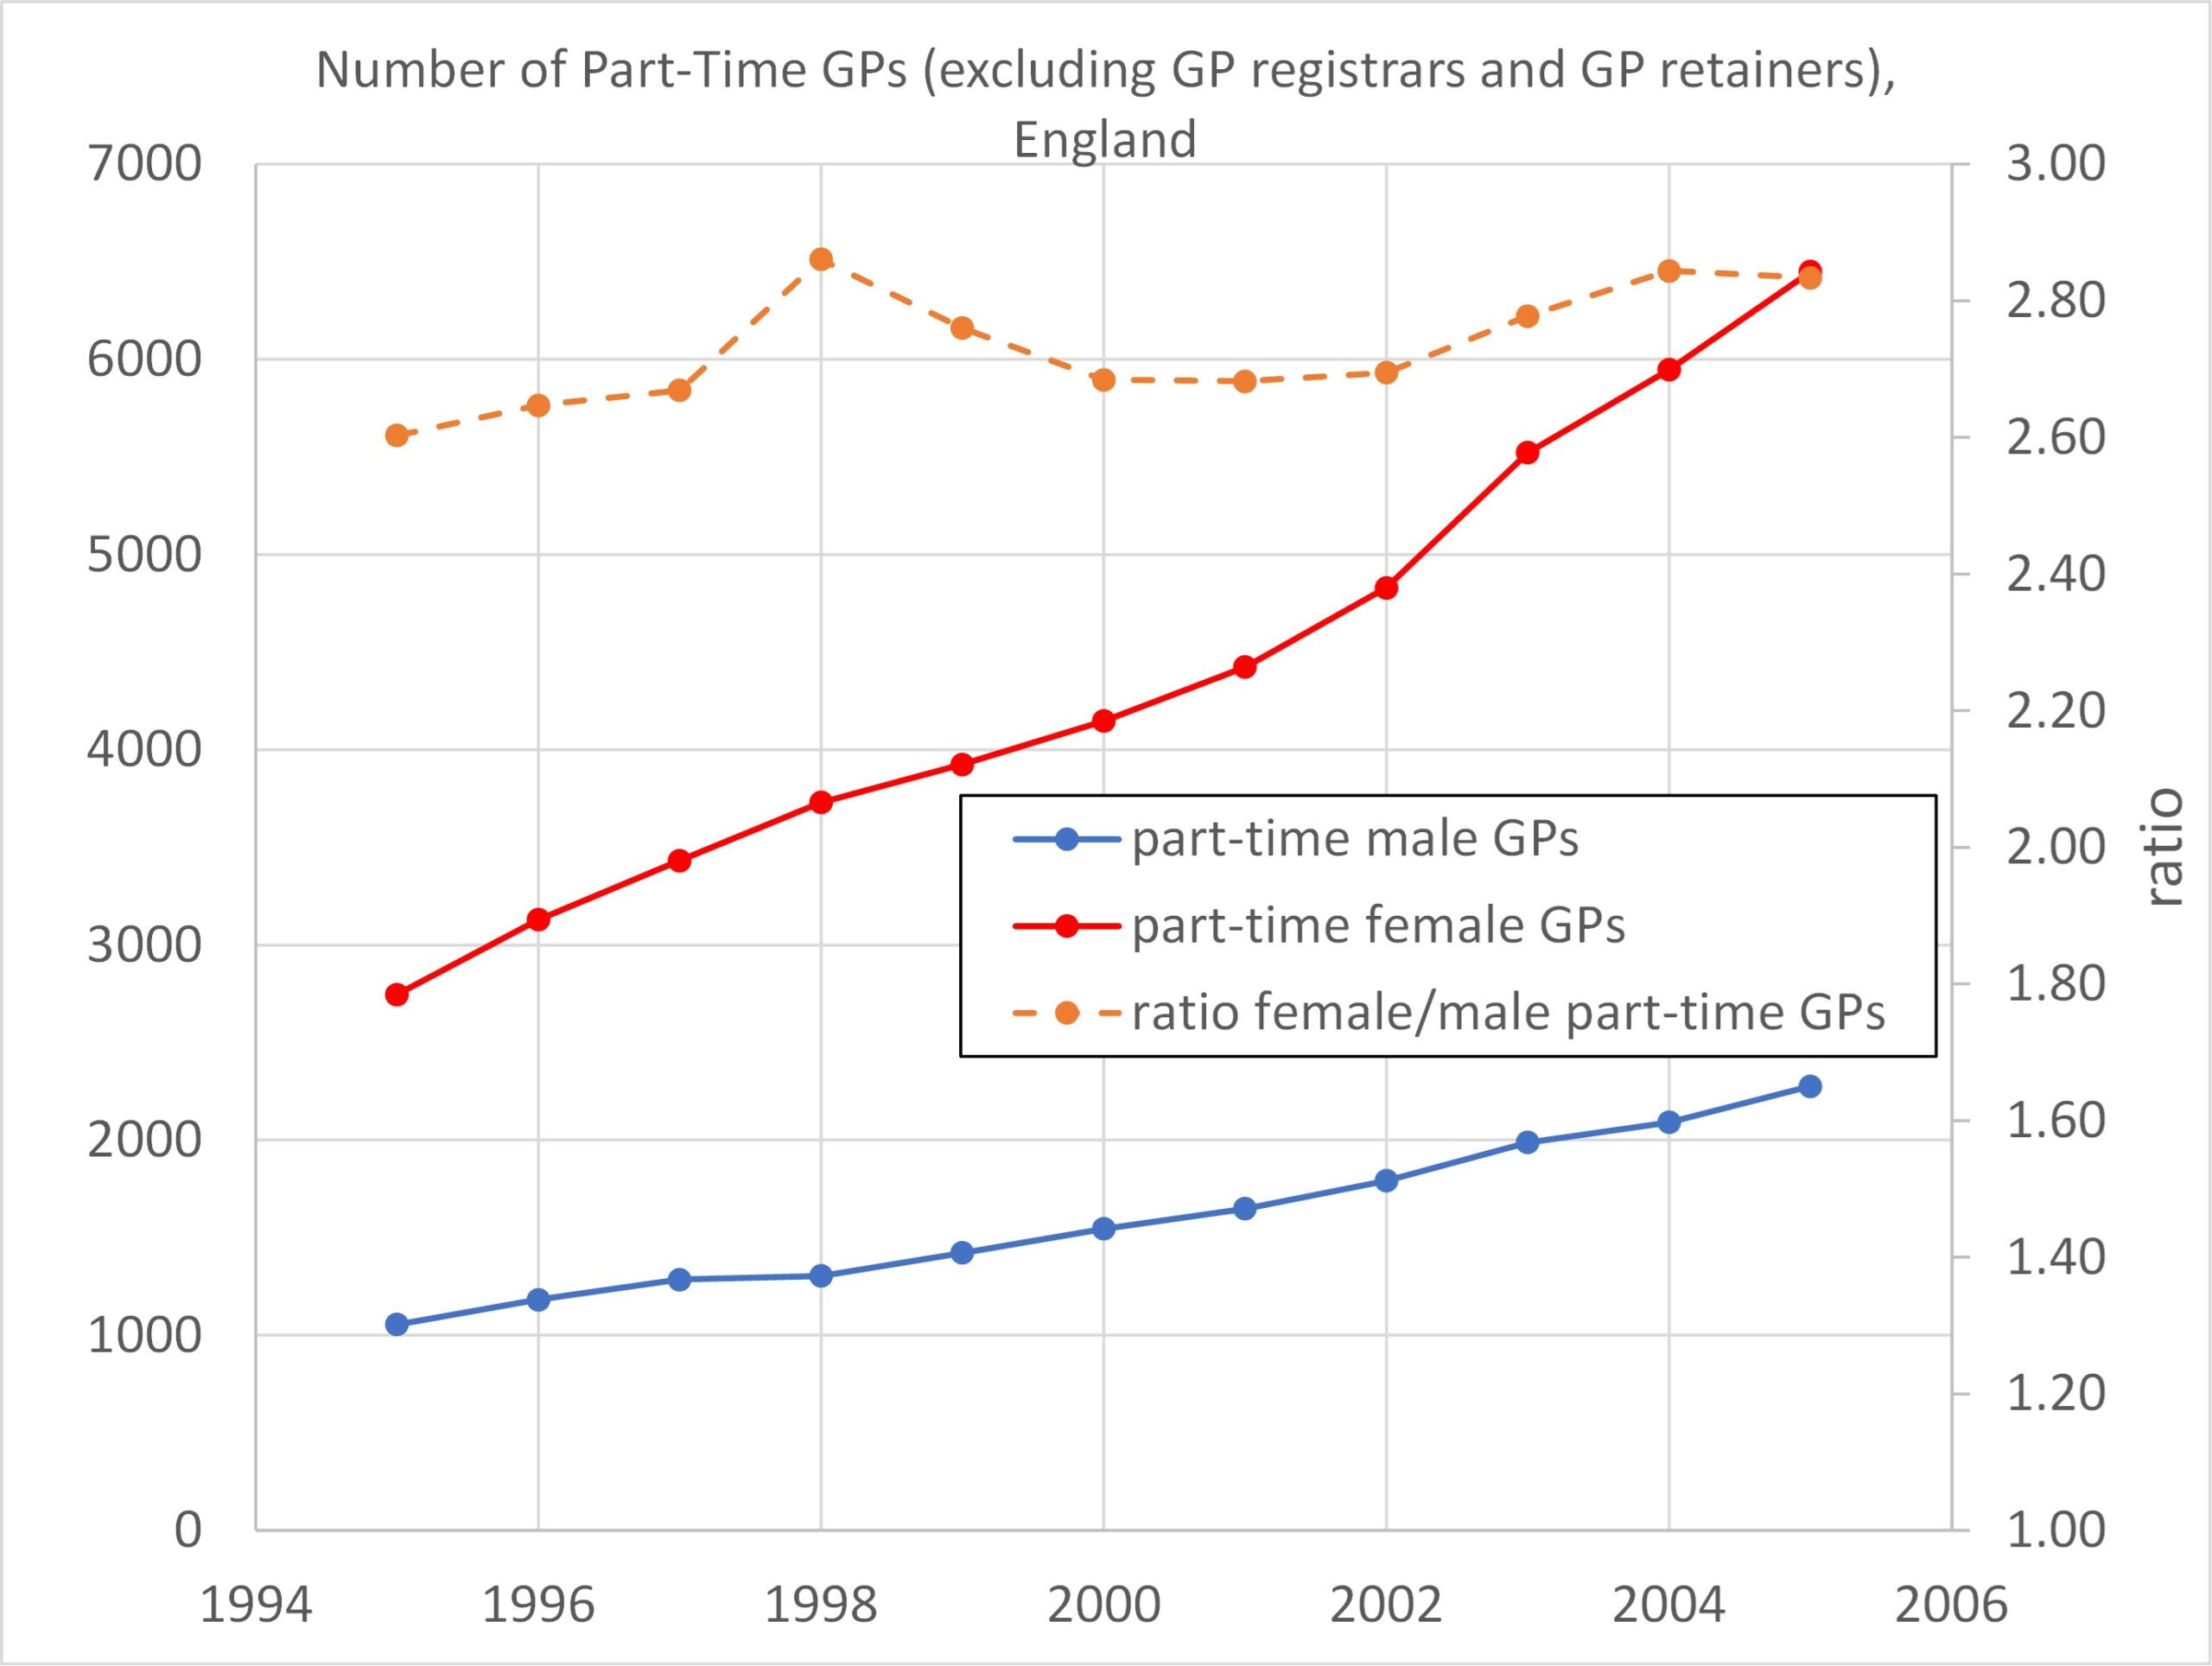
Figure 3 shows that the total number of fully qualified permanent GPs in England hasn’t varied much over the period 2015 to 2022, but has risen slightly.
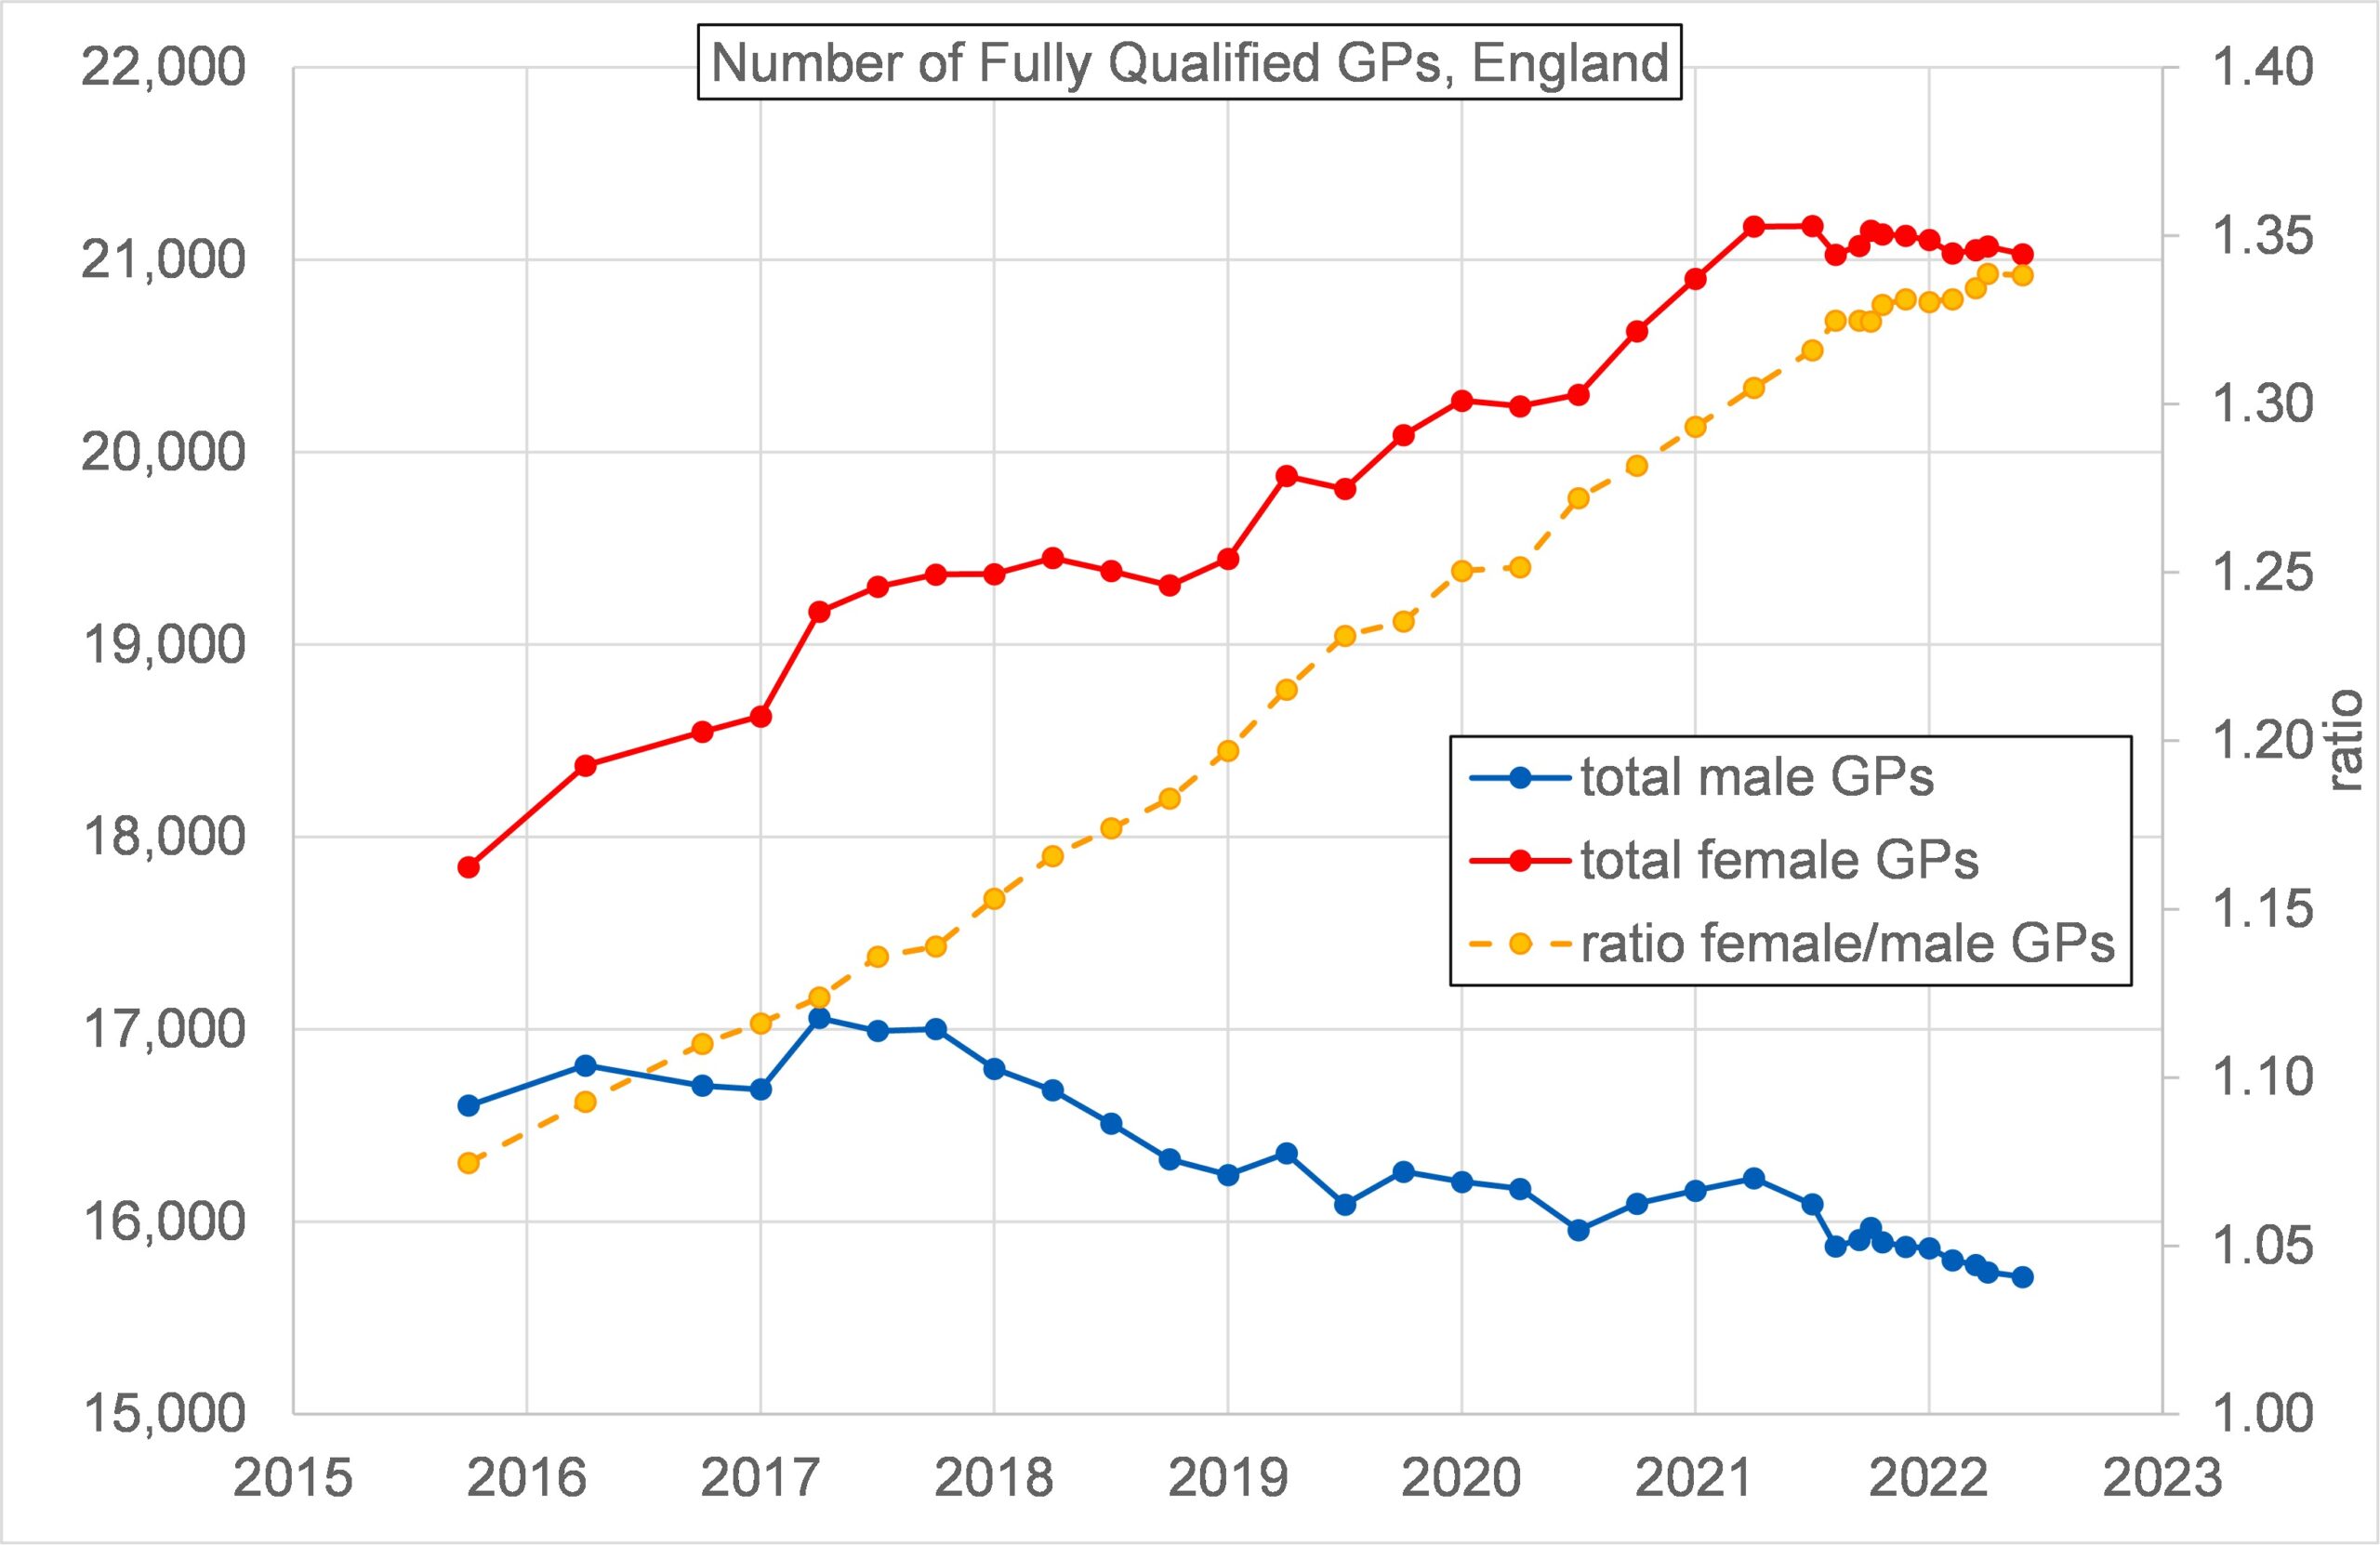
Figure 4 shows that the number of fully qualified permanent female GPs increased substantially over the period 2015 to 2022 whilst the corresponding number of male GPs reduced. The number of fully qualified permanent female GPs exceeded the number of fully qualified permanent male GPs sometime before 2015. In 2022 the number of fully qualified women GPs exceeded the number for male GPs by 35%.
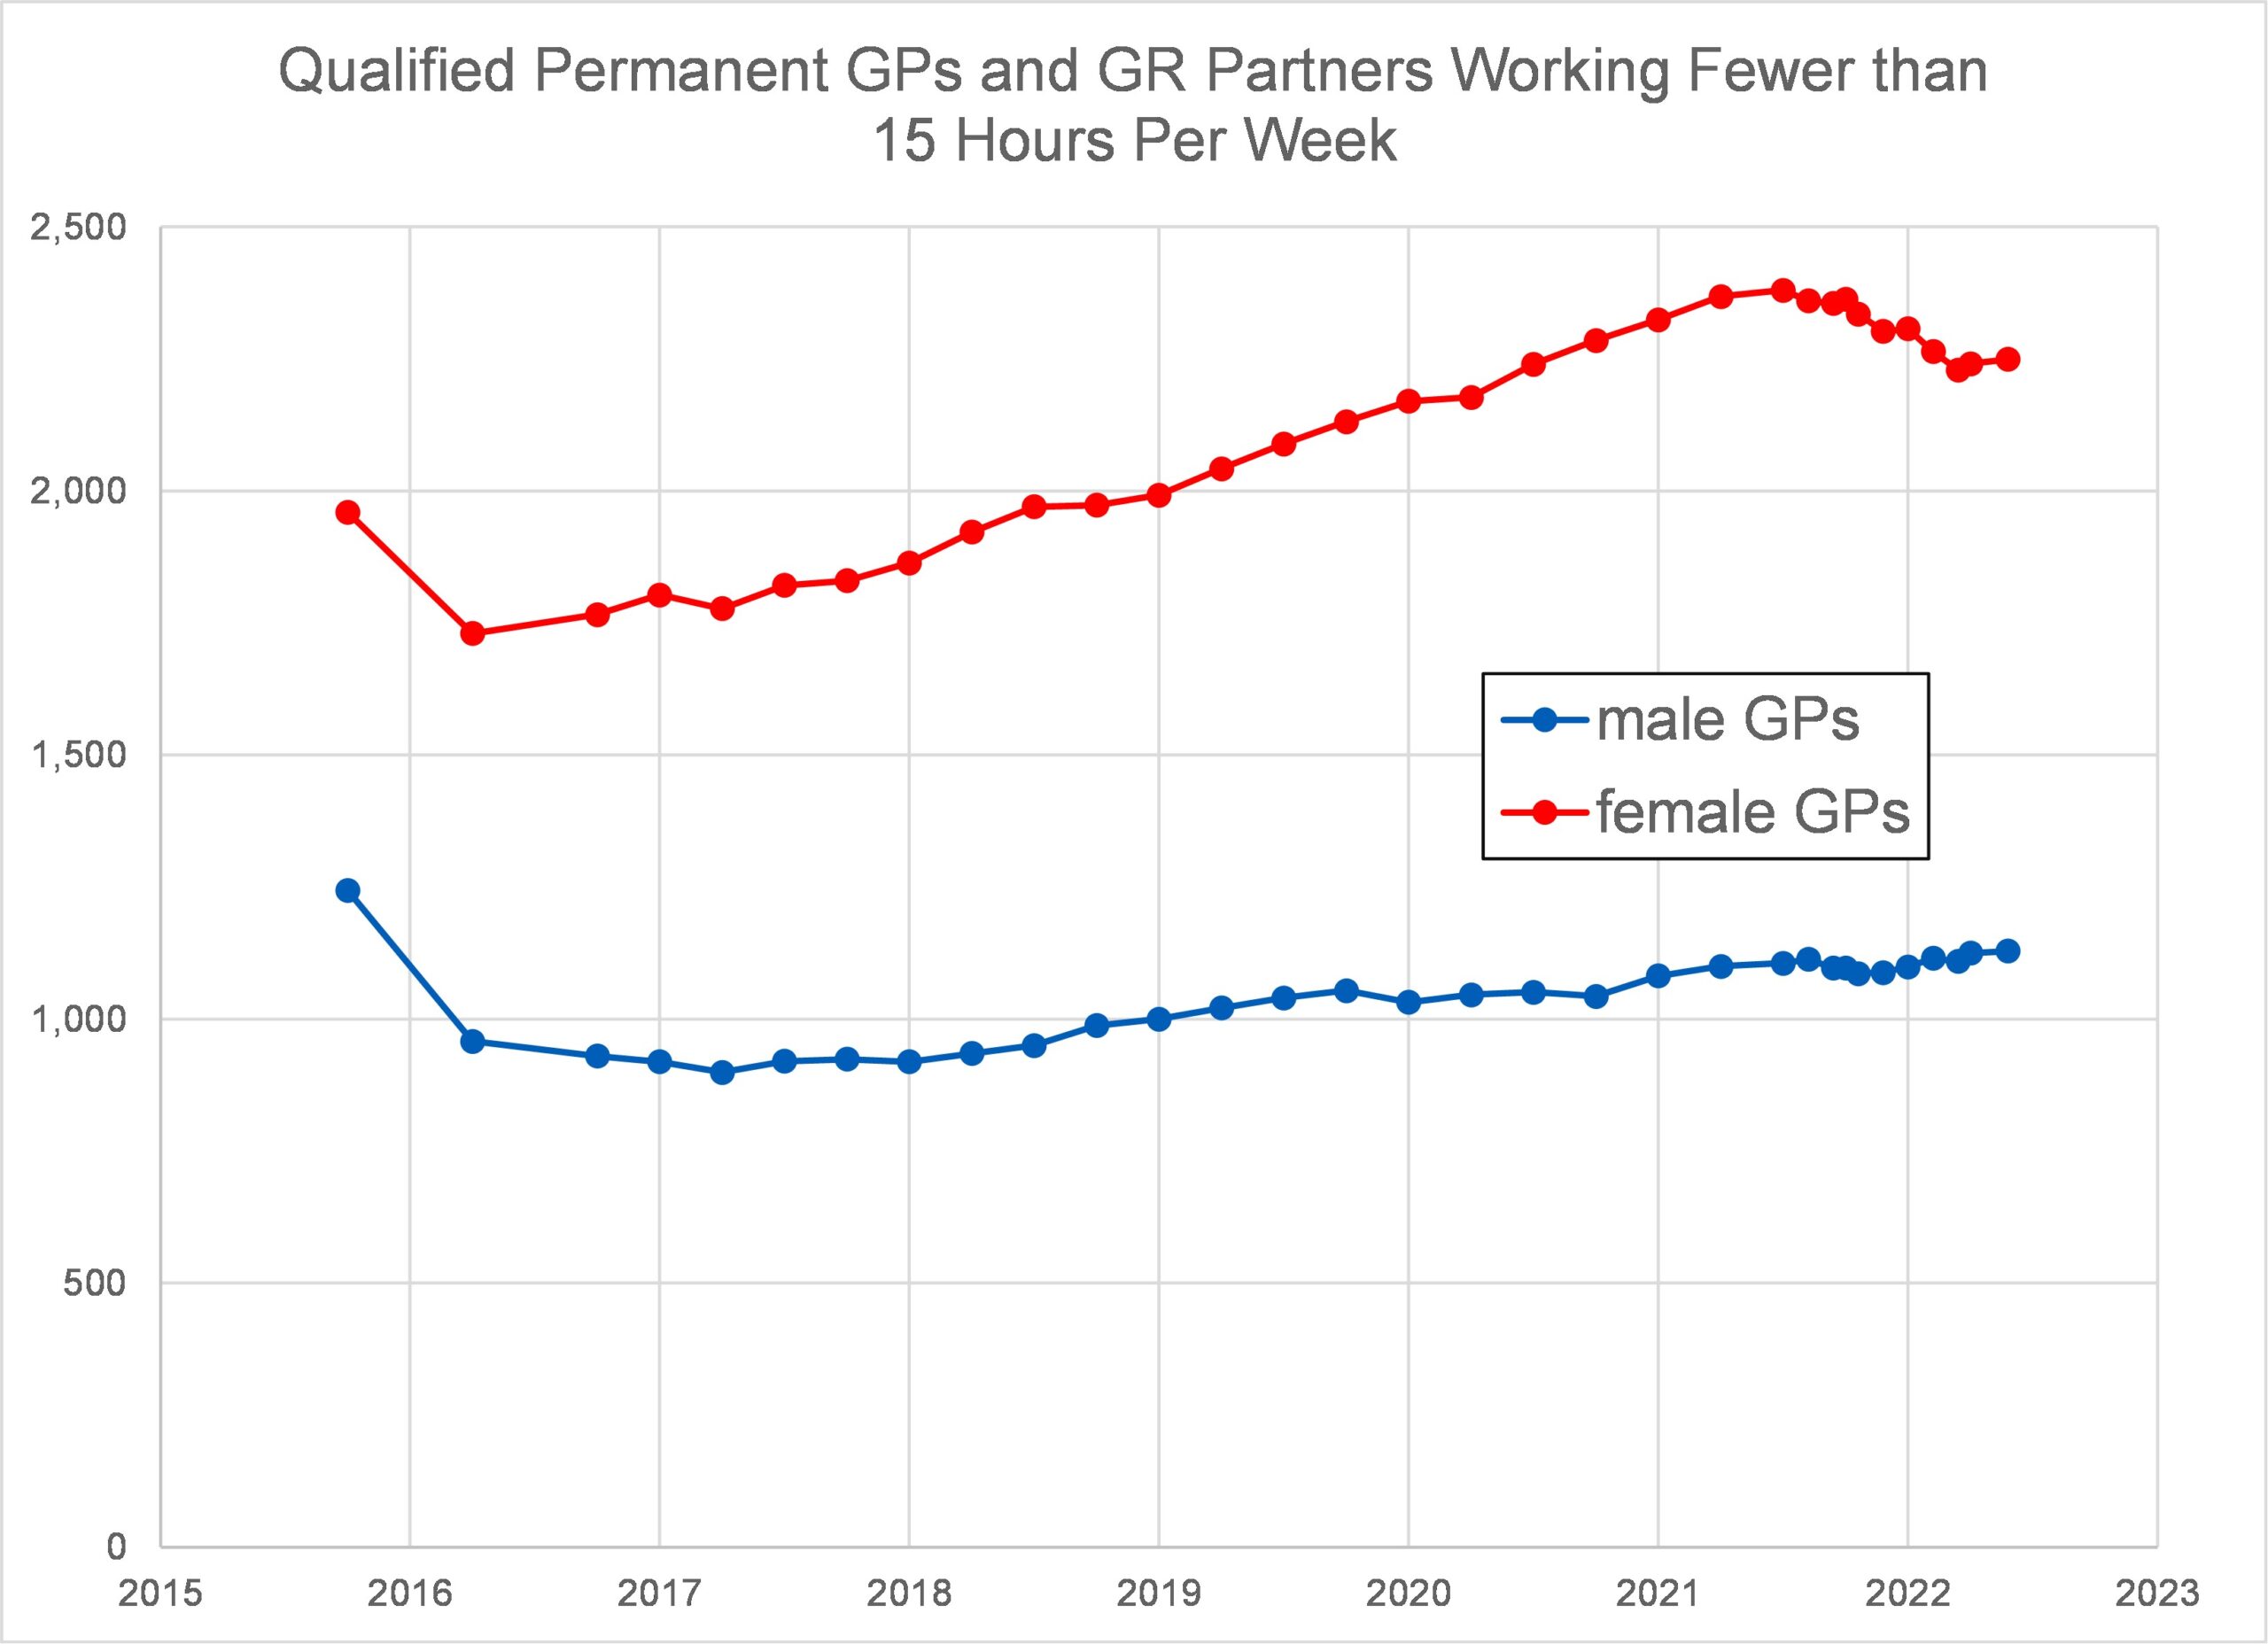
Figures 5 and 6 confirm that the number of female GPs working part-time has continued to considerably exceed the number of male GPs working part-time. However, Figure 6 is potentially misleading as it fails to disaggregate full time working (37.5 hours/week) from part-time working between 15 and 37.5 hours per week.
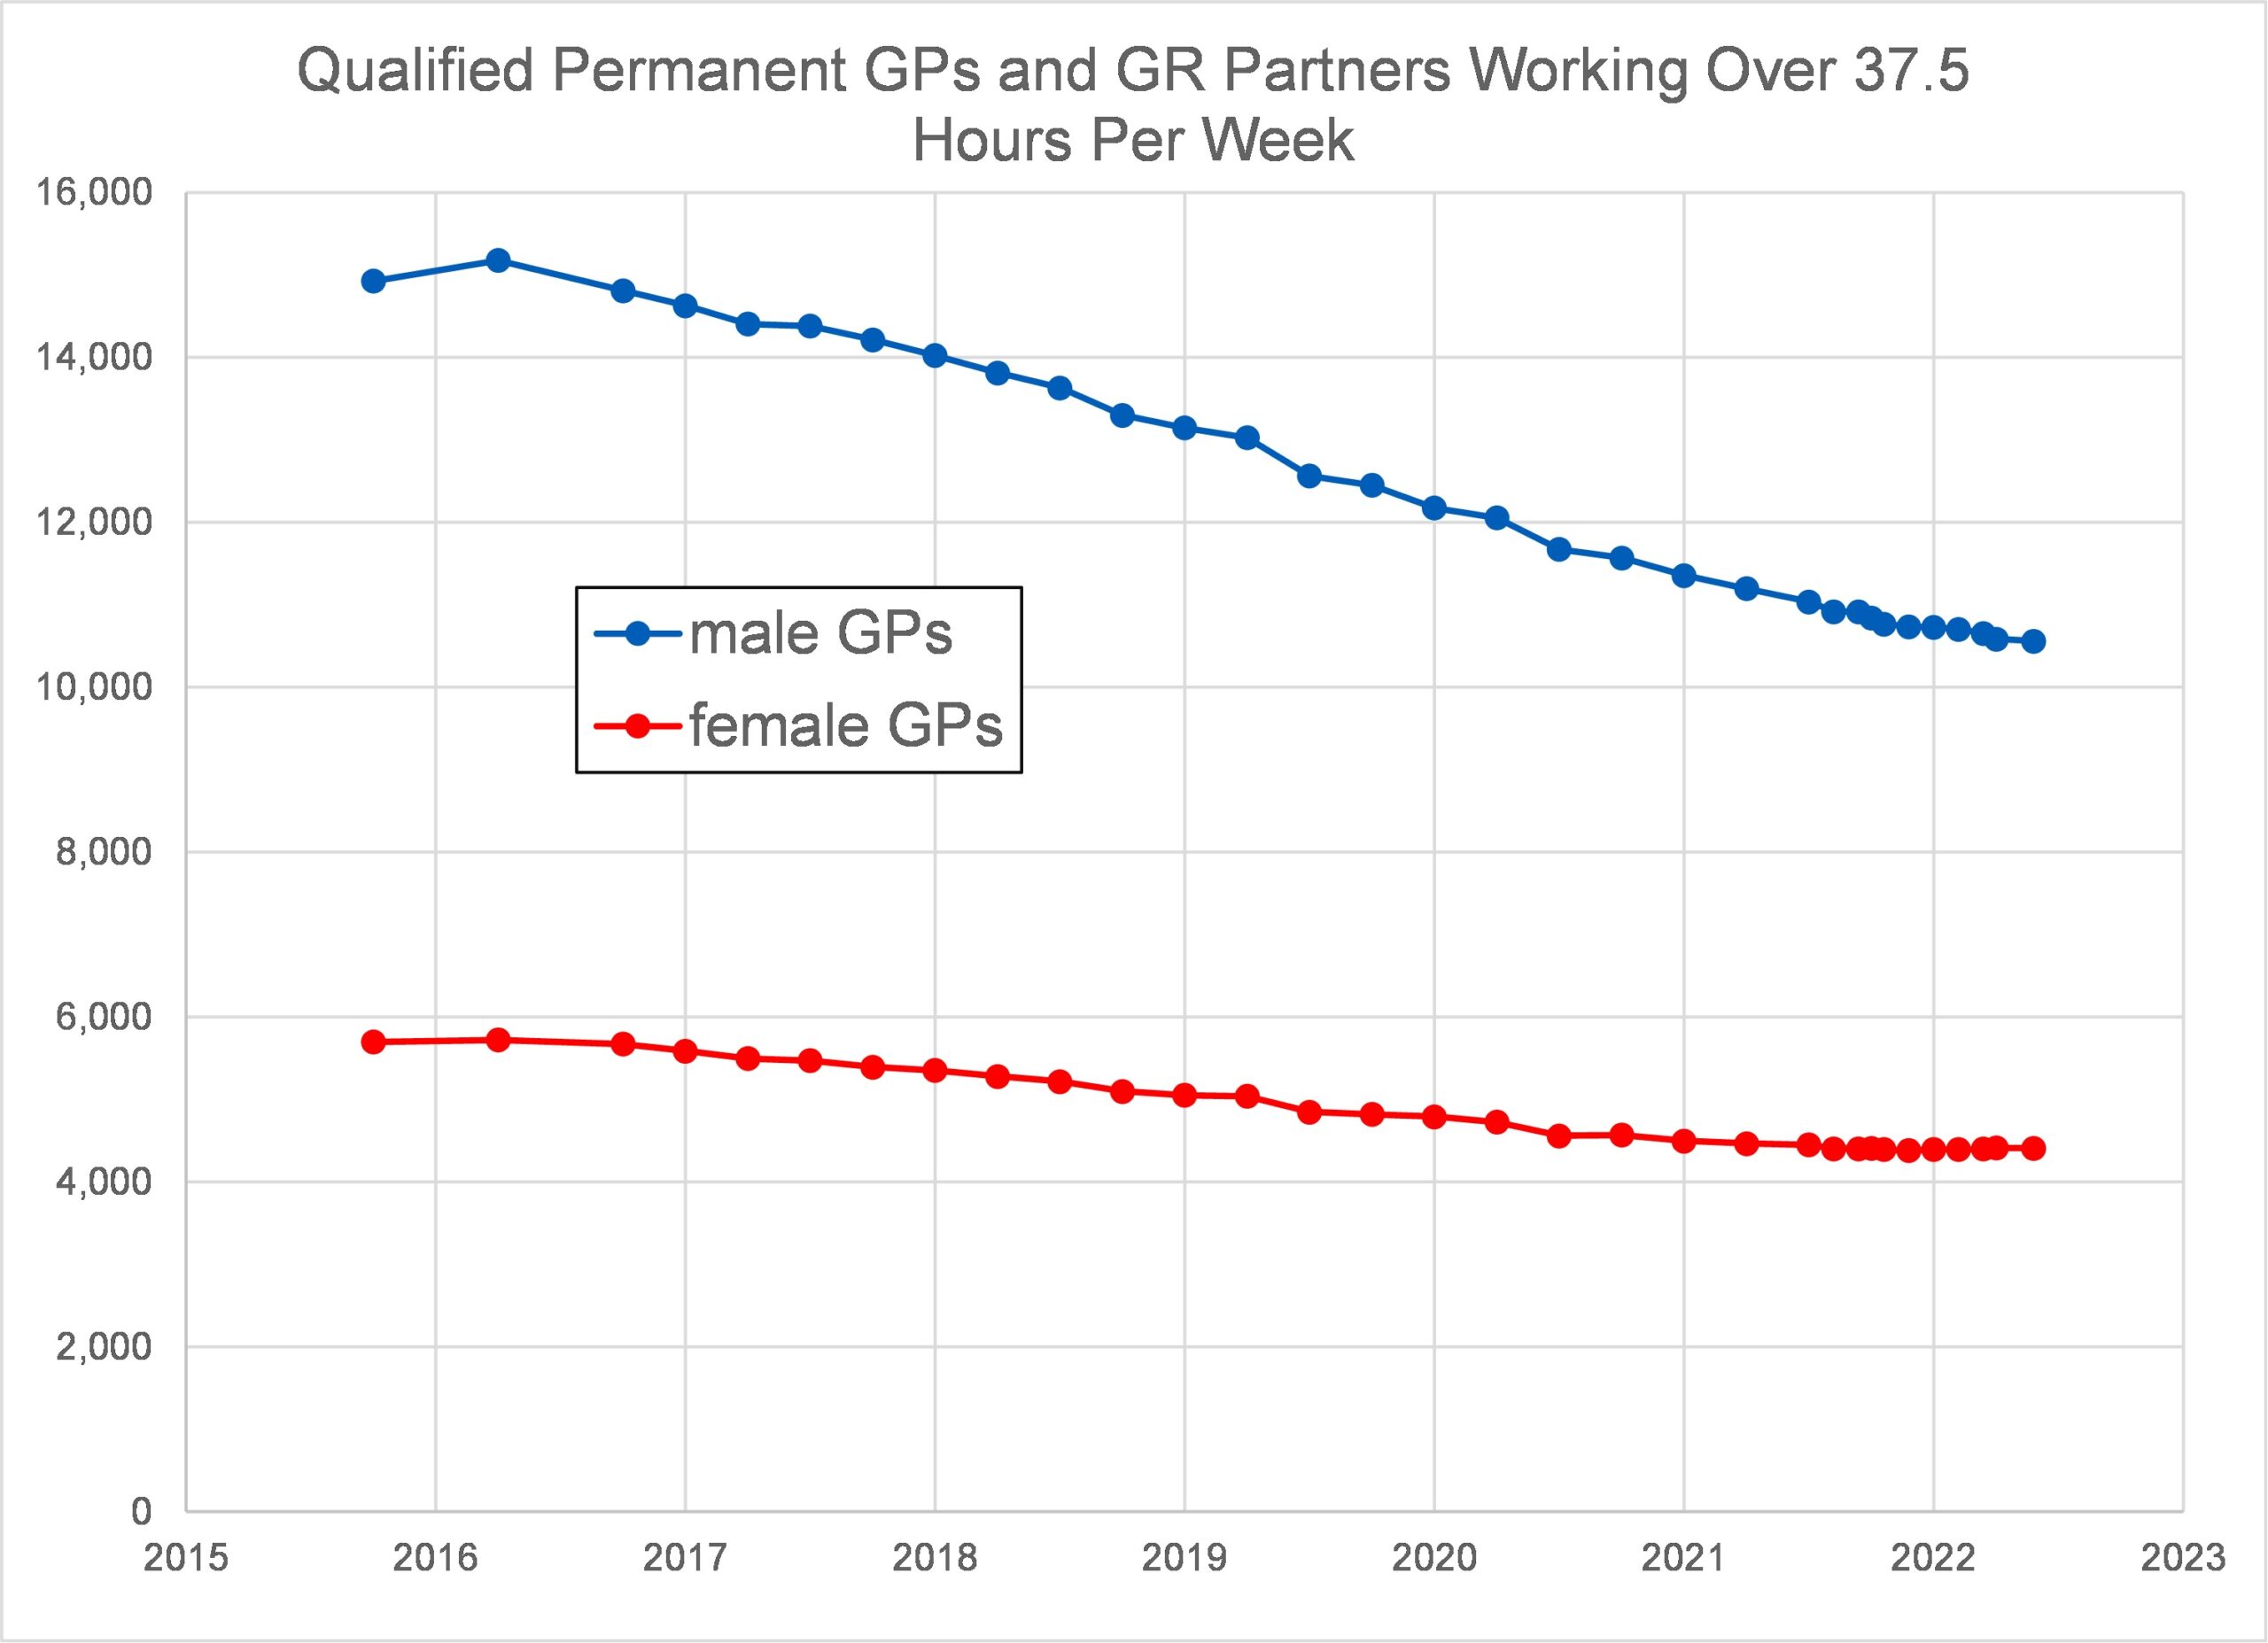
Figure 7 shows that fewer male and female GPs are choosing to work over 37.5 hours per week, but there are still a lot more men doing so. The reducing number of male GPs, and hence the reducing number of male GPs working in excess of 37.5 hours, is a contributor to the overall reduction in working hours being delivered by GPs now compared with the past.
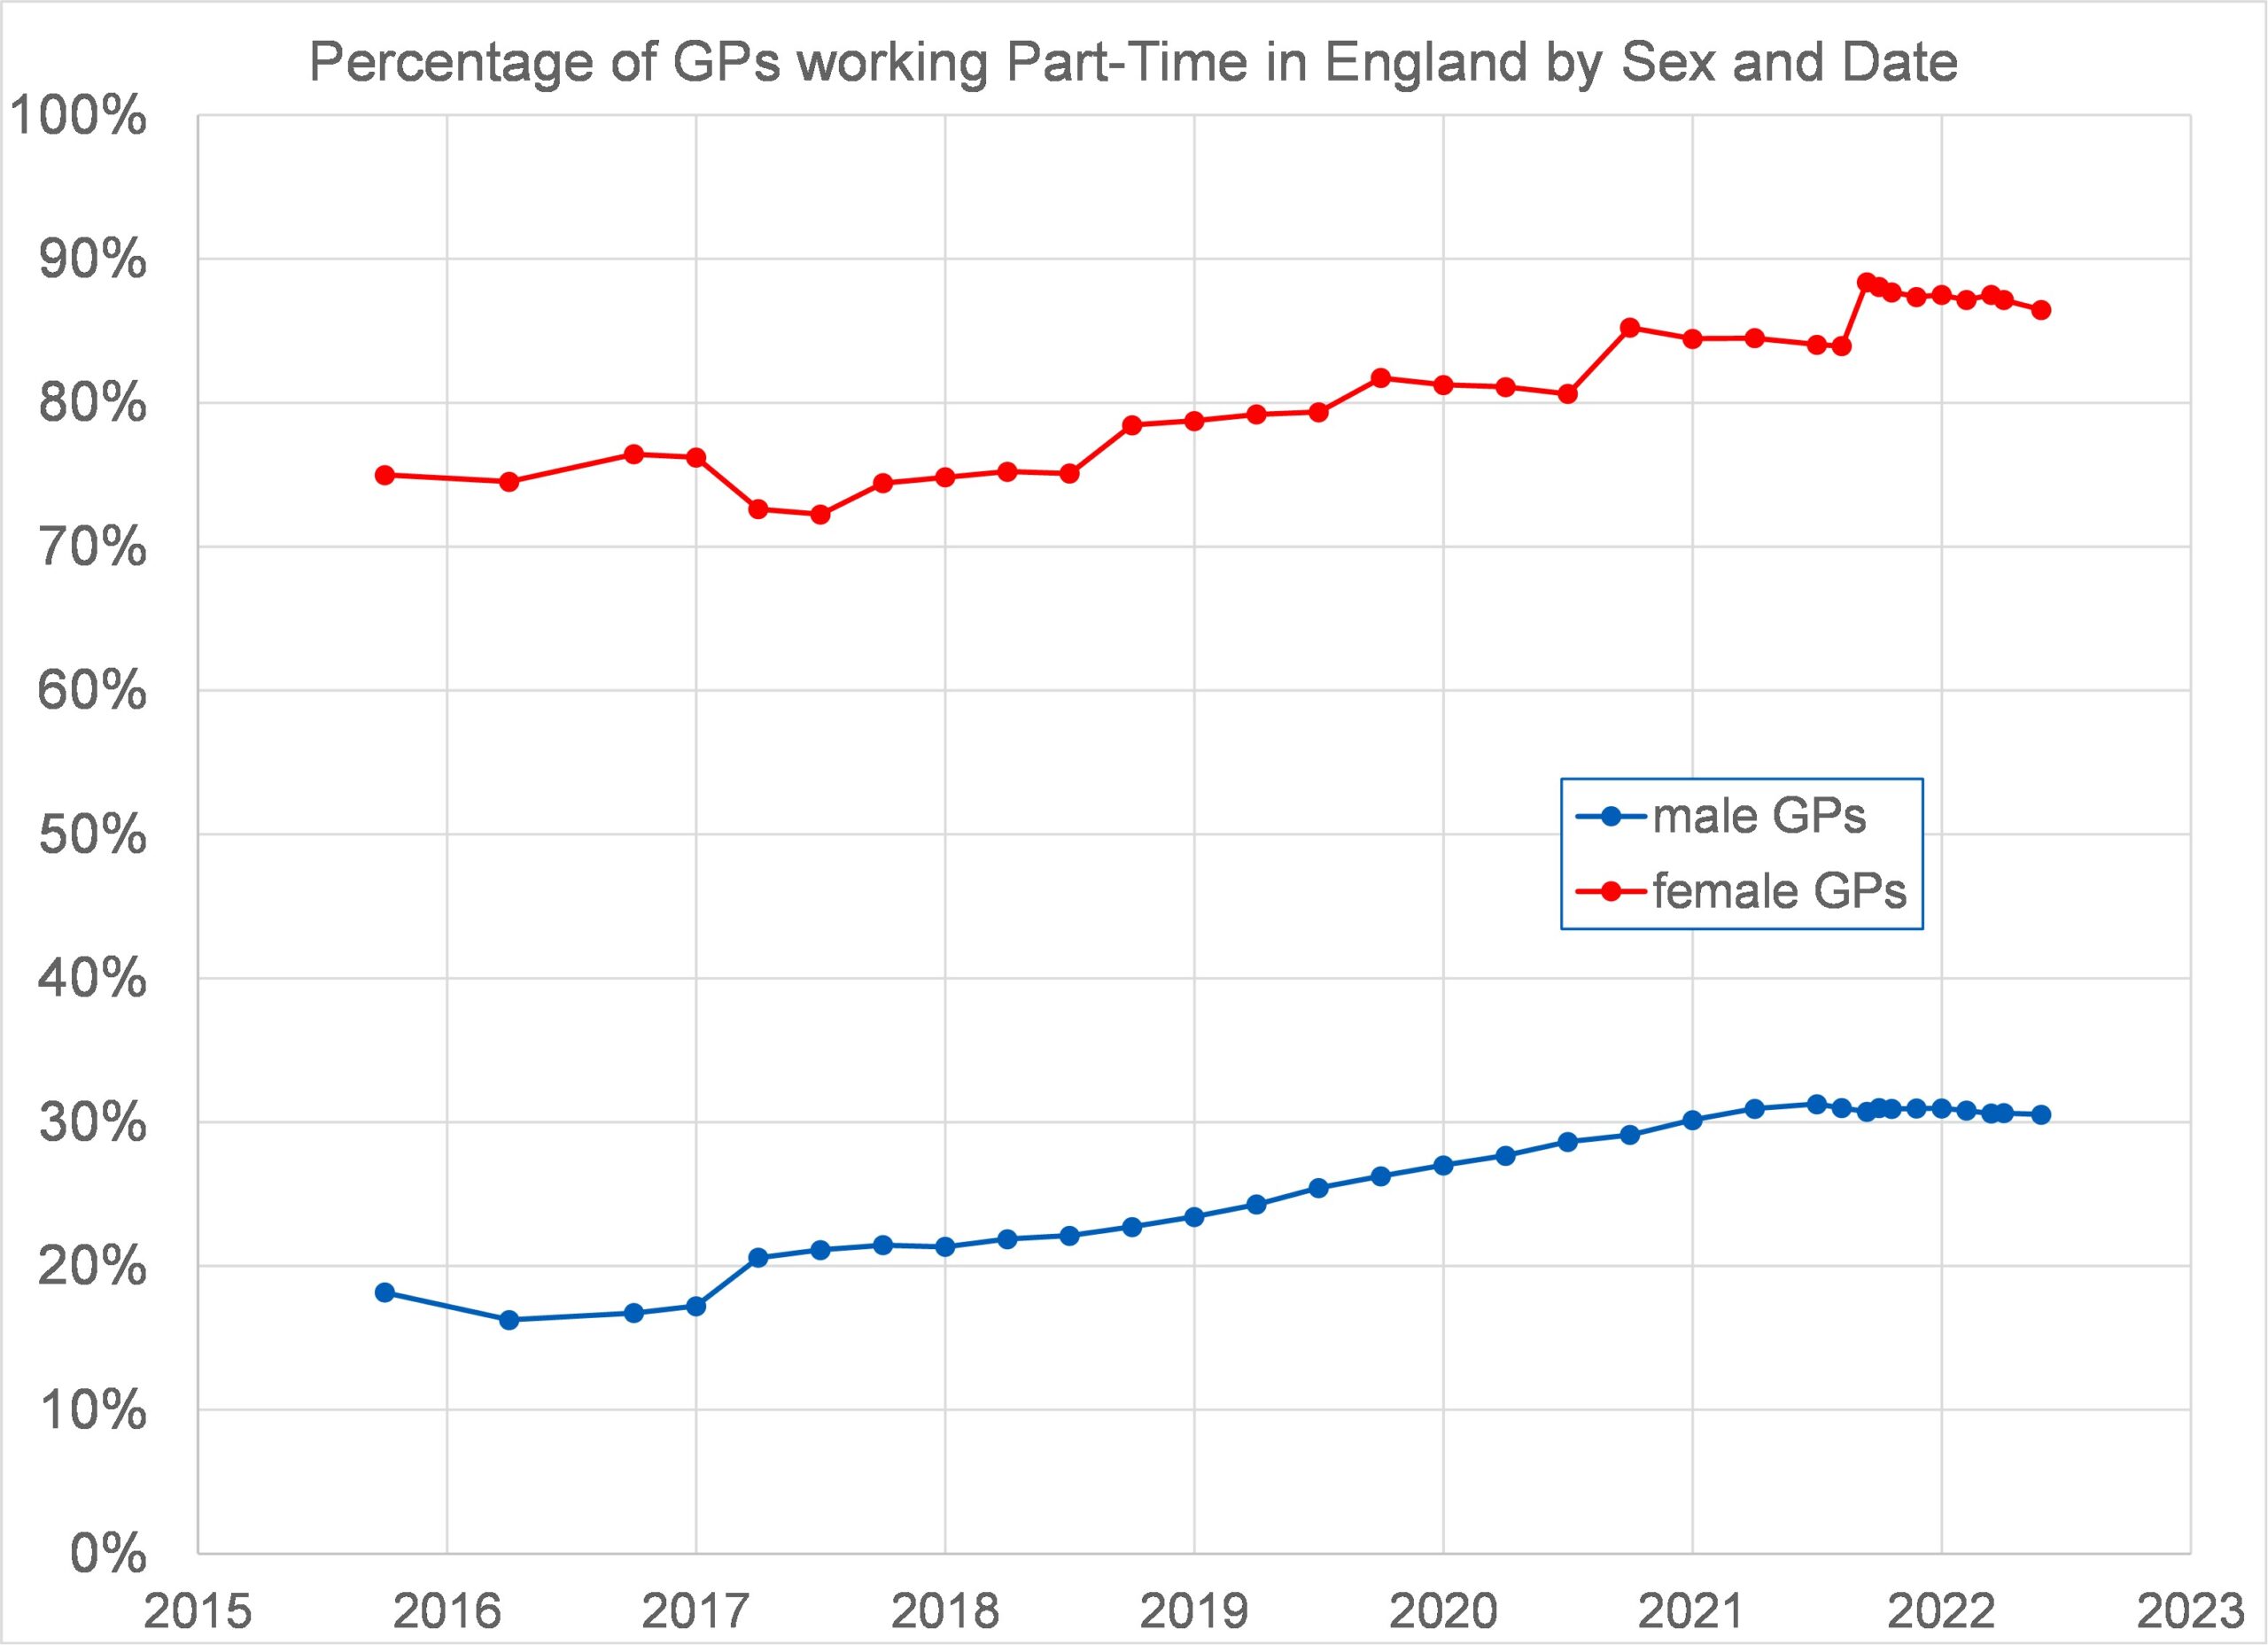
Figure 8 plots against year an estimate of the percentage of GPs working part-time, by sex, between 2015 and 2022. This uses the data for total headcount (N) and full-time equivalent (FTE) from dataset General Practice Workforce, 30 April 2022 – NHS Digital sheets 1a and 1b and estimates the percentage of part-time working based on the simplifying assumption that (a) all part-time working is exactly half full time, and, (b) working in excess of full time can be neglected. The fraction of part-time workers is then 2(N – FTE)/N. Both sexes have shown an increase in part-time working. 30% of male GPs worked part-time in 2022. For women GPs this was a staggering 86.5%. Overall, 62% of GPs were working part-time in 2022.
Despite women GPs outnumbering male GPs by 35% in 2022, women only account for 6.7% more FTEs due to more women GPs working part-time. The average male GP is putting in 25% more working hours than the average woman GP.
Figure 9 shows that the number of patients per GP has not changed much over the period 2015 – 2022. In contrast the number of patients per full-time equivalent GP has increased by 15% over the period, due to a combination of the increased population and the decreased number of FTEs. The latter is despite the increase in the number of GPs and is due to an increased proportion of GPs working part-time.
Using General Medical Council data for England and Scotland in 2016, Table 1 shows how GPs working patterns breakdown. Fewer than 20% of GPs have a single contract for permanent full-time working, compared with 46% who have a single contract for part-time working (either permanent or locum). The low percentage of single-contracted full-time GPs is only partly due to the large number of single-contracted part-time GPs. It is also due to the large percentage (34%) of GPs with two or more contracts. (Some GPs with multiple contracts may work more than one FTE, but many will still work less than one FTE in aggregate). The majority of GPs holding multiple contracts are women (roughly twice as many as men).
This GMC source indicates that in 2016, in England and Scotland, the number of licensed female GPs under 50 exceeded the number of licensed male GPs under 50 by 55%.
In 2016 in England and Scotland, of those GPs with a single, permanent, part-time contract, 61% were women. However, single contract part-time working, whether permanent or locum, accounts for less than 46% of the total number of GPs. The full extent of part-time working is obscured in these data due to multiple-contract working, much of which will also be part-time even in aggregate.
| Working Pattern | Number of GPs | Percentage of those with known contract type(s) |
| All registered GPs | 54,024 | – |
| Part-time permanent, only | 11,441 | 27.2% |
| Part-time locum, only | 7,811 | 18.6% |
| Full-time, permanent | 8,341 | 19.8% |
| Two contracts, permanent + locum | 8,077 | 19.2% |
| Two contracts, other types | 3,438 | 8.2% |
| Three contracts | 2,942 | 7.0% |
| No valid data or incomplete data | 11,974 | – |


Wales
Data has been taken from GPs in Wales, as at 30 September 2018 (gov.wales). The main source of data used in that report was the General Medical Services (GMS) census, which is generated from the Exeter (GP payments) system, provided to the Welsh Government through a contract with NHS Digital.
The number of GP Practitioners in Wales gradually increased from under 1,800 in the mid-1990s to around 2,000 in 2010. Since then the number of GP Practitioners has remained largely stable, with small year-to-year changes.
The number of patients per GP has remained stable over the period 2000 – 2018 at about 1,600 (similar to that of England over the last decade or so). FTE data was not obtained.
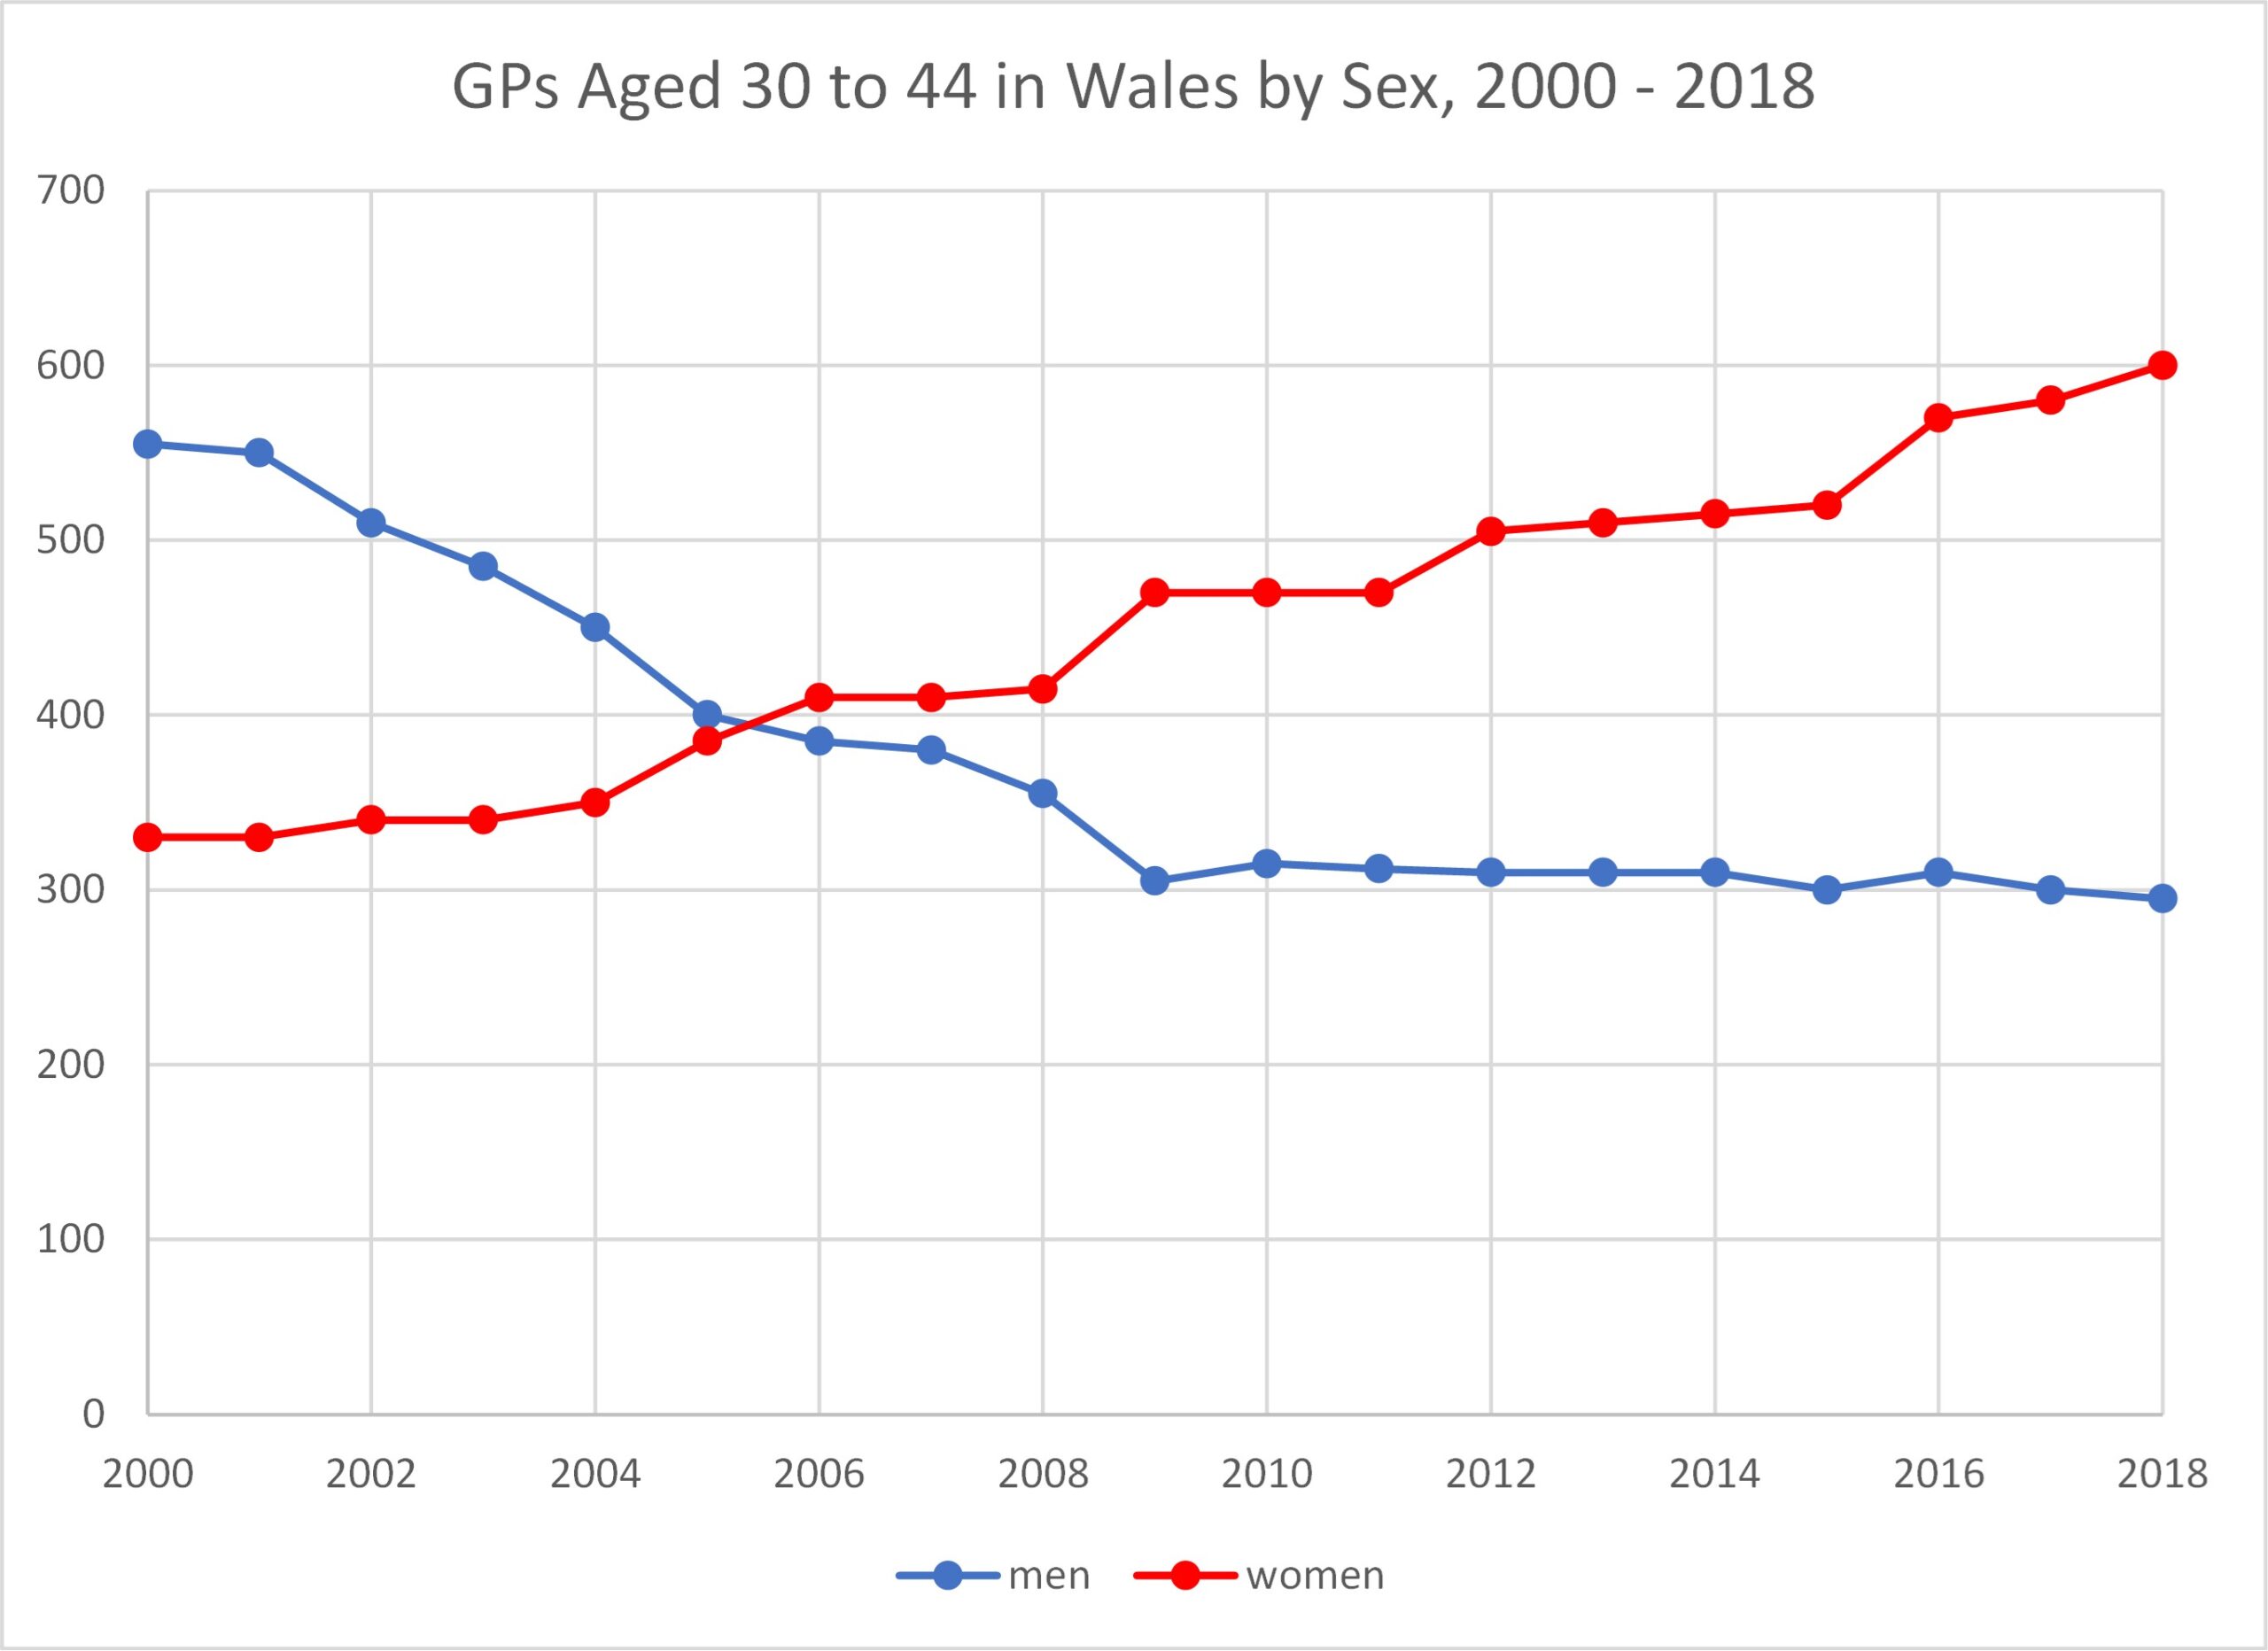
Figure 10 shows the GP headcount in Wales by sex, from 2000 to 2018. Women became the majority of GPs in Wales in 2015. In 2000 there were 2.5 male GPs to every female GP. Between 2000 and 2018 the number of male GPs decreased from 1,280 to 873, whilst the number of female GPs increased from 515 to 1,091 (excluding GP Registrars). If GP Registrars are included, in 2018 the number of female GPs exceeded the number of male GPs in Wales by 32%.
Figure 11 shows how the number of female GPs in the younger age range, 30 to 44, has overtaken the number of male GPs in this age range. By 2018 there were twice as many women GPs as men GPs in this age range.
The number of male GPs in the next age band, 45 to 54, has also been falling and 2018 saw the number of female GPs in this age band overtake the number of male GPs. As of 2018 there were more male GPs only in the oldest age band, 55 to 64. Inevitably this will shortly cease to be the case.
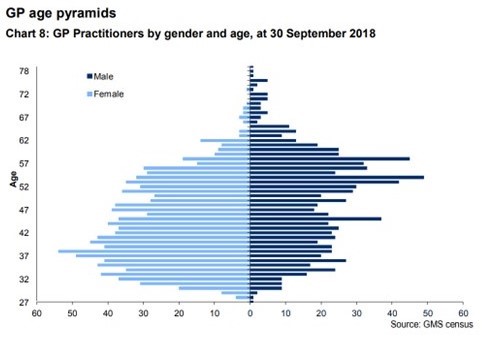
Figure 12 displays the sex-age distribution in Wales as of 2018. It is clear that the dominance of female GPs is certain to increase as the oldest GPs (mostly men) retire and the younger GPs (mostly women) work through the system. New GPs will almost certainly continue to be strongly dominated by women, partly because female medical students outnumber male by 85% now, and partly because women will remain attracted to the part-time working opportunities with high salary. In 2017/18, for every male GP joining practices in Wales there were 2.1 female GPs.

Scotland
Data was taken from About Information Services Division | Bespoke Specialist Services | ISD Scotland unless otherwise stated. This publication derives from Public Health Scotland and its data was obtained by survey.
GP headcount in Scotland was fairly constant between 2009 and 2017 at around 4,453.
The number of registered patients per GP in 2015 – 2017 in Scotland was about 1,250, substantially fewer than in England and Wales.
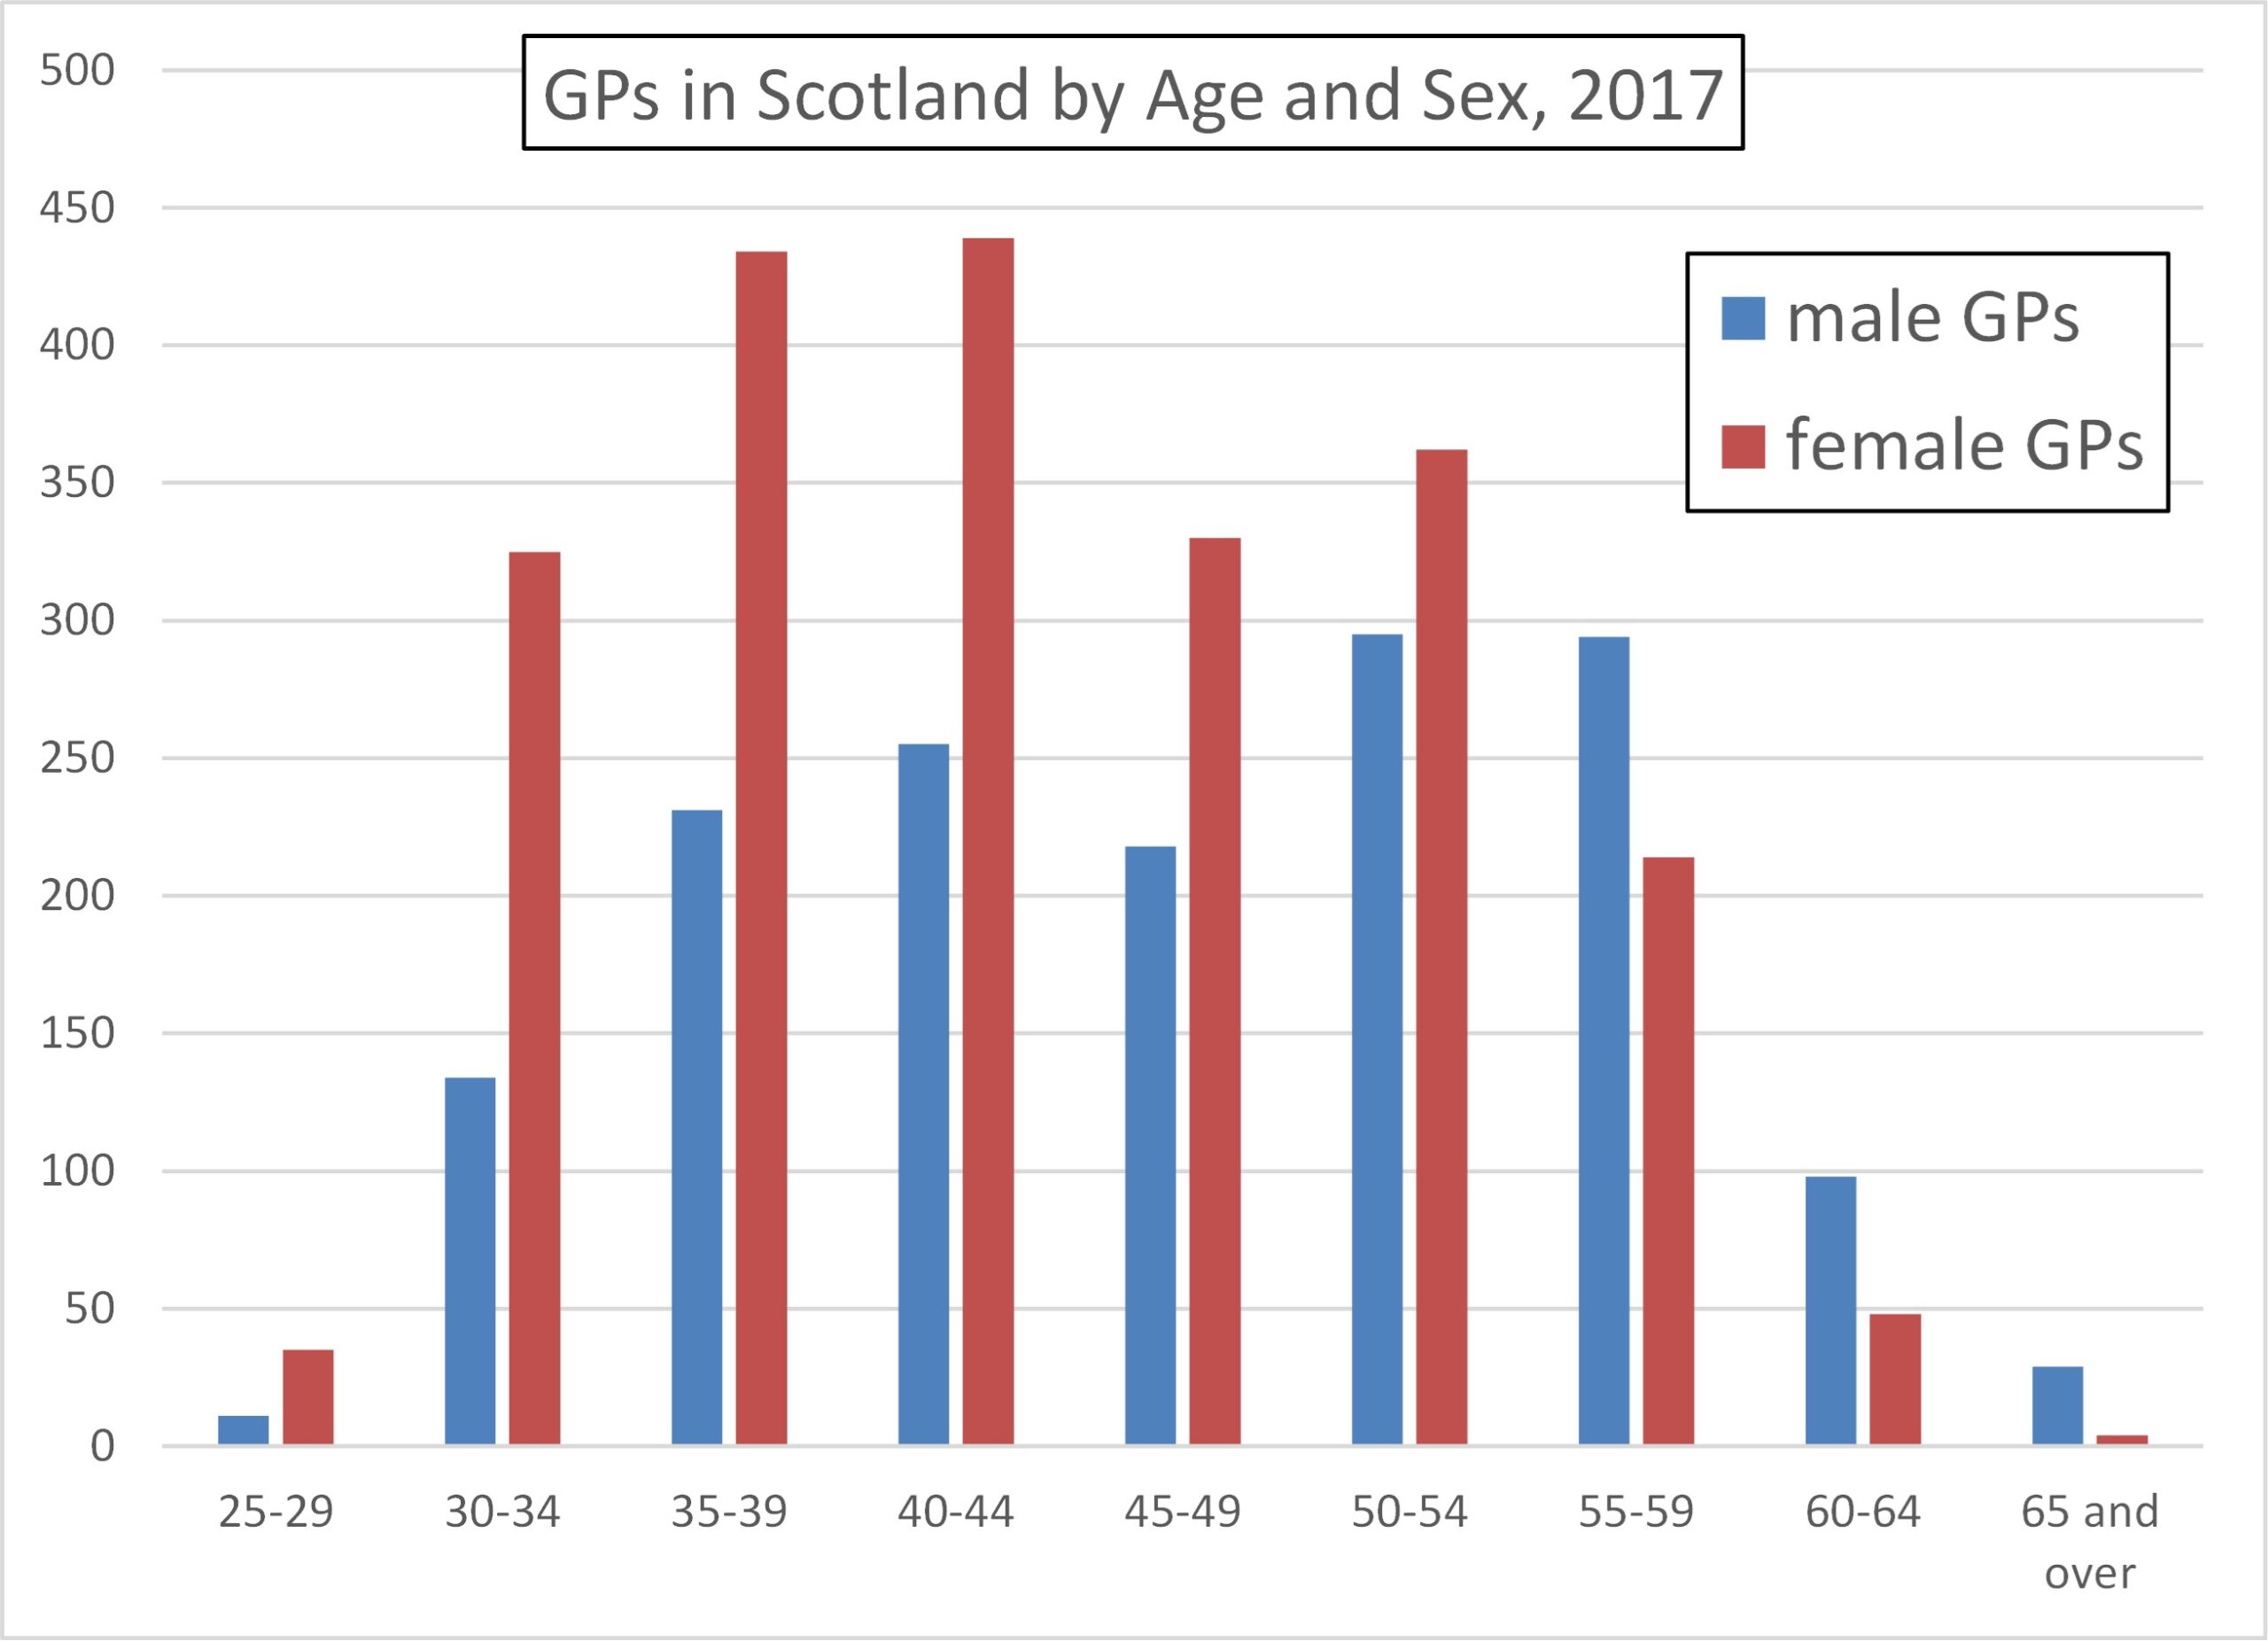
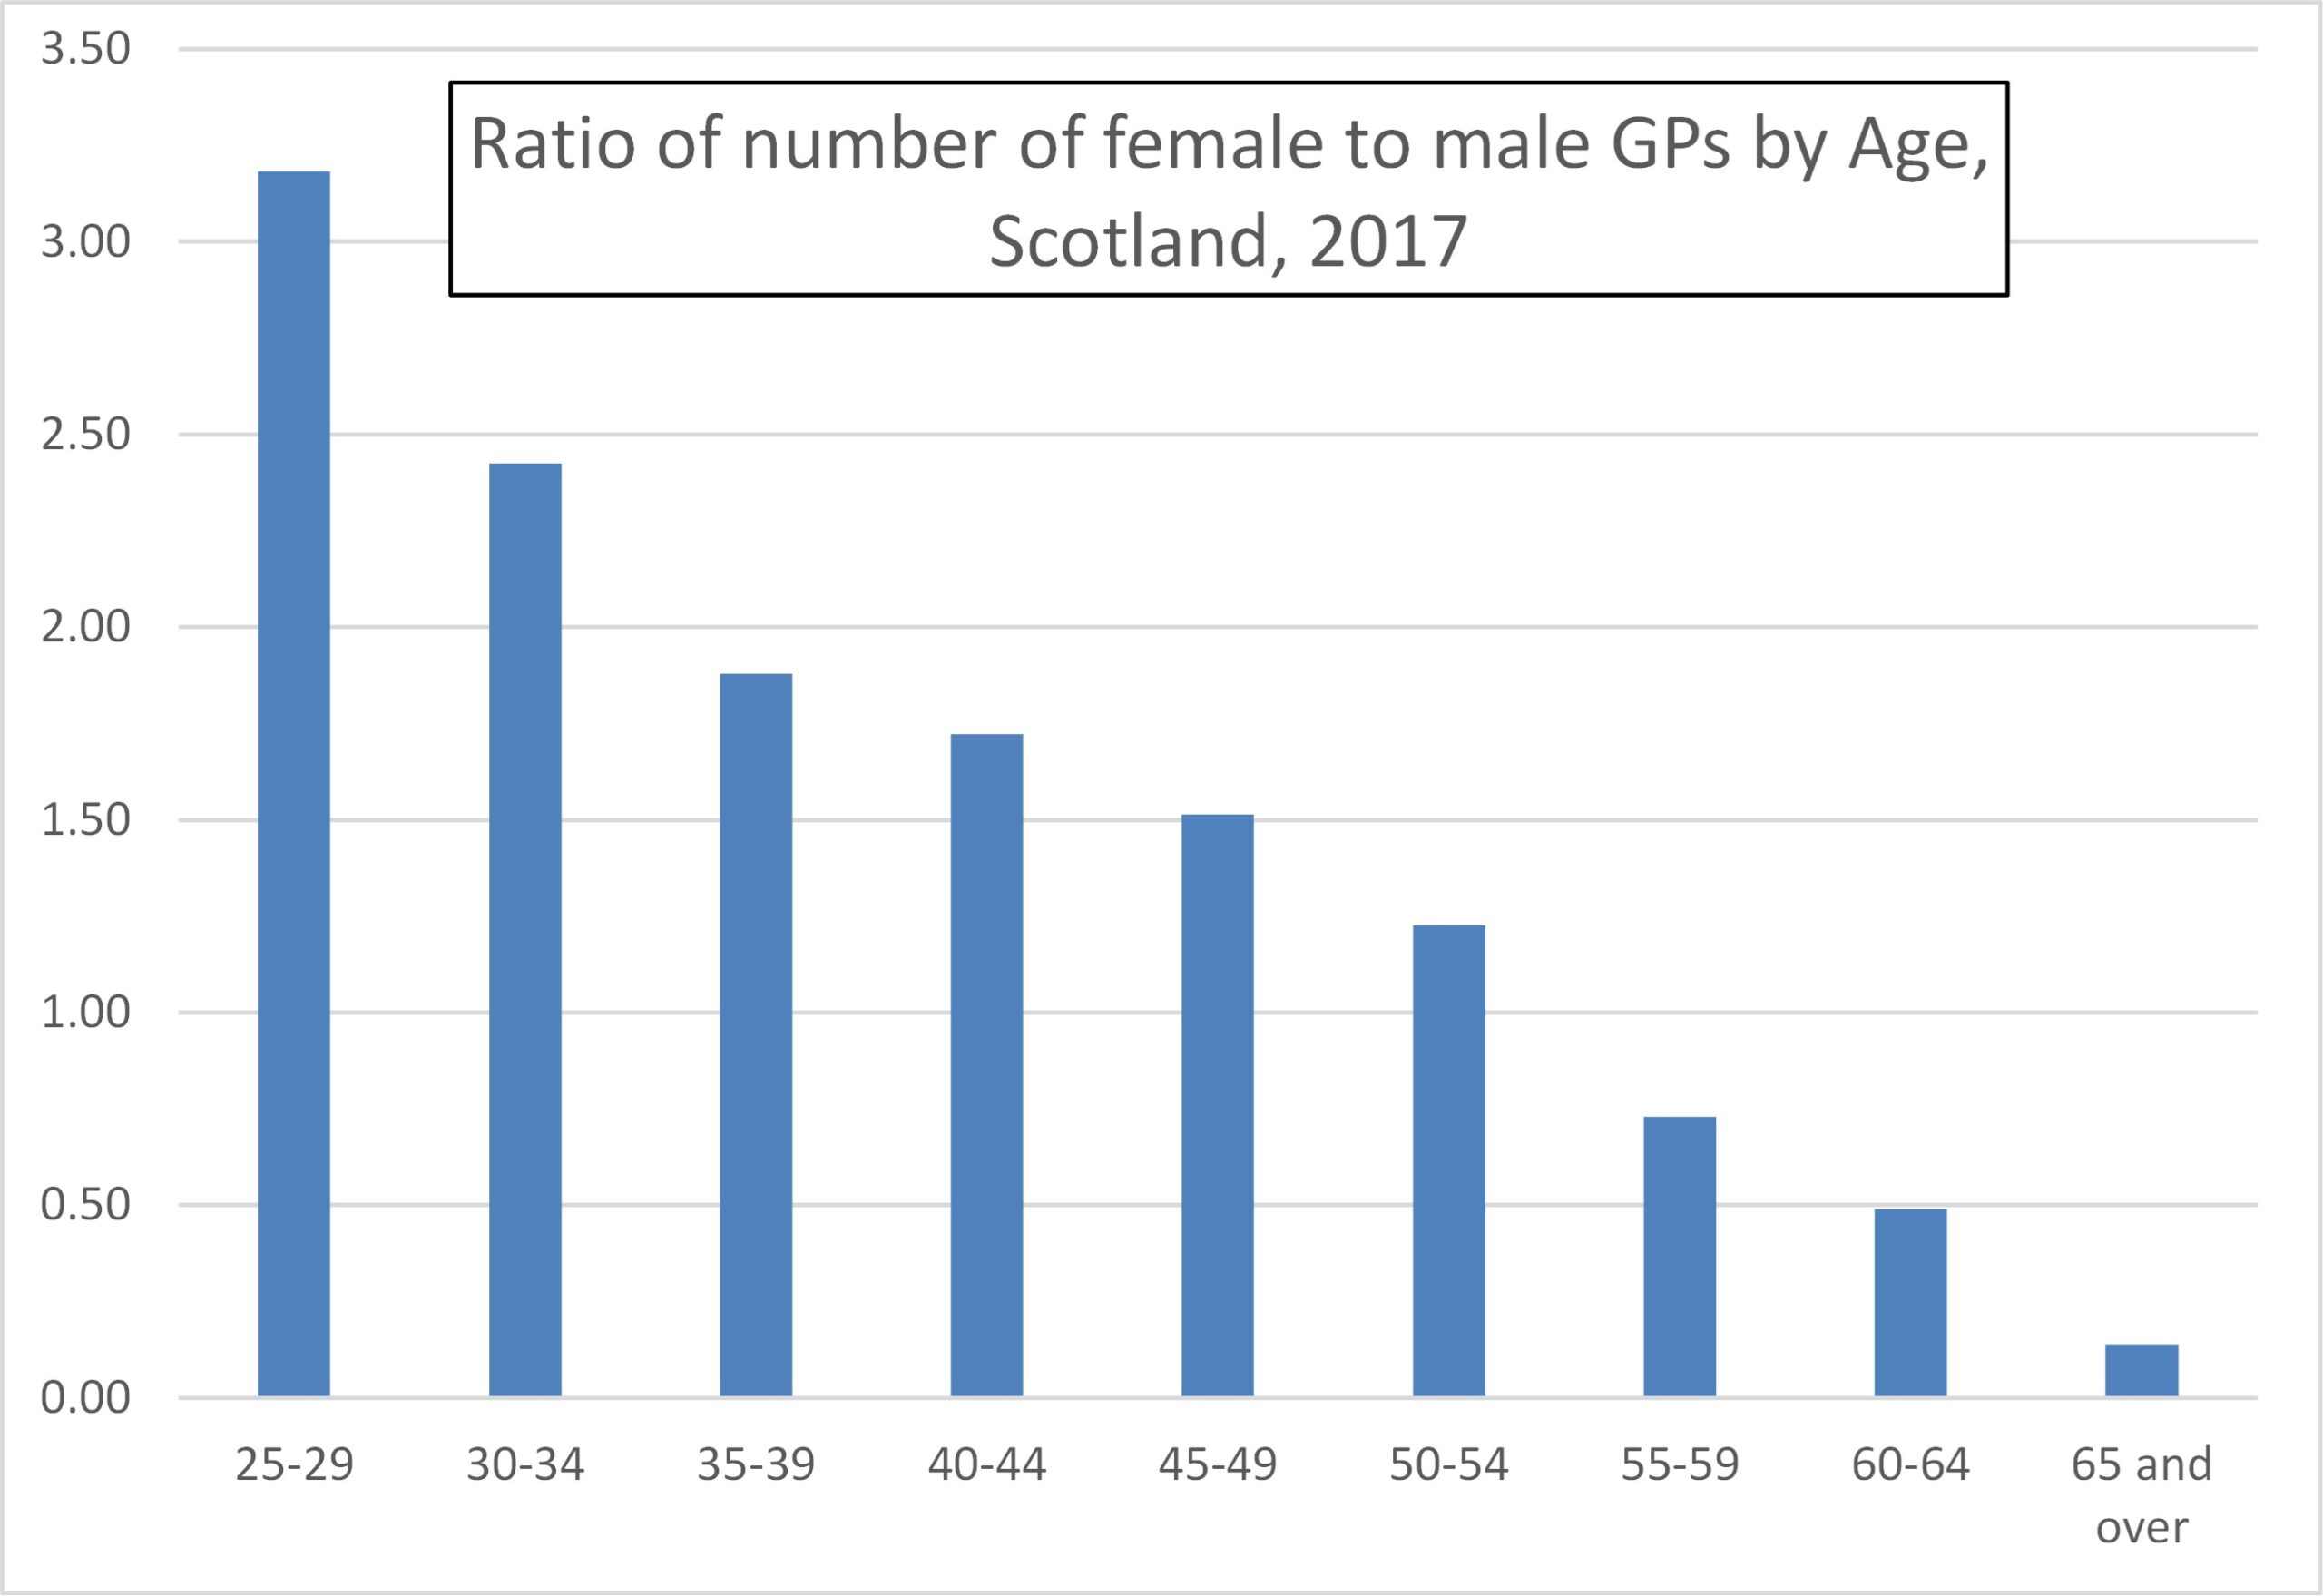
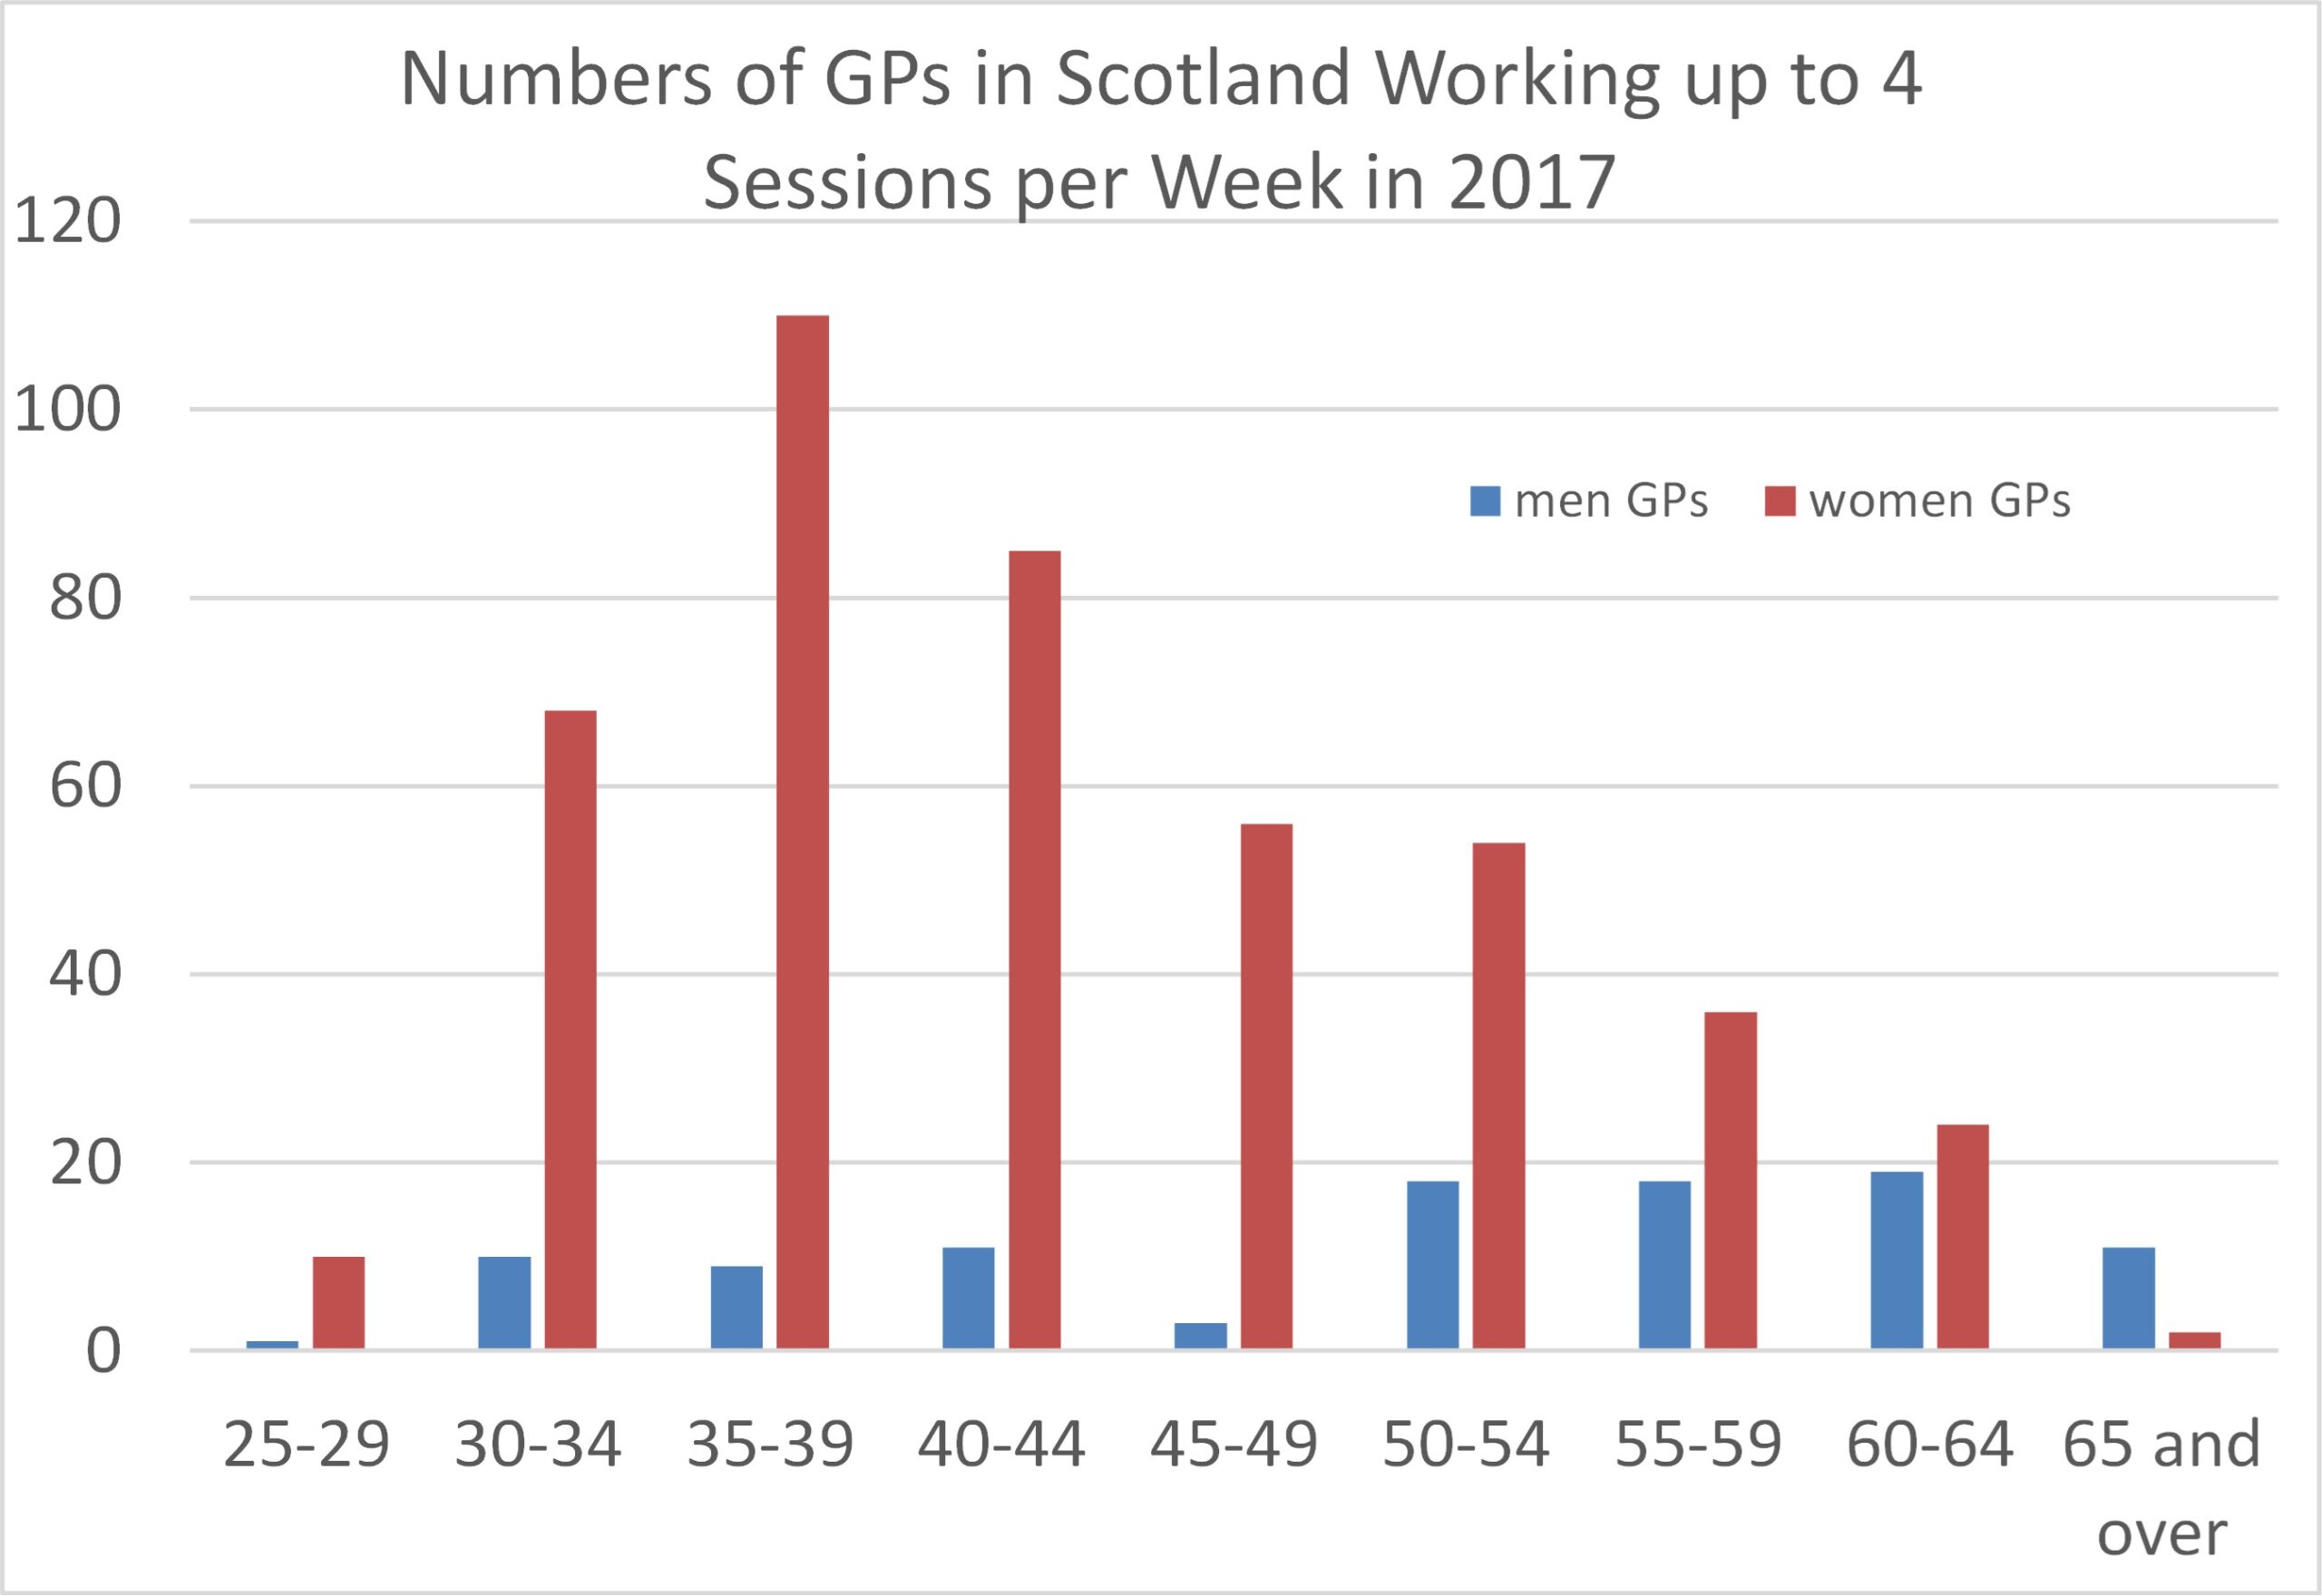
The dominance of women GPs in the younger age ranges is even more emphatic than in England and Wales, Figure 13, with three times more female than male GPs in the youngest age range, Figure 14.
In 2017 there were 40% more women GPs than male GPs, but this will now be substantially greater and is set to reach twice as many women GPs in the next 10 years or so.
GPs’ contract working time is measured in “sessions” which are roughly half-days, or 4 hours. In 2017 in Scotland, despite there being 40% more female GPs, the total number of sessions worked by male and female GPs was the same, a total of 13,300 sessions each.
On the basis that working more or less than 8 sessions defines full-time versus part-time working, the number of GPs working part-time by sex is given by Table 2. A staggering 82.7% of female GPs in Scotland were working part-time in 2017, compared to 34.3% of male GPs. Overall, 62.5% of GPs in Scotland worked part-time.
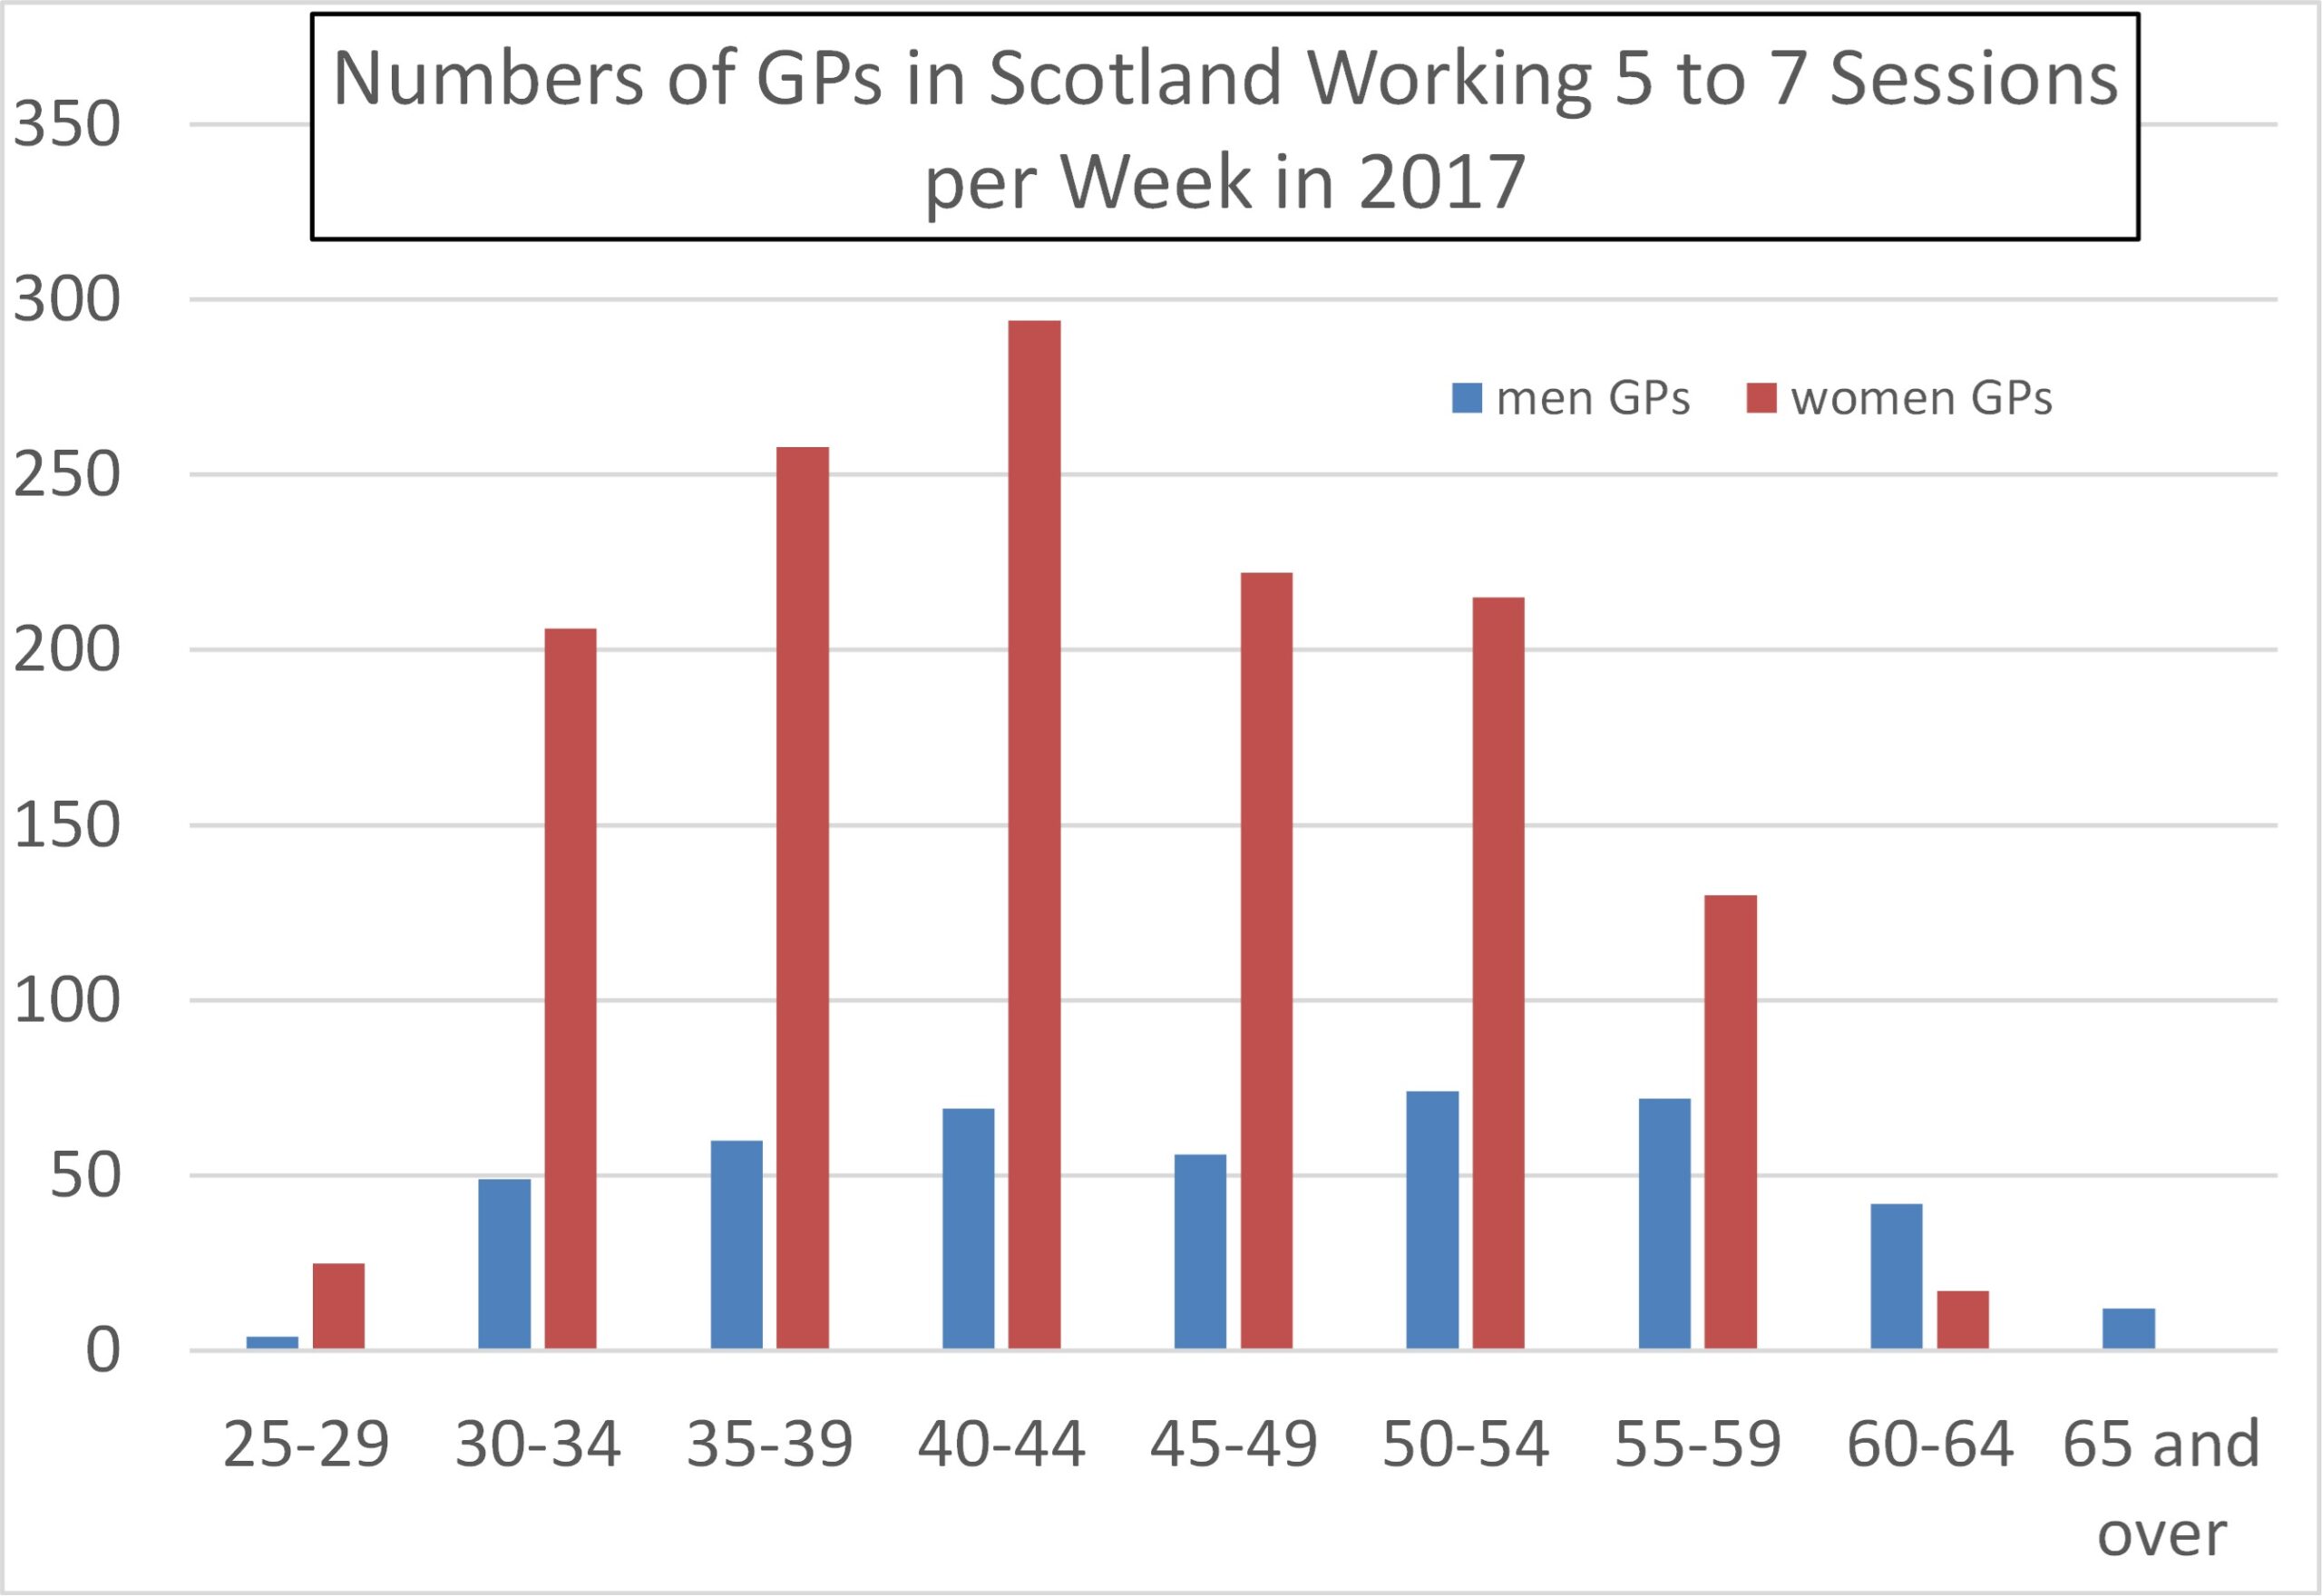
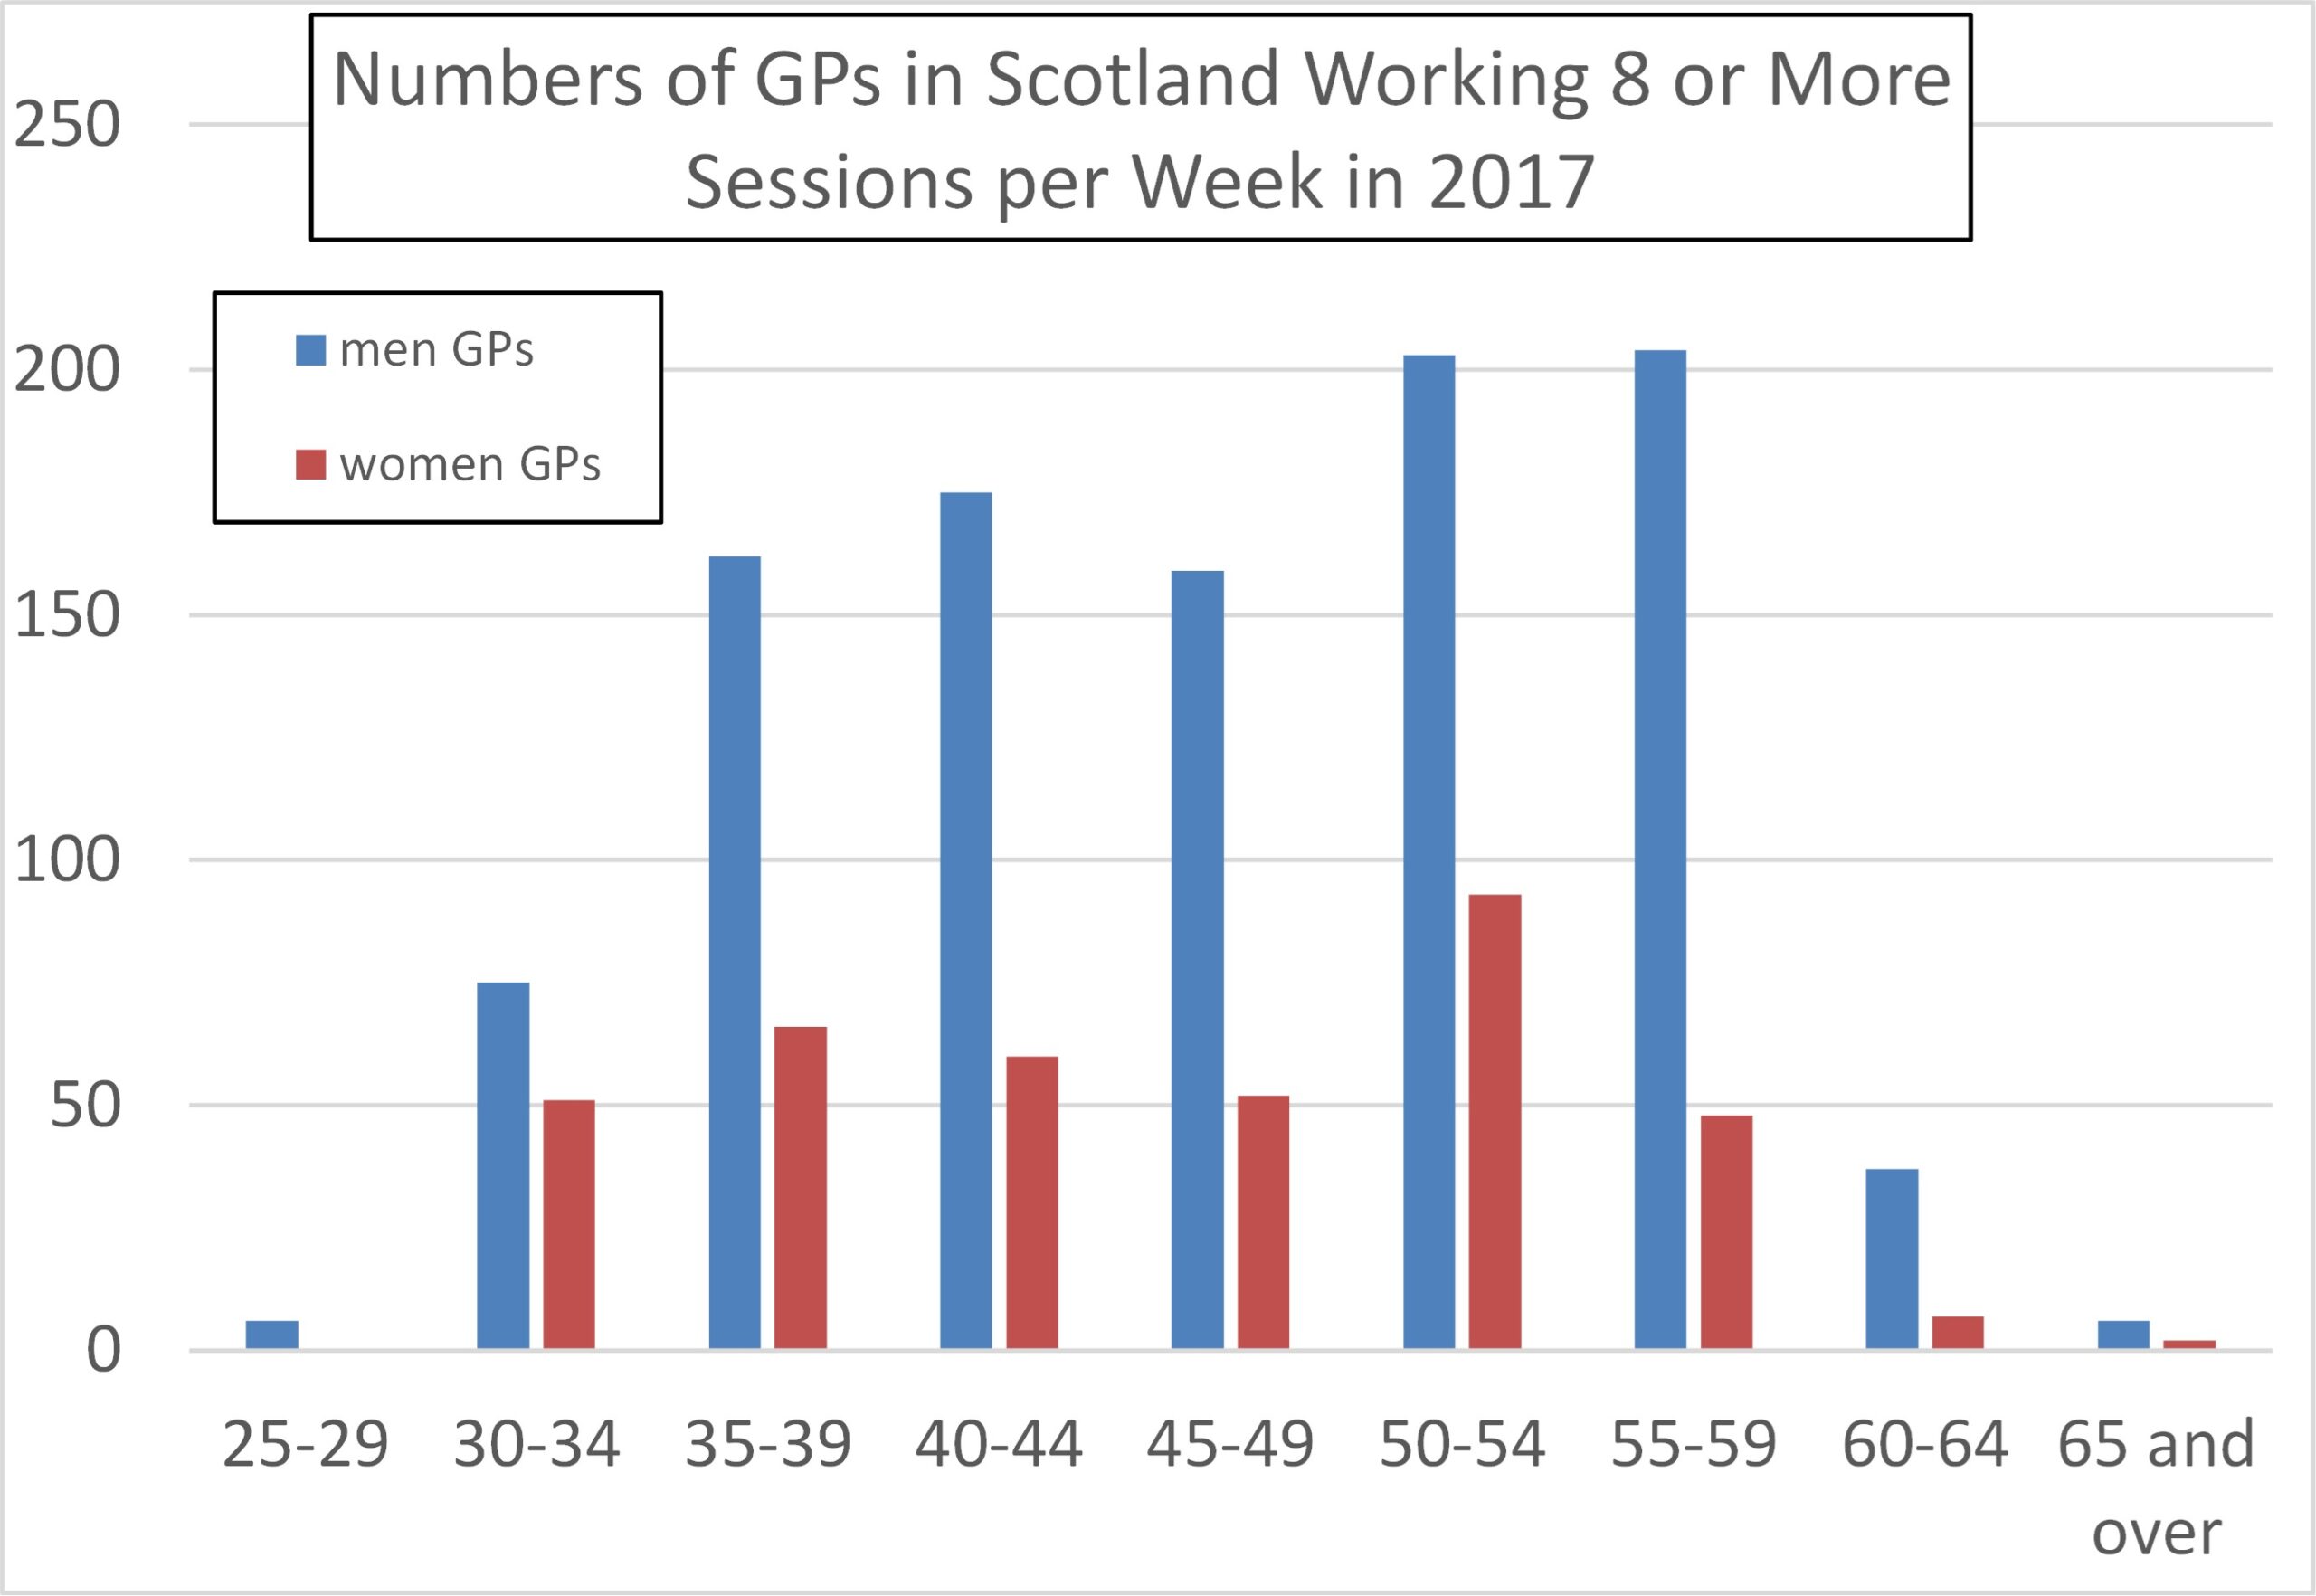
Figures 15 to 17 show that women GPs’ tendency to work part-time persists across all the age ranges (e.g., even in age ranges beyond that likely to be associated with childcare).
| Part-Time | Full-Time | Percentage Part-Time | |
| women | 1,812 | 379 | 82.7% |
| men | 538 | 1,027 | 34.3% |
| all | 2,350 | 1,406 | 62.5% |
Whole UK
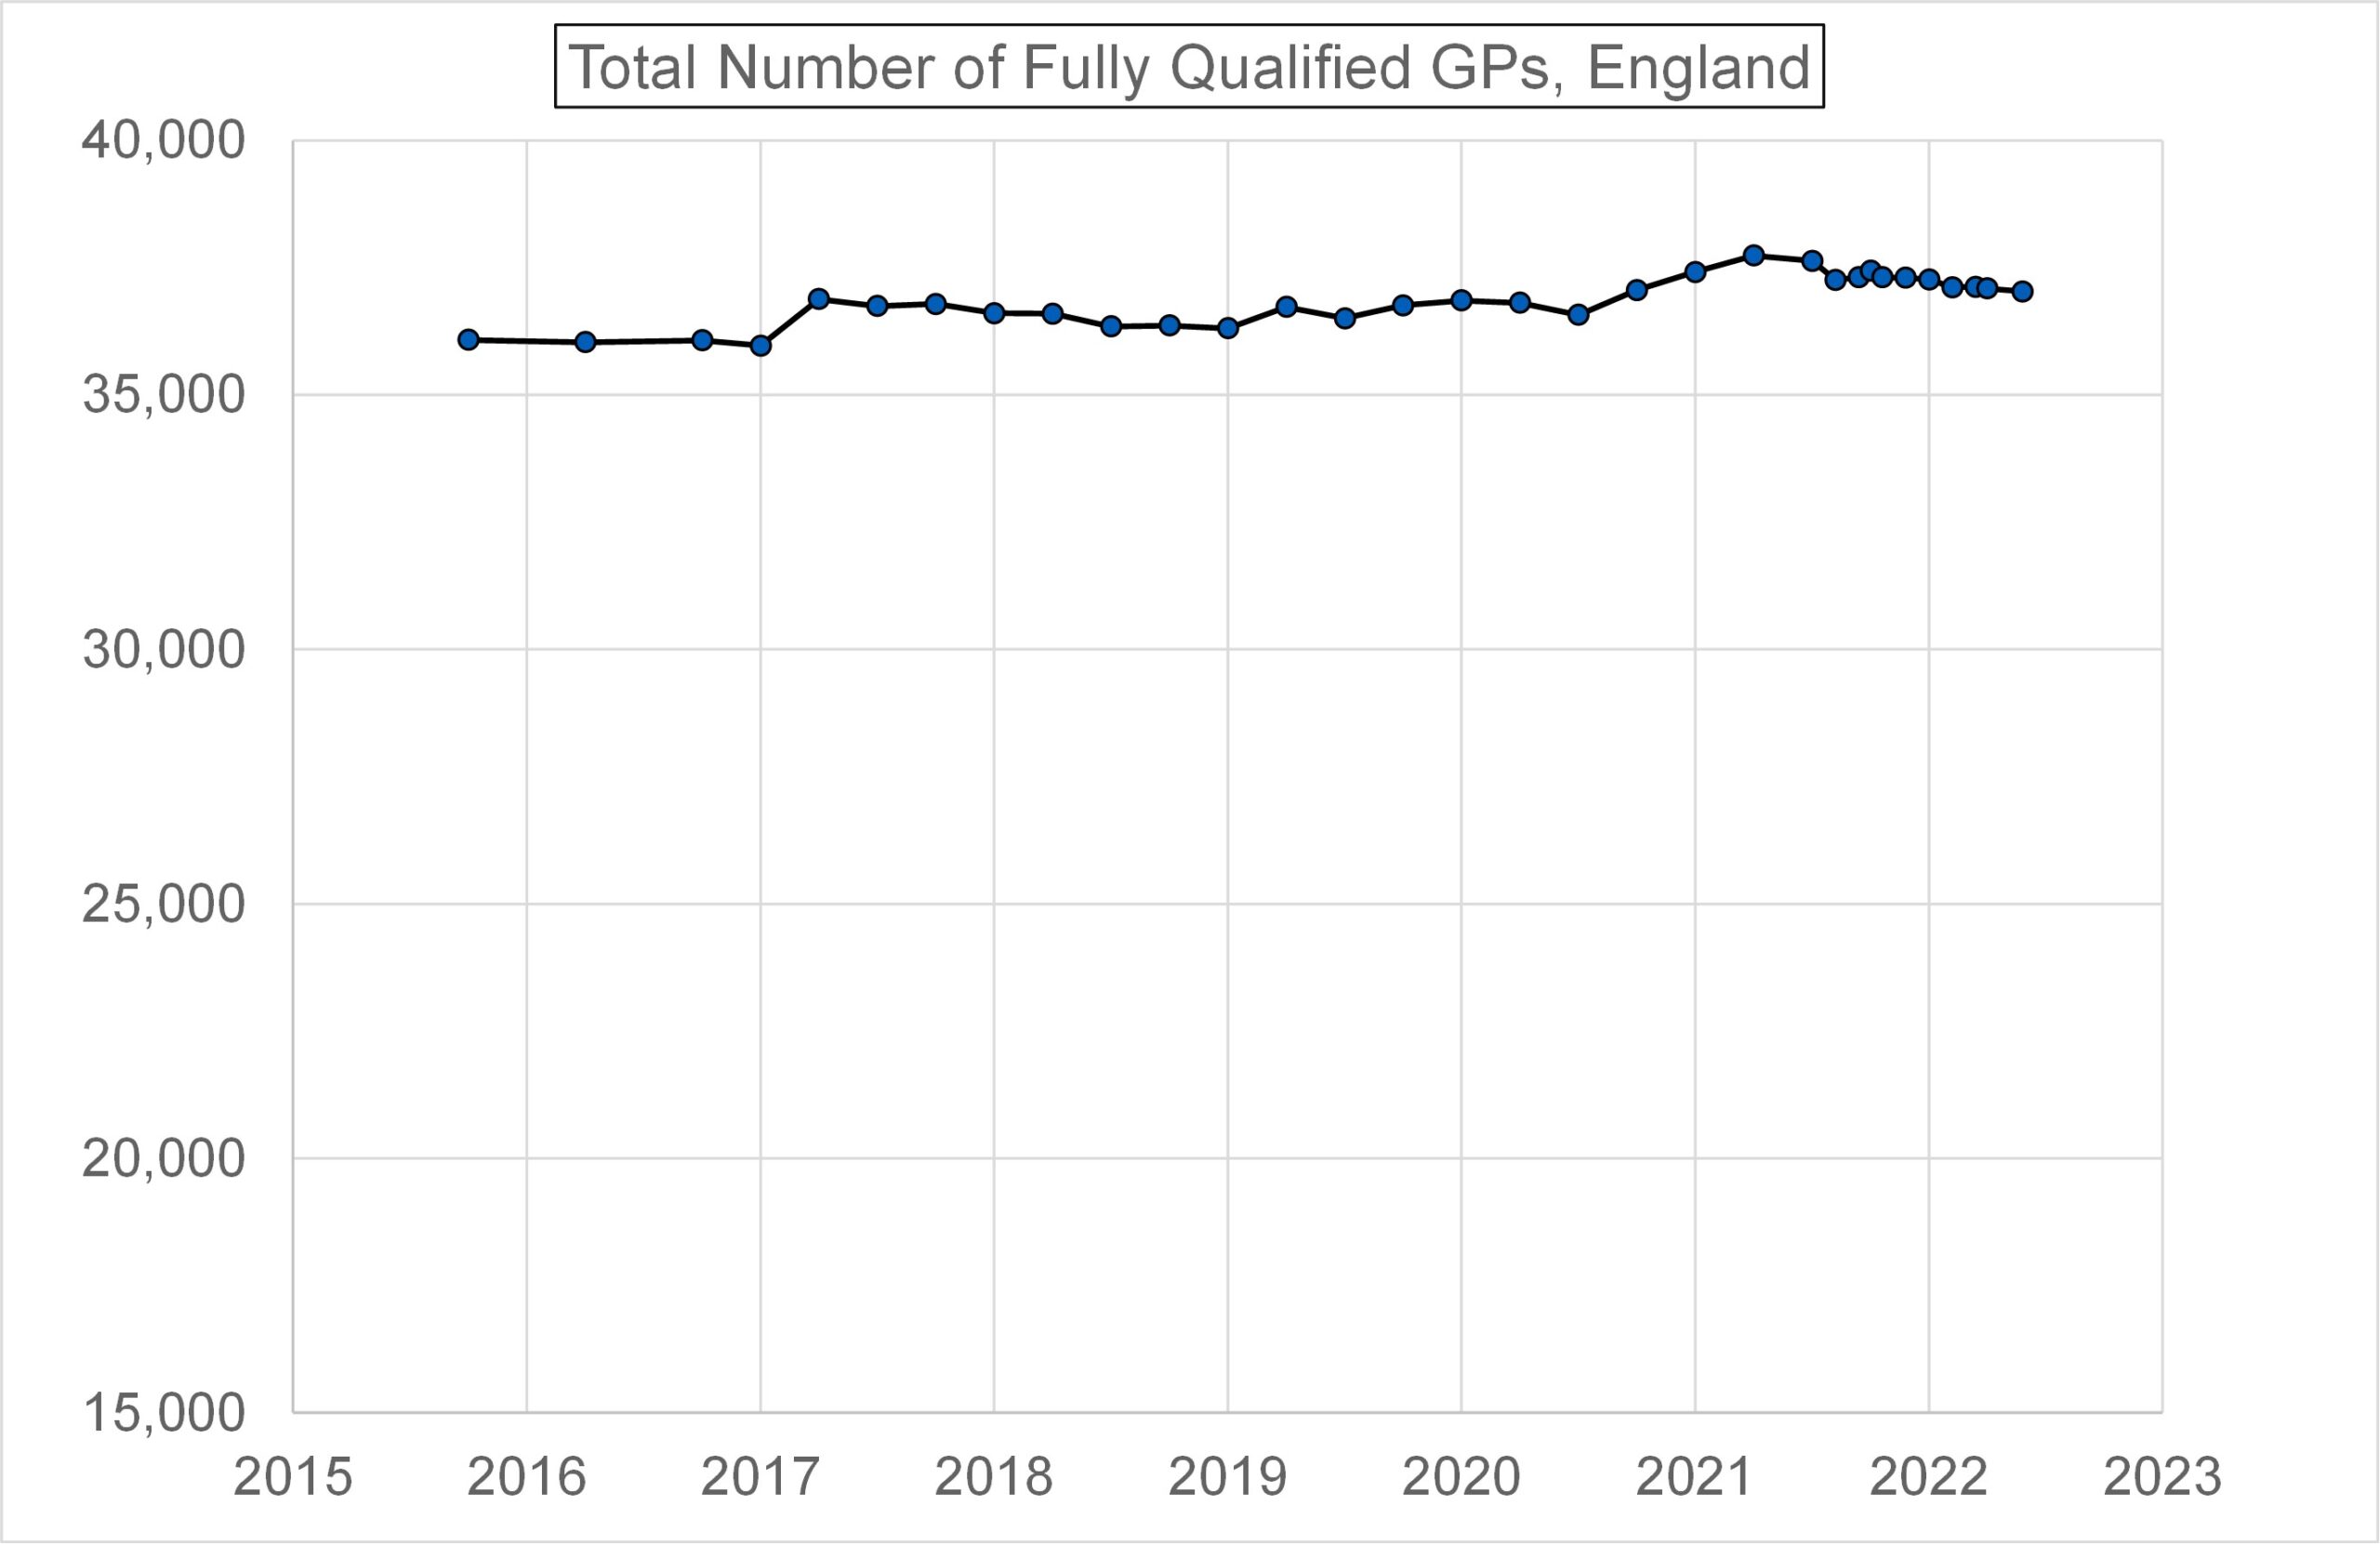
Figure 18 presents data over a longer time-base, from 1964 to 2014. It shows that the number of qualified GPs per registered patient has increased markedly over this period, though there has been a small drop-off over the last decade. Nevertheless, in 1970 in England there were 2,500 registered patients per qualified GP compared with around 1,600 in 2022.

Summary
In England the number of fully qualified permanent female GPs exceeded the corresponding number of male GPs before 2015 (this includes full and part-time working).
By 2022 the number of fully qualified permanent female GPs exceeded the corresponding number of male GPs by 35% (this includes full and part-time working).
The average male GP in England is putting in 25% more working hours than the average woman GP.
In 2022 in England the overall percentage of GPs working part-time was 62%. For women GPs the figure was 86.5% and for male GPs 30%.
In Scotland in 2017 the figures were similar, with 82.7% of female GPs working part-time compared to 34.3% of male GPs. Overall, 62.5% of GPs in Scotland worked part-time.
In England and Scotland combined in 2016, fewer than 20% of GPs had a contract for permanent full-time working as their sole contract.
In England and Scotland combined, in 2016, the number of women GPs under 50 years old exceeded the corresponding number of male GPs by 55%.
In 2017 in Scotland, despite there being 40% more female GPs, the total number of sessions worked by male and female GPs was the same, a total of 13,300 sessions each.
In Wales, women became the majority of GPs in 2015. In 2000 there were 2.5 male GPs to every female GP. By 2018, the number of female GPs had exceeded the number of male GPs in Wales by 32%.
By 2018 the number of female GPs in Wales in the age range 30 to 44 was double that of male GPs of the same age.
In England the number of patients per GP has not changed much over the period 2015 to 2022. In contrast the number of patients per full-time equivalent GP has increased by 15% over the period, due to a combination of the increased population and the decreased number of FTEs. The latter is despite the increase in the number of GPs and is due to an increased proportion of GPs working part-time.
Over a long time base, 1964 to 2014, the number of GPs per registered patient increased markedly in all UK nations, though there has been a small drop-off over the last decade in England. Nevertheless, in 1970 in England there were 2,500 registered patients per qualified GP compared with around 1,600 in 2022.
In summary, a far larger proportion of women GPs work part-time than male GPs. Also the proportion of women GPs has increased steeply over the last few decades, especially in the younger age ranges.
So, to answer the question posed in the introduction – yes, it is true that GPs’ part-time working has increased markedly and this is indeed attributable mostly to women GPs.
Even where the headcount of GPs has not changed much (which is broadly the case in the last 10 to 20 years) this means that the FTE has reduced due to an increasing proportion of GPs working part-time. This means there is less GP time available per patient than there was, despite GP headcount numbers not having fallen.
Does it also mean more pressure on GPs? Yes and no. The position is this,
- If I choose to work part-time that may mean less pressure on me;
- But by working fewer hours myself, it puts more pressure on my colleagues.
The pressure is, in fact, being displaced to hospital A&E departments – where male doctors still predominate, incidentally.
Figure 18 is a rather stark indication of the pressure on GPs having reduced over the last half-century, as least as regards the size of their patient lists. To add to this is the huge reduction in GP pressure due to the 2004 ‘new contract’ and its virtual elimination of out-of-hours working (unless by separate contract).
As noted in the introduction, the old workaholic male GPs in the 60s and 70s, whether you approve of their working practices or not, were providing a social service that has died along with the respect that was their due.
The prognosis is that these trends will certainly continue and get much worse – because the dominance of women GPs at younger age ranges is even more emphatic, and greater still for new GPs. The proportion of GPs working part-time will therefore continue to increase, and, if GP numbers remain fairly static, the total hours worked by GPs will fall. So the time available to spend with patients will reduce further still.
And, as Kathy Gyngell remarked, the men are now (inevitably) being attracted increasingly by the option to work part-time. It’s an attractive option when you can earn enough to live comfortably by working part-time – a luxury not afforded to most people who can barely manage financially when working full-time.
It is worth recalling whence this situation originates. Partly it is women’s choice to work as a GP in preference to hospital work. But largely it is due to there being an increasing proportion of women doctors, which in turn is due to the dominance of women as medical students…..and this is due to the relative failure of boys in education.
So – what few will say is this – next time you can’t get a GP appointment you might like to reflect on the ideological neglect of boys education over many decades.
You can have feminist equity, but there is no law of the universe that says you can also have a functioning healthcare system or a thriving national economy.
*******
Noted added 11/6/22: A question arises as to how many full-time equivalent GPs are lost due to part-time working, and how much does this cost the country in terms of the expense of training GPs who do not work full-time?
A rough estimate can be made assuming 43,453 working GPs (i.e., with current contracts) in the UK. There is a 35% excess of female over male GPs, making 24,962 women GPs and 18,491 male GPs. 86.5% of female GPs work part-time, so this is 21,592 of them.
Now I introduce the very crude approximations (i) that all part-time GPs work exactly half an FTE, and, (ii) all full-time GPs work exactly 1 FTE. (The latter ignores those GPs working more than 37.5 hours per week).
On this basis women GPs work 21,592 x 0.5 + 3,370 = 14,166 FTEs in the UK. The amount of GP effort “lost” due to women working part-time is thus 24,962 – 14,166 = 10,796 FTEs.
The number of male GPs working part-time is 0.3 x 18,491 = 5,547. So on the same basis as above male GPs work 5,547 x 0.5 + 12,944 = 15,718 FTEs. The amount of GP effort “lost” due to men working part-time is thus 18,491 – 15,718 = 2,773 FTEs.
In total the UK loses 13,569 FTEs of working time from the available, contracted workforce of 43,453 (i.e., 31%). Women GPs account for 80% of this lost time.
The cost of training a GP has been put at £163,000 direct costs plus around 25% of non-recovered student loans (25% of £64,000), making £179,000 per GP. The effective loss of 13,569 GPs due to that shortfall from the potentially available working time if all contracted GPs worked full-time is thus £2.4 billion (of which women GPs account for £1.9 billion).
In addition to this there is the issue of registered GPs (of which there are 54,024) who have not been included in the above estimates because no record of their contract was available in the register (only 80% of registered GPs are accounted for). The General Medical Council admits they don’t understand this disparity. If this missing 20% were all not currently working as GPs (and I have no idea whether this is a good approximation or not) then a further 10,571 FTEs has been lost, amounting to a further £1.9 billion. The total waste might thus be £4.3 billion.