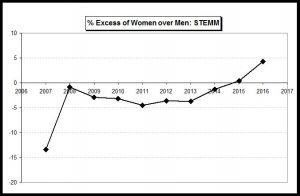
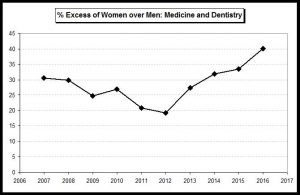
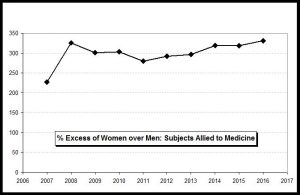
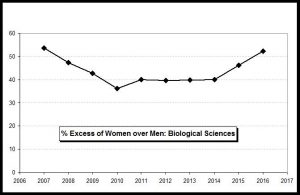
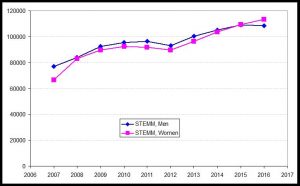
The number of women in STEMM now exceeds that of men (click to enlarge)
This post summarises key data on the gender gap in higher education (HE) in the UK between 2007 and 2016. I looked at the corresponding 2015 data in “Women Dominate in STEMM“. Here I re-confirm that women do now dominate in STEMM. It is nearly a quarter of a century since women overtook men in overall numbers in HE institutions in the UK.
It is important to note the distinction between STEM (Science, Technology, Engineering and Maths) and STEMM (Science, Technology, Engineering, Maths and Medicine).
This post uses acceptance data only. This approximates to numbers entering HE establishments at the start of undergraduate courses. Note that acceptance data will differ from degree attainment data. The higher drop-out rate of men means that the gender gap in favour of women is even more pronounced in degree attainment than in the acceptance data. This is worth bearing in mind throughout. (For example, across all subjects, women outnumber men by 30% in terms of acceptance but by 35% in terms of degree attainment).
All data have been drawn from the following two UCAS sources: “End of Cycle 2016 Data Resources DR3_014_01 Acceptances by subject group and sex” and “DR2_014_01 Acceptances by sex“. The first of these collates acceptance data into 26 subject groups. These subject groups form the basis of the data presented here.
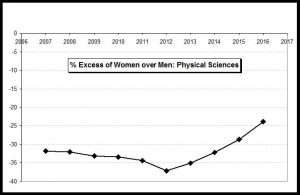
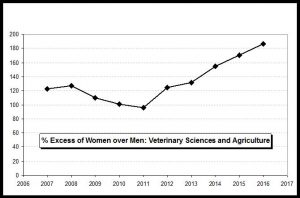
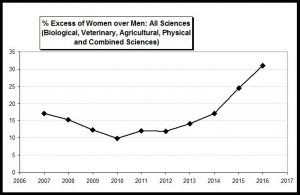
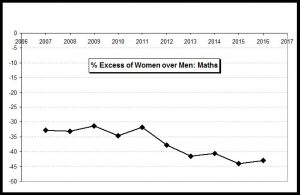
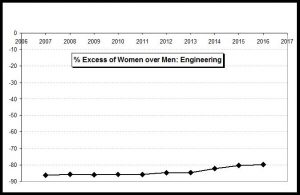
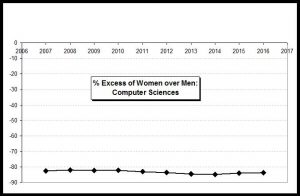
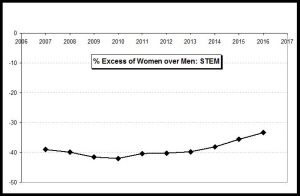
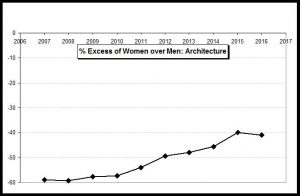
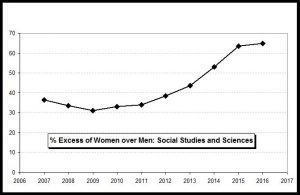
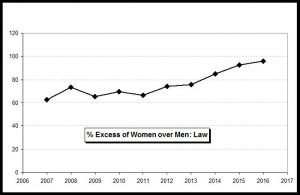
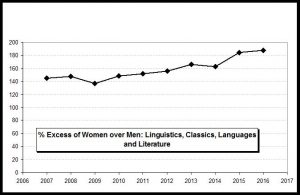
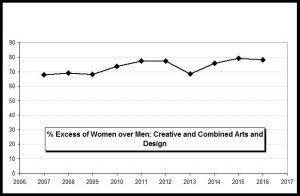
Figures 1 to 18, below, present the gender gap in the form of the percentage excess of women over men, defined as 100(w-m)/m. Where this is negative it denotes an excess of men over women. Care should be taken when interpreting this statistic in those cases where men outnumber women. For example, -80% means that the number of women is 20% the number of men.
It is advantageous to present all the gap data using this same definition, because an upward slope of the curve then consistently indicates an increasing dominance of women or a decreasing dominance of men. Note how many slopes are indeed upwards – whether the gap itself is positive or negative.
A commentary on Figures 1 to 18 is given below. However I first observe some features of the absolute numbers of entrants to higher education…..
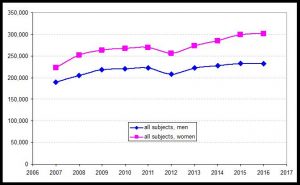
- Across all subjects, Figure 19 illustrates the increasing gap between the number of new male and female undergraduates entering HE annually. The gap has doubled in ten years, from 34,060 in 2007 to 68,940 in 2016.
- Whilst the number of men accepted onto higher education courses has increased by 43,430 between 2007 and 2016, the corresponding increase in the number of women is 80% larger at 78,310.
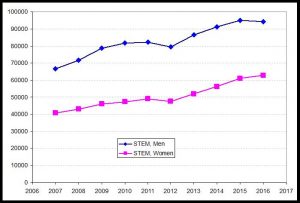
- While there remain substantially more men in STEM subjects, the number of women taking STEM subjects has increased by 55% over the last ten years with the result that the number of women in STEM now is almost the same as the number of men in STEM ten years ago (Figure 20).
- Figure 21 shows the absolute numbers of men and women in STEMM, showing that these have been close to parity for the last nine years – with women just narrowly pulling ahead now.
Even for subjects where women remain in the minority (physical sciences, maths, engineering, computer sciences, STEM), their absolute numbers have generally increased substantially over the last ten years, as shown in Table 1 below,
Table 1
| Subject Group | Increase in number of women students between 2007 and 2016 |
| Physical Sciences | 39% |
| Biological, Veterinary, Agricultural and Physical Sciences Combined | 54% |
| Maths | 41% |
| Engineering | 101% |
| Computer Sciences | 46% |
| STEM | 55% |
| STEMM | 70% |
The number of women taking engineering has doubled in ten years. The absolute number of women taking engineering (5165) is comparable with the number of women taking medicine or dentistry (5325) and considerably exceeds the number of men taking medicine or dentistry (3800).
Commentary on Figures 1 to 18
Figure 1: In medicine and dentistry the gender gap in favour of women is increasing. In view of the much advertised struggle the NHS is having acquiring and retaining doctors, it is unfortunate that we are placing increasing reliance on women doctors, who work far fewer hours over their working lifetime than male doctors. This is a forbidden thought, obviously.
Figure 2: “Subjects Allied to Medicine” covers a wide range of subjects, including nursing, physiotherapy, radiology and pharmacology. This group is strongly dominated by women (over four times as many women as men), Nursing alone is even more strongly female dominated, of course (over 9-to-1).
Figure 3: Women exceed men in the biological sciences by more than 50%.
Figure 4: Men exceed women in the physical sciences, though to a reducing degree (now three women to every four men).
Figure 5: Just five years ago the number of women in veterinary sciences and agriculture was double that of men. Now there are very nearly three times as many.
Figure 6: The majority of the public would, I suspect, think that men dominated women in the sciences. But this has not been the case for decades. Combining the data for science subject groups (biological, veterinary, agricultural, physical and combined sciences) women outnumber men by 30%. This gender gap in favour of women in the sciences has doubled in nine years.
Figure 7: Men dominate in mathematics – and by an amount which has increased over the last ten years. This is the only subject group for which this is true. Contrast this with the number of subjects in which women’s dominance is increasing. Ten years ago there were two women to every three men studying maths, now there is roughly one women for every two men.
Figure 8: Men dominate emphatically in engineering, but to a gradually decreasing degree. The number of women engineers as a percentage of male engineers has increased from 14% to 20% over ten years.
Figure 9: Men also dominate emphatically in computer science, and to a degree which has changed little. The number of women computer scientists as a percentage of male computer scientists is 16%.
Figure 10: Men still dominate in STEM, though to a degree which is decreasing. There are two women in STEM to every three men.
Figure 11: This is the “killer figure”, showing that women have now become dominant in STEMM, though only just. [I reported on this last year, using 2015 data, in “Women Dominate in STEMM“. The STEMM gender gap in this 2017 post is numerically slightly different from that used last year. I’m not sure why, but it is probably due to UCAS adopting a slightly different definition of the subject groups. However, the graphs of STEMM gap versus year are qualitatively very similar, and both confirm that women now dominate, though only narrowly at present].
Figure 12: The only remaining subject group in which men dominate is architecture, though the extent of this dominance has reduced significantly.
Figure 13: This shows data for the combination of a range of social studies and social sciences subject groups. Not surprisingly, women dominate (by 65%). This dominance has more than doubled in seven years.
Figure 14: Ten years ago there were 60% more women reading law than men. Now there are double the number of women as men. Good job there’s no gender bias in our criminal justice system or in our family courts, eh?
Figure 15: The dominance of women in languages and literature is increasing towards three times more women than men.
Figure 16: There are 80% more women than men in arts and design.
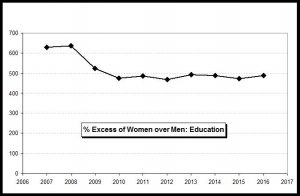
Figure 17: Education is, of course, an area of massive female dominance. For the last eight years there have been six times more women than men starting studies in the education subject group. Could this be related to the dominance of women in higher education generally? Wash my mouth out!
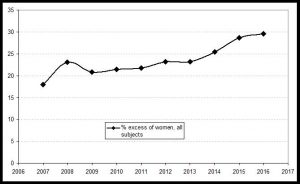
Figure 18: Across all subjects, there are 30% more women than men entering higher education institutes. This overall gender education gap in favour of women has nearly doubled in ten years. (As noted above, in terms of degree attainment the gap is greater still, at ~35%).
FIGURES (click to enlarge)
Figure 1
Figure 2
Figure 3
Figure 4
Figure 5
Figure 6
Figure 7
Figure 8
Figure 9
Figure 10
Figure 11
Figure 12
Figure 13
Figure 14
Figure 15
Figure 16
Figure 17
Figure 18
Figure 19
Figure 20
