Contents
Modern Slavery – Adults; Child Exploitation; Child Abuse; Perpetrators of Child Abuse
Modern Slavery – Adults
You will recall the annual CPS VAWG reports. These are the reports in which Violence does not mean violence, Women does not mean women, Girls does not mean girls, and conviction for a rape-flagged charge does not mean convicted of rape. VAWG, you will recall, is a category of crime. The victims may be men or boys. The offence may not be violence. You may think that there is an intention to mislead here. I couldn’t possibly comment.
One of the categories of crime within the VAWG umbrella is Modern Slavery & Human Trafficking. You may think that this mostly involves women and girls being exploited as prostitutes. Well a lot of it does – but most does not. The 2018/19 CPS VAWG report includes data from the National Referral Mechanism (NRM) which records potential victims (you have to dig deep into the Appendices to find it). In 2018/19 men and boys outnumbered women and girls by 52% (3,874 cf 2,544).
In the Modern Slavery & Human Trafficking category, between 2017 and 2018 the number of women and girls sexually exploited increased by 7% to 1,725. But the number of men and boys exploited for their labour increased by 71%, to 3,525 – twice as many. Bear in mind these data are within a report titled “Violence Against Women and Girls”.
In 2018/19 there were 219 convictions for Modern Slavery & Human Trafficking. This is a larger number of convictions than in previous years.
In July 2019, eight people – five men and three women – were convicted and sentenced to prison for an average of nearly eight years each. The gang were described as the biggest modern-day slavery network ever exposed in the UK. Their victims were mainly Roma, from Poland. The gang came to the UK specifically to traffic their fellow countrymen. The number of witnesses (i.e., victims who were identified and testified) was variously reported as being between 80 and 92. Different reports estimate different total numbers of victims, most of whom were not identified, up to 440 in total.
How many of these 440 victims were men? I recall radio news reports at the time referring to the victims as “people”. But it would seem that all but one were men, to quote this BBC source,
“The only woman known to have been enslaved by the gang sits in a red parka, her arms clamped between her legs, as she relates a trafficker’s threat to her:…..”
Child Exploitation
The ONS have just released, for the first time, a compendium of data on child abuse: Child abuse extent and nature, England and Wales: year ending March 2019. The associated data files are here. The report combines data from several different sources. One of these is the CSEW (Crime Survey for England & Wales). This survey is completed by adults (16 and over) and hence relates to adults recalling abuse to which they were subject as a child (i.e., historic abuse). I have some major misgivings about such data, especially as it relates to relative male and female victimisation – of which more later. However, in this section – on child exploitation – the data is taken from the NRM, which relates to contemporaneous reports of child victimisation. “Child” means someone aged 17 or younger. “Exploitation” within the context of NRM data can be taken as synonymous with “a victim of modern slavery”.
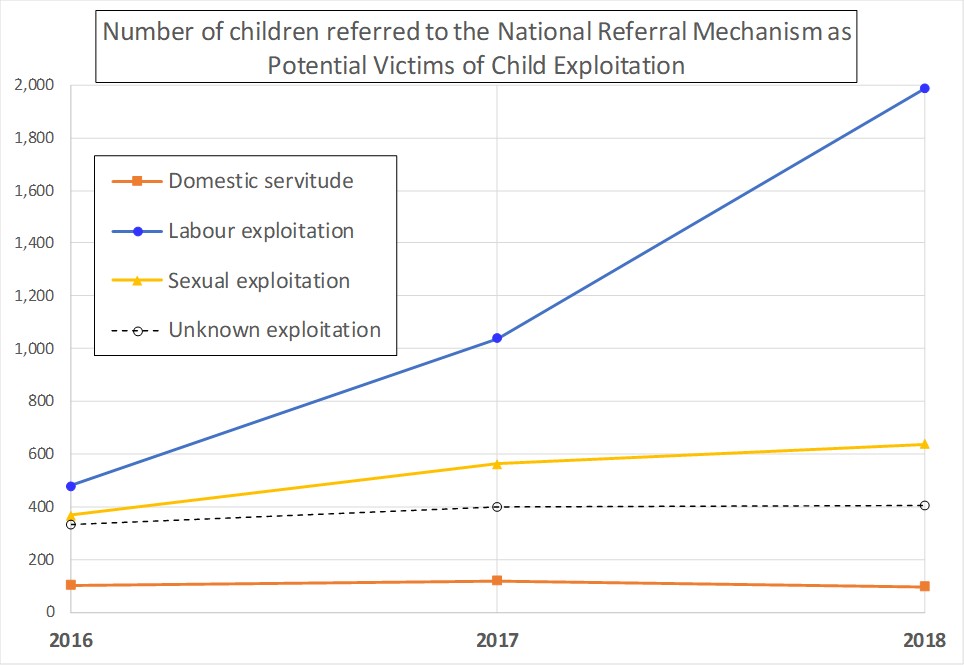
Figure 1 shows the numbers of (identified) exploited children in the UK in calendar years 2016, 2017 and 2018 by category. As for adults, it is the forced labour category which is largest and has increased fastest (by far).
Table 1 breaks this down by sex (for 2018). Boys are ten times more likely to be involved in exploited labour than girls. Girls are five times more likely to be involved in sexual exploitation than boys. But, overall, the number of exploited boys exceeds the number of exploited girls by 155%.
These are not all trafficked children. 45% are UK nationals.
Whether children or adults, it seems that modern slavery is a gender issue to the net disadvantage of males. Not something one hears the media promulgating.
Figure 1: from this Table 35

Table 1: Number of children in UK referred to the NRM as potential victims of exploitation, by sex, year ending December 2018 (total regardless of nationality) – from this Table 36.
| Type of Exploitation | boys | girls |
| Domestic servitude | 52 | 44 |
| Labour exploitation | 1,805 | 182 |
| Organ harvesting | 4 | 0 |
| Sexual exploitation | 105 | 532 |
| Unknown exploitation | 282 | 122 |
| TOTAL | 2,248 | 880 |
Child Abuse
I will focus here on contemporaneous data, not testimony from adults reporting historic child abuse (for reasons I will elucidate shortly).
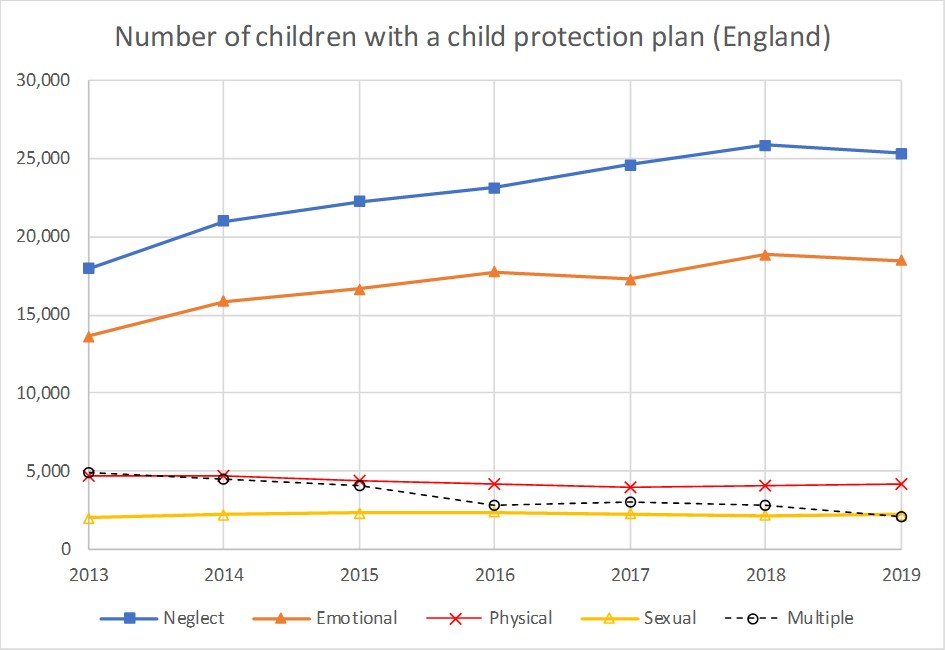
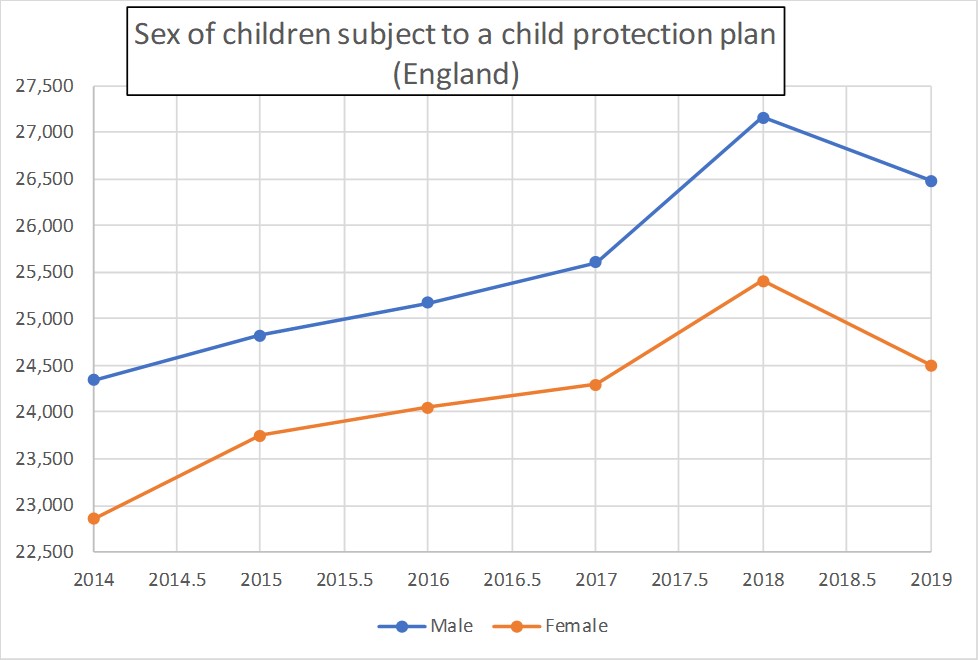
The number of children with a protection plan, by category of abuse which made it necessary, is shown against year in Figure 2. This is the same data as shown in histogram form at the head of my previous post Children in Need: Statistics (England). Figure 3 gives the breakdown by sex. Boys outnumber girls by 8%.
The latest data on the number of children “in care” (i.e., looked after by a local authority) is 30,770 boys and 27, 450 girls (summing England and Wales from these Tables 23 and 31), an excess of boys of 12%.
Figure 2: from this Table 13

Figure 3: from this Table 14

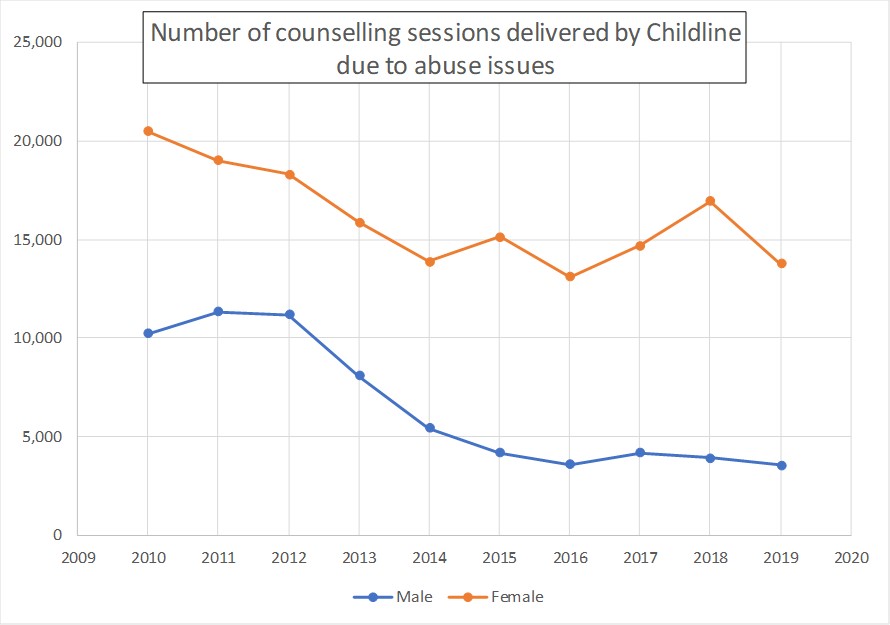
I have drawn attention to these care and protection plan statistics in my previous post but I do so again because I wish to point out the contrast with Figure 4. This plots the number of counselling sessions delivered by Childline as a result of abuse issues, by sex of recipient. There used to be twice as many sessions delivered to girls: now there are nearly four times as many. In view of boys outnumbering girls in the care and protection plan data, this is odd.
Figure 4: from this Table 38

Perpetrators of Child Abuse
This is the one case where I use data from adult reports of their abuse as children. The data in Table 2 was taken from NAPAC (National Association of People Abused in Childhood). It indicates that there is little difference between perpetration of child abuse by mothers and fathers. Mothers were responsible for 24% and fathers for 27%. So parents as a whole account for about half of child abuse.
However, the striking thing about Table 2 is that adult women report well over three times as much historic childhood abuse as do adult men. This stands in stark contrast to the evidence from protection plans (Figure 3), where there are more boys than girls. This may indicate that adult women are more likely to recall childhood abuse – or that men are less likely to interpret childhood experiences as abuse. For this reason I regard the gender-split of adults reporting historic abuse as unreliable, and this must apply to the CSEW data. (I will be happy to hear alternative interpretations).
Table 2: from this Table 46.
| Alleged Perpetrator | Male Complainant | Female Complainant |
| Mother | 200 | 806 |
| Father | 242 | 881 |
| Step-mother | 8 | 15 |
| Step-father | 33 | 243 |
| Others | 467 | 1,217 |
| TOTAL | 950 | 3,162 |