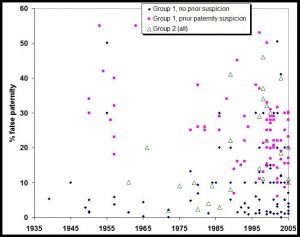
% false paternity: 205 data points v year (click to enlarge)
I have previously posted on the matter of paternity fraud (covering separately paternity fraud type 1, paternity fraud type 2, and DNA testing legalities). This post draws attention to a larger dataset on paternity fraud of which I was previously unaware. It is apposite also to discuss the phenomenon of sexual crypsis which links this topic with that of my last post, The Bottom of the Rabbit Hole.
The Child Support Analysis Site
My main motivation for this post was the accidental discovery of the remarkable web site Child Support Analysis. This claims to have been the site of “a small independent think-tank“. Its scope was “child support in the UK and topics related to child support”. It is clear that the driving force was one Barry Pearson, self-described as “childfree”, at least in 2005. The site appears to be a commendably factual, polemic-free, source of data and historical record. It contains an explicit warning that its purpose was not for “advising, blaming, campaigning, or debating“. Regrettably, the site ceased operation in July 2007 but thankfully it is still up. It would be a pity if the considerable work put into compiling the material thereon was lost. In particular it hosts the largest dataset of mis-paternity data I have yet seen. It pulls together the sources deployed in several meta-analyses plus a number of other references, albeit only up to 2006.
I have broken-down the mispaternity data from Child Support Analysis into three categories. The first two both relate to data obtained in the UK, Europe, North America, Australia or New Zealand (referred to as Group 1 countries). The first category relates to tests carried out when there was no prior suspicion of mispaternity, whilst the second category relates to tests where there was initial suspicion. These latter tests were mostly carried out by testing labs employed in matters of paternity dispute. Many of the data in the former category were obtained adventitiously, for example as a by-product of blood tests or DNA tests carried out for other reasons. The third category relates to mispaternity data from other countries (called Group 2).
Some 205 mispaternity data were obtained, expressed as the percentage of men tested who were discovered not to be the father. These data are plotted against year of the test in the graphic which heads this post, the three categories being shown by distinct points on the scatter plot. The average and standard deviation of the data in these three categories are,
Average and standard deviation of ‘Pearson’ dataset (% mispaternity)
| Group 1, no prior suspicion | Group 1, prior paternity suspicion | Group 2 | |
| Median | 6% | 25% | 17% |
| Mean | 10% | 25% | 19% |
| Standard Deviation | 11% | 10% | 13% |
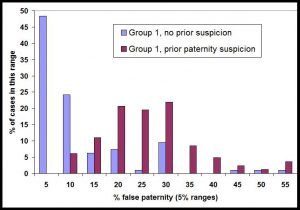
The standard deviation is a poor measure of the distribution in the case of Group1 with no prior paternity suspicion. This is illustrated by presenting the data instead in histogram form, thus,
Not surprisingly there is a big difference in the assessed mispaternity depending upon prior suspicion. Where there was no such suspicion, mispaternity rates are usually low, albeit there is still a substantial possibility that the man in question is not the father. However, where there was suspicion in advance, this suspicion turns out to be justified in typically 20% – 30% of cases, and sometimes much more.
Anderson’s Data
One of the main sources used by Child Support Analysis was the paper “How Well Does Paternity Confidence Match Actual Paternity? Evidence from Worldwide Nonpaternity Rates“, by K.Anderson, in Current Anthropology 47(3):513-520 (June 2006). As a health check I have looked at the data in that paper also. At the time the author was able to boast that, “while this list cannot be considered complete, it is the most extensive published list of nonpaternity rates assembled to date, far exceeding pre-existing lists“. (The contemporaneous, but unpublished, compilation by Pearson, was, in fact, much larger). In Tables 1, 2 and 3 Anderson presents the results of a total of 67 studies in various countries broken down according to whether the testees initially had a relatively high confidence in their paternity (Table 1), results from testing labs, suggesting prior suspicions about paternity (Table 2), or cases where the degree of prior confidence in paternity was unknown (Table 3).
Averaging over the data in each of Anderson’s Tables gives the proportion of men tested who were found not to be the father as 3.5%, 31.8% and 17.4% respectively.
These data are averages over different cultures and different demographics within these cultures. That the average mispaternity was as high as 3.5% even for the group with a relatively high degree of paternity confidence is striking. Less surprising is the very high rate of mispaternity in cases where this was suspected and provided the motivation for testing (31.8%). The latter is broadly consistent with my averaging over the “prior suspicion” data, above. Anderson’s Table 1 (3.5%) and Table 3 (17.4%) averages may be interpreted as lying in the lower and upper parts of the distribution associated with my “no prior suspicion” data (i.e., average 10% with standard deviation 11%).
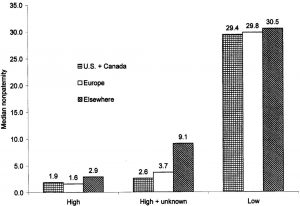
Because the data for “no prior suspicion” are so skewed, the median differs substantially from the average. Anderson also gives the median of his data, as follows,
Medians of Anderson’s data for his Tables 1, 3 and 2 respectively
Data from the CSA
For people in the UK, the results obtained from tests order by the (now defunct) Child Support Agency (CSA) will be of interest. Whilst these are cases where paternity is disputed, it should be noted that the CSA only conducted tests if the mother agreed (and the context will generally be the mother’s claim against the man for child support). Hence it is not clear whether one would expect a higher or a lower mispaternity rate than the population average.
% of paternity tests conducted by the CSA returning negative
| Year | GB | N.Ireland |
| 1998 | 21.3# | |
| 1999 | 15.2@ | 14.6# |
| 2000 | 19.8@ | 16.9# |
| 2001 | 14.9@ | 20.7# |
| 2002 | 14.2@ | 6.1# |
| 2003 | 16.6@ | 18.9# |
| 2004 | 15.4@ | 8.7# |
| 2005 | 15.4@ | 23.1# |
| 2006 | 16.4* | |
| 2007 | 13.6* | |
| 2008 | 19.0* |
*The Guardian in August 2008 (the title of this article belies its contents, as explained here); @from this FOI response; #from this FOI response
Academic Authors’ Commentaries
Some of the comments made by the authors of the studies cited by Pearson are worth noting, for example,
- Diamond, Jared, in his book, “The Rise and Fall of the Third Chimpanzee“, pp. 72-73, writes “extramarital sex is an integral, albeit unofficial, part of the human mating system.”
- Dr. Bradley Popovich, then vice president of the American College of Medical Genetics, opined, “for the population as a whole, the generic number used by us is 10 percent”.
- The rate of wrongful paternity in “stable monogamous marriages”, according to the Max Planck Institute in Munich, Germany, ranges from one in 10 with the first child to one in four with the fourth”.
- One study followed couples waiting for NHS fertility treatment, where the men were ‘azoospermic’, meaning they produced no sperm and were totally infertile. The researchers found that 25 per cent of the women became pregnant before fertility treatment started.
- Steve Jones, book, “Y: The Descent of Man“, wrote “in one clinic, a tenth of the women who came for help became pregnant even as their partners stayed sterile. They had taken their destiny into their own hands”.
I have made no attempt to break down the data by demographic. It is certainly the case that the reason for the very broad spread of the test results is due to demographic differences. Again some comments made by the study authors are worth noting,
- Robin Baker, in his book “Sperm Wars: The Science of Sex” writes, “some men … have a higher chance of being deceived than others — and it is those of low wealth and status who fare worst….. Actual figures range from 1 percent in high-status areas of the United States and Switzerland, to 5 to 6 percent for moderate-status males in the United States and Great Britain, to 10 to 30 percent for lower-status males in the United States, Great Britain and France. Moreover, the men most likely to sexually hoodwink the lower-status males are men of higher status.”
- Similarly, in Getting Human Nature Right, A Talk With Helena Cronin, we read, “it turns out that misattributed paternity is as minimal as 1% among very high-status American males but up to 30% among unemployed, deprived, inner-city males.”
- And Stuart Birks, then director of New Zealand’s Massey University’s Centre for Public Policy Evaluation, said low-income men were more likely to be raising someone else’s child without knowing it. Nationally, a rate of 10 per cent is highly likely, it could be as high as 20 per cent”.
An interesting research area would be to drill into the existing literature to attempt to consolidate these claims about demographic numerically. I have no doubt about the outcome. Paternity fraud, whilst occurring throughout society, is far more prevalent amongst the lowest socioeconomic classes.
Sexual Crypsis
Sexual crypsis (at least as I use the term here) refers to the phenomenon in a species whereby oestrus in the female is secret rather than advertised. In short, the males do not know when a female is on heat. What is the relevance of sexual crypsis to human reproductive strategy?
It is worth emphasising the oddness of human sexual crypsis. In most mammals oestrus is advertised in order to attract male mates. Think dogs and bitches on heat. The dogs are in no doubt about the matter. Think female chimp. A female chimp in oestrus is embarrassingly obvious even to us humans. So it is reasonable to suppose that the change to sexual crypsis in humans carried evolutionary advantage, and, moreover, an evolutionary advantage peculiar to humans. What is the main difference between chimp and human reproductive strategies? Well, that would be the pair bond. In humans, who display sexual crypsis, a long term pair bond has evolved, helping to ensure the survival of offspring which take so many years to mature. In contrast, in non-cryptic chimps, the mother chimp raises the child essentially unaided.
So what is the link between sexual crypsis and the pair bond? One suggestion is mate guarding. In a non-cryptic species, in which a female’s fertile period is easily recognised, a male wishing to ensure that he gets her pregnant, not another male, need repel other suitors only for a short time. In a cryptic species, on the other hand, he needs to mate-guard all the time. It is easy to envisage this full-time mate guarding as a precursor to the pair bond. Indeed, this may be part of the explanation. However, it’s not the only hypothesis. The other involves the cuckolding strategy. But first, an entertaining diversion.
Consider this suggestion,
Males are the product of a selective breeding programme, the selection being done by females.
Well, of course, because women are the gatekeepers of sex.
Because women get to choose with whom they have sex, they get to control the direction of human evolution. Providing that you accept that women do indeed decide if procreation takes place (mostly), this conclusion is inevitable. The advent of the pill and elective abortion has only strengthened the female hold on reproduction.
Yes, yes, I know it isn’t that simple. But there is a strong tendency in that direction. It is not true that men are always up for sex with any female at any time. That is one of our modern misandric myths. But nevertheless, there is a strong tendency for men to be happy to take advantage of an opportunity to have sex with a women who makes herself available. In these situations it is the woman who is in control. Our society insists that this should be so. Rape is, after all, defined as sex in violation of the woman’s consent – specifically the woman’s consent. Our society legislates, literally, to ensure that women remain the gatekeepers of sex. I believe that all societies have done so in varying ways.
It is quite amusing really. Yes see, ladies, every time you complain about men’s nature, remember, it’s your fault. If we are monsters, then we are the monsters you created.
No, I’m not entirely serious. There is an element of choice by men too. And evolution does not negate the individual’s obligation to moral conduct. I remain responsible for my actions. But nevertheless there is an element of truth in the observation.
What I want to address now is cheating. The pair bonding scenario is all very nice and cosy, but surely a man’s best evolutionary strategy is to spread his seed as widely as possible (in addition, of course, to said pair bonding arrangement). Men have an advantage here because they could get dozens of women pregnant simultaneously, whilst a woman can incubate only one child at a time (generally). Men’s cheating is a threat to women’s evolutionary strategy because his ability to provide resources for her child will be diluted by having to juggle competing claims from other women and their children. So there is a puzzle here: why have women not exploited their control over the evolutionary direction to breed the wandering tendency out of men? Men could have been made to develop so as to be strictly monogamist, a race of utterly faithful men. So why has this not happened?
The answer is that it takes two to cheat. If women have not exploited their control over the evolutionary direction to stop cheating it can only be because it favours the promulgation of their genes. It does.
In attempting to optimise their choice in a male, women have a dilemma. On the one hand they would naturally wish to choose a high status male who, by virtue of his position on the male hierarchy, is flagged as having good genes – Mr Alpha. On the other hand, women also need to choose a male who is going to stick around long term for resource provision purposes – Mr Commitment. The problem is that these two characteristics tend not to occur together in the one bloke. There are exceptions but in general Mr Alpha is too busy prioritising his status to be desperately reliable, whilst Mr Commitment is probably willing to commit as a result of being less than alpha status. So what’s a girl to do?
Cheat, obviously. The optimal strategy for women is to capture Mr Commitment for marriage purposes (read ‘resources’), whilst keeping a weather eye out for mating opportunities with Mr Alpha (read ‘genes’). So long as Mr Commitment doesn’t realise, he’ll provide the resources for the raising of the cuckoo in his nest. And this – finally – is where sexual crypsis comes in.
In a species which advertised female oestrus, Mr Commitment would need to guard his potentially errant wife only at such times. But the phenomenon of sexual crypsis gives him no clue to her fertile periods, and he is left with the near impossible task of being on permanent watch. She, on the other hand, does know when her fertile periods are, and can, should she wish, exploit this to maximise the potential for bearing Mr Alpha’s child. This might be entirely subconscious on her part. Some quotes from Matt Ridley illustrate the point.
“…her husband is, almost by definition, usually not the best male there is – else how would he have ended up married to her? His value is that he is monogamous and will therefore not divide his child-rearing effort among several families. But why accept his genes? Why not have his parental care and some other male’s genes?”
“…deep in the mind of a modern woman is the same basic hunter-gather calculator, too recently evolved to have changed much: strive to acquire a provider husband who will invest food and care in your children; strive to find a lover who can give those children first-class genes. Only if she is very lucky will they be the same man.”
One man’s philandering is another man’s paternity fraud. If the theory is valid you would expect paternity fraud to be more prevalent where Mr Commitment was in a lower socioeconomic class, because then it is so much easier for him to be trumped socially by another bloke. Similarly you would expect paternity fraud to be less common when Mr Commitment is in a higher socioeconomic class, since in that happy circumstance Mr Commitment is hard to better, being himself something of an alpha male. This is indeed the case, all sources agree that mispaternity is far more common in the lower socioeconomic classes.
Conclusion
The rate of mispaternity in the population as a whole remains uncertain but the data herein suggest a best estimate average of ~10%, but it could well be higher (the CSA data for GB over ten years averages to 16%) . However this disguises the huge demographic dependence of paternity fraud. In the highest socioeconomic classes the rate is probably only 1% or 2%, whilst in the lowest it is around 30%.
Sexual crypsis is an aid to the cuckoldry apparent in the high rate of paternity fraud. This is evolutionary because successful cuckolding men get more children whilst the women get better children. Only the cuckold looses out. He is the disposable male, the man removed from posterity by the male genetic filter, the sacrifice for the tribe.


