
Cot death (SIDS) has been related to laying babies prone (right) rather than supine (left)
Data on child homicides, and the perpetrators thereof, is subject to considerable obfuscation. The incompleteness and inconsistencies in child homicide data have been well described by Robert Whiston and Nigel Hawkes, and the overall picture is summarised in http://mhrm.uk/wiki/killing-children/. In a forthcoming post I will return to this issue with particular emphasis on perpetrators.
The present post is by way of being a precursor to this. Here I look first at the data on all child deaths. The overwhelming bulk of these are from natural causes. Nevertheless the data reveals some interesting features, not least the dependence of child death rates on marital status, cohabitation and lone parenthood.
The focus of this post, though, is on unexplained infant deaths. We shall see that the dependence of unexplained infant death rates on marital status, cohabitation and lone parenthood is particularly marked. There are features in the data which are disconcerting and, I suspect, politically incorrect to notice. Hence the post.
It has long been argued that a certain, but unknown, percentage of unexplained infant deaths are actually covert homicides. This, then, forms the link with the planned subsequent post.
Sources/references are listed at the end of the post.
All Deaths in Infancy and Childhood (England & Wales)
This section addresses child deaths from all causes. Data is taken from Ref.1. Terminology,
- Early neonatal: the first 7 days after birth (assuming a live birth)
- Neonatal: the first 28 days after birth (assuming a live birth)
- Late neonatal: between 7 and 27 days after a live birth
- Post-neonatal: between 28 days and 1 year old
- Infant: less than 1 year old
- Child: older than 1 year and less than some specified age which varies and may be 14 or 16.
Stillbirths are ignored throughout. (The number of stillbirths used to be somewhat fewer than the number of infant deaths, but the number of stillbirths has exceeded the number of infant deaths since 2002 – because the latter has reduced).
In 2014 there were 2,517 infant deaths in England & Wales compared with 903 deaths of children aged 1 to 14 (Table 1), hence infant deaths (under 1s) accounted for 74% of all deaths of those up to age 14. Moreover, more than half of infant deaths occur within the first week of life (Table 1). The likelihood of dying is far greater the younger the child. Children aged 1 to 4 are nearly twice as likely to die as children aged 10 to 14.
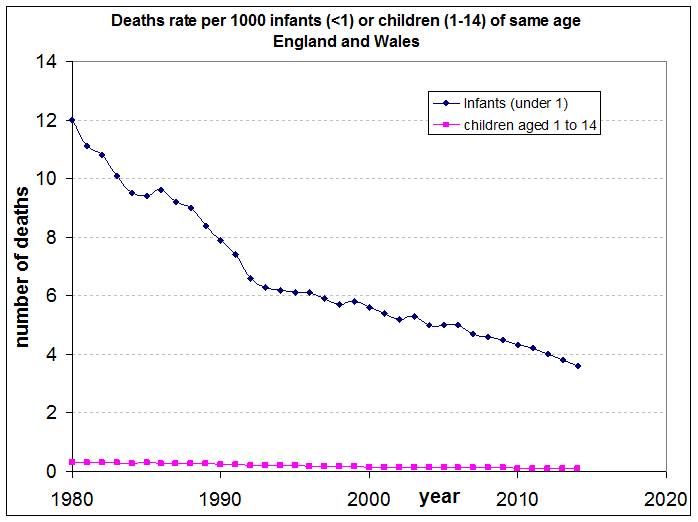
Figure 1 shows how the number of infant and childhood deaths has reduced since 1980, presumably because of improving health facilities. Figure 2 expresses this data as the death rate per 1000 infants or children of the same age range. This Figure drives home the far greater probability of infant death than childhood death. In 2014 an infant was 36 times more likely to die in that year than a child aged between 1 and 14. (However, such a child needs to survive for 13 years. Even so, infant death is 3 times more likely than dying at any age between 1 and 14).
Table 1: Number of Infant and Child Deaths, 2014
| Infants | Children | ||||||
| Early neonatal | Late Neonatal | Post-neonatal | Total Infant | 1–4 yrs | 5–9 yrs | 10–14 yrs | 1-14 yrs |
| 1,376 | 386 | 755 | 2,517 | 400 | 259 | 244 | 903 |
Figure 1: Deaths of Infants and Children (click to enlarge – applies throughout)
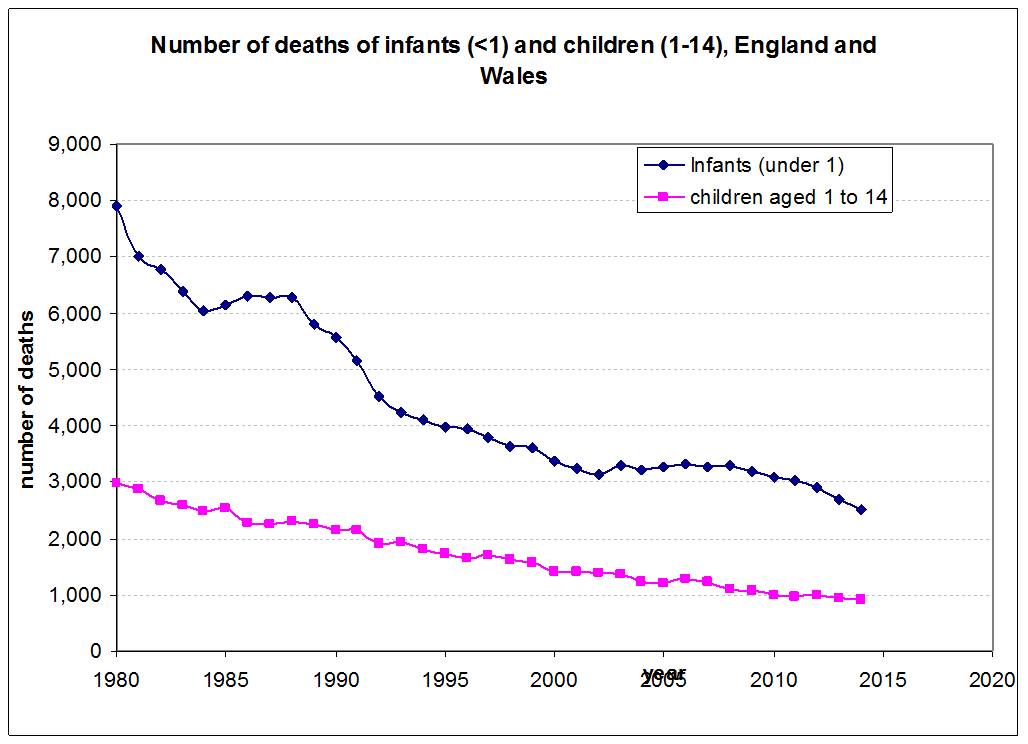
Figure 2: Death Rates of Infants and Children per 1000 per year
Infant Death Rate Dependence on Living Arrangements of Parents
This section again addresses all infant deaths, from whatever causes, and looks at how infant death rates vary according to whether the parents’ are married, cohabiting or not cohabiting. Where the parents are not cohabiting there is data available which distinguishes between joint registrants and sole registrants (that is, whether two names or just one appear on the birth certificate). Sole registrants can be taken to be single mothers to an extremely good approximation.
Note that the marital status and living arrangements discussed here refer to the status when the baby’s birth is registered.
Data refer to England & Wales and are taken from the datasets for years 2012, 2013 and 2014 obtainable from Ref.1.
Figures 3, 4 and 5 compare the infant death rates for parents with various different living arrangements for the years 2014, 2013 and 2012 respectively. It is striking that, in every category and for every year, death rates per 1000 increase in the following order,
- married couples (smallest death rates);
- cohabiting joint registrants;
- non-cohabiting joint registrants;
- sole registrants, i.e., lone mothers with father uninvolved (largest death rates)
The reason for this marked dependency can be attributed to socio-economic status, since this correlates with the above marital status and living arrangements. Evidence that socio-economic status is the correct explanation follows from the data given in Ref.1 for death rates against socioeconomic class. Data is given for economic classes 1.1, 1.2, 2, 3, 4, 5, 6, 7, and 8 (where lower numbers indicate higher socio-economic status, the definitions being given here).
Figure 6 plots death rates for lone-living parents against those for married or cohabiting couples of the same socio-economic class, plotting neonatal and post-neonatal deaths separately and taking data from years 2012, 2013 and 2014. The data are rather noisy because the statistics are small. Nevertheless it is clear that the data scatter roughly equally on either side of the line of equality. This indicates that living as a couple or living as a single parent makes no discernable difference to infant death rates providing that the comparison is done for the same socio-economic group in both cases.
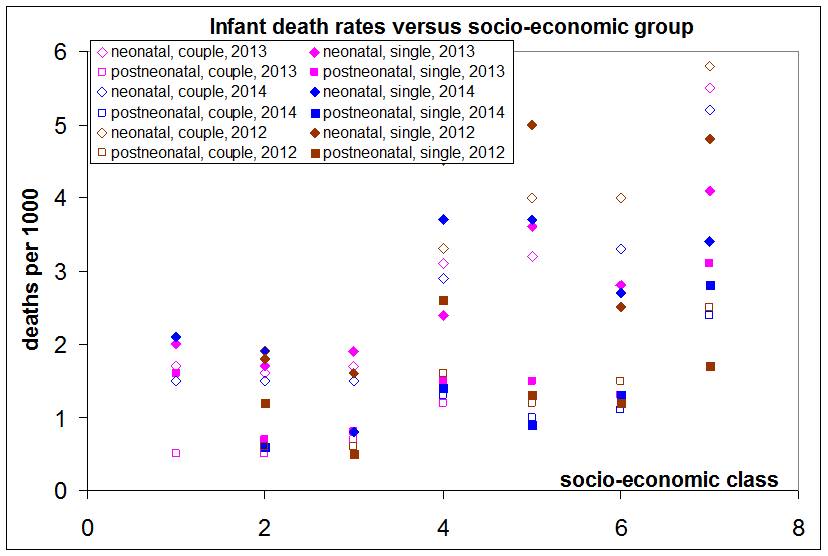
Figure 7 displays the correlation between infant death rates and socio-economic class directly. The death rate increases as one proceeds from socio-economic class 3 to 7.
The clear differences in infant death rates according to living arrangements seen in Figures 3-5 result from the correlation of living arrangement with socio-economic status. It is socio-economic status which emerges as the underlying factor behind the higher death rates. Nevertheless it is a statistical fact that an infant is more likely to die in a lone-parent home than a two-parent home, especially if the two parents are married. If the lone parent in question were wealthy, this would not be the case. Most lone parents are not wealthy.
We will see below that a very different picture emerges for unexplained infant deaths.
Figure 3: Infant death rates: different living arrangements compared (2014)
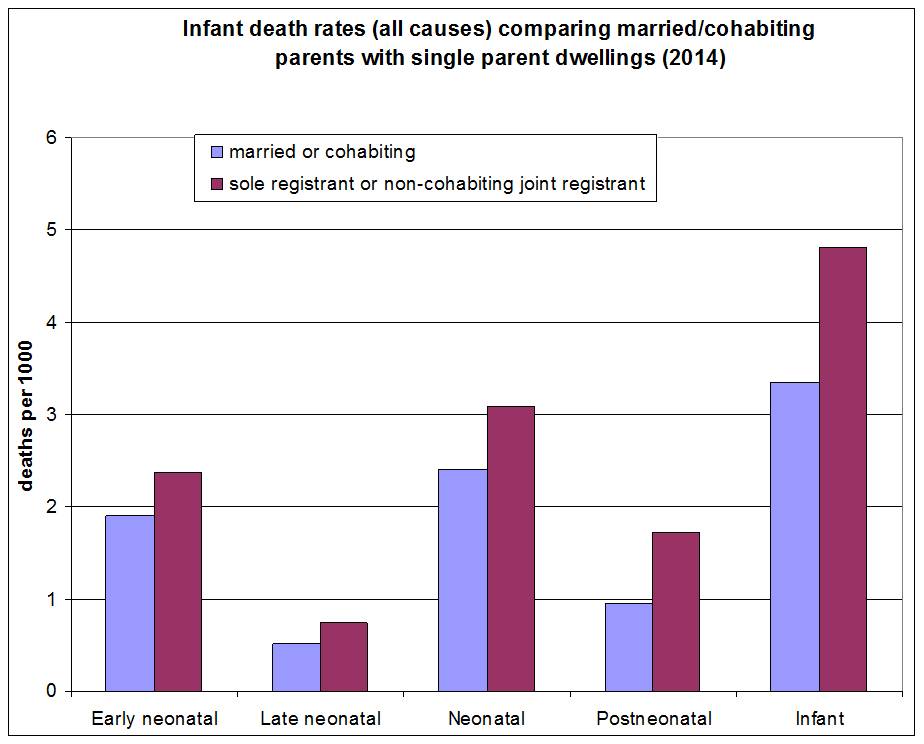
Figure 4: Infant death rates: different living arrangements compared (2013)
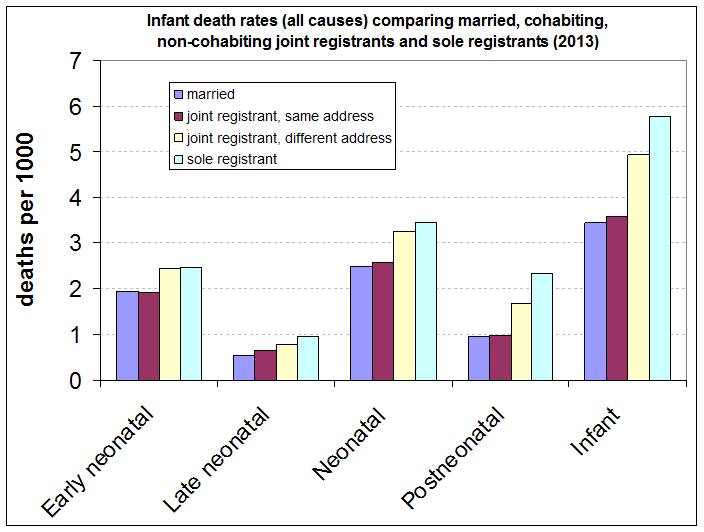
Figure 5: Infant death rates: different living arrangements compared (2012)

Figure 6: Infant death rates for lone-living parents compared with married or cohabiting parents of the same socio-economic group, 2012 – 2014
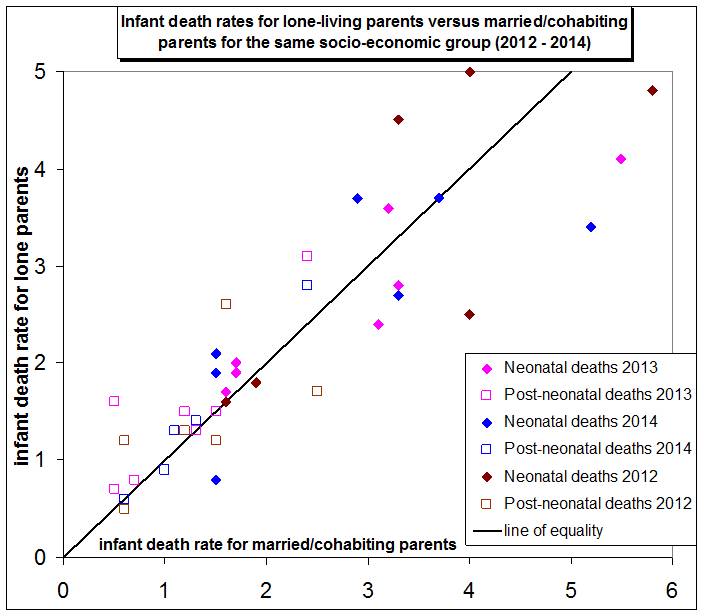
Figure 7: Correlation of infant death rates with socio-economic class
Unexplained Infant Deaths (England & Wales)
When the cause of an infant’s death is unknown, pathologists have a choice between two categories: sudden infant death (SID, colloquially known as ‘cot death’) or the category “Unascertained” death. Ref.2 provides the following clarifications.
Sudden infant death, which was first recognised in the early 1960s, is defined as, “the sudden unexpected death of any infant or young child which is unexpected by medical history and in which a thorough post-mortem examination fails to demonstrate an adequate cause of death”.
“Unascertained” is used by pathologists when the death does not fulfil the criteria used for sudden infant deaths and there is still doubt about its cause.
There is evidence to suggest that these terms are used interchangeably by coroners and research has shown that the characteristics of babies dying of these 2 causes are very similar. Based on this, it is appropriate to include both groups in any analysis of unexplained infant deaths.
Hence the term “unexplained death” is used by ONS to mean either SID or cause of death “Unascertained”.
The ONS over-view of unexplained infant deaths in England & Wales is Ref.2, with the methodology laid out in Ref.3. However, as is often the case with ONS bulletins, the most interesting data is frequently not found in the ‘top level’ of the statistical bulletin, like Ref.2. Instead it is necessary to hunt a little deeper. Doing so for unexplained deaths results in the latest Excel data file, Ref.5. This includes unexplained infant death statistics between 2004 and 2014 and is the source of the data used here.
The number of unexplained infant deaths is plotted against year in Figure 8, showing separately the numbers for various marital and living arrangements.
In 2014 there were 46 unexplained infant deaths amongst married parents but nearly four times as many, 166, amongst unmarried parents. This is despite the fact that there are similar numbers of married and unmarried people having children (see Table 2).
Figure 9 plots the unexplained infant death rates per 1000 for various living arrangements as a multiple of the unexplained death rate for married couples. It shows that,
- For unmarried, cohabiting joint registrants the unexplained infant death rate is 2 to 3 times that for married couples;
- For joint registrants who are not living together, the unexplained infant death rate is 4 to 5 times that for married couples;
- For sole registrants (unsupported lone parents) the unexplained infant death rate is 6 to 8 times that for married couples.
Note that the effect of living arrangements on unexplained infant death rates is far, far more marked than its effect on the totality of infant deaths as indicated by Figures 3-5.
In the case of the totality of infant deaths, the dependence of the death rate on parental marital status and living arrangements was found to be a result of socio-economic class (Figures 6 and 7). In the case of unexplained infant deaths, however, there is a far greater dependency on parental marital status and living arrangements which requires explanation. Figure 10 plots the unexplained infant death rate for unmarried joint registrants against that for married couples for the same broad economic class (characterized here as professional, manual or intermediate).
Figure 10 is very different from Figure 6. All the data plots well above the line of equality, implying that economic class alone is insufficient to explain the higher unexplained infant death rates amongst unmarried joint registrants compared to married parents. Whilst there is, as expected, a clear dependence on socio-economic class, for the same socio-economic class unmarried joint registrants have a greater unexplained infant death rate than married couples (about double).
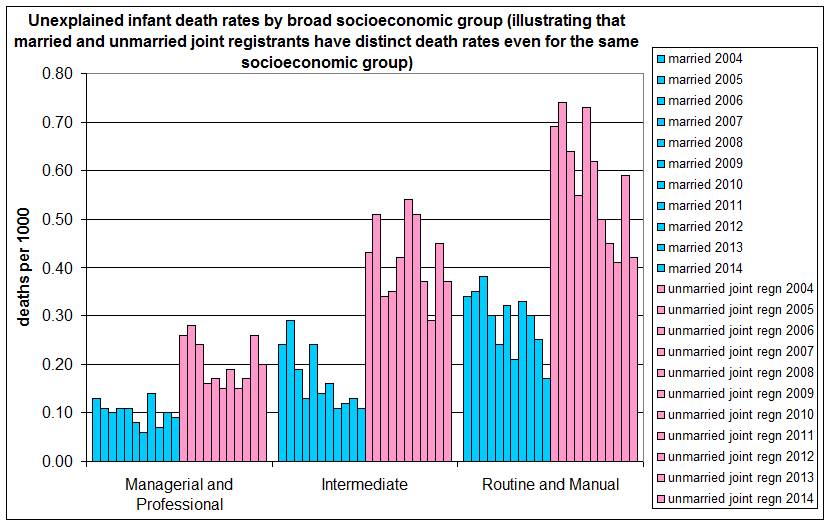
The data has also been plotted in histogram form against the three broad socioeconomic groups in Figure 11, illustrating again the fact that a clear difference of about a factor of 2 exists between unexplained infant death rates for married and unmarried joint registrants even when compared for the same socioeconomic group.
Table 2: Total Numbers of Live Births, England & Wales
| Living arrangements of parents | 2012 | 2013 | 2014 |
| Total | 729,674 | 698,512 | 695,233 |
| Inside marriage | 383,189 | 367,618 | * |
| Outside marriage comprising… | 346,485 | 330,894 | – |
| Joint regn/same address | 227,337 | 218,049 | * |
| Joint regn/different address | 77,269 | 73,546 | 110,129 |
| Sole registration | 41,879 | 39,299 |
*Data not reported in this detail in 2014. Total for married plus cohabiting 585,104
Figure 8: Numbers of unexplained infant deaths comparing different marital and living arrangements, 2004 – 2014
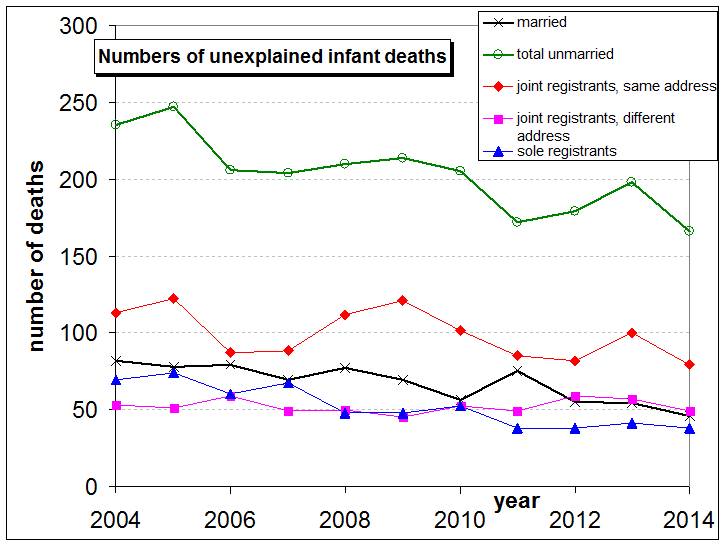
Figure 9: Unexplained infant death rates per 1000 for various living arrangements divided by the unexplained death rate for married couples

Figure 10: Unexplained infant death rates for married couples versus that for unmarried joint registrants for the same socio-economic group (2004 to 2014)
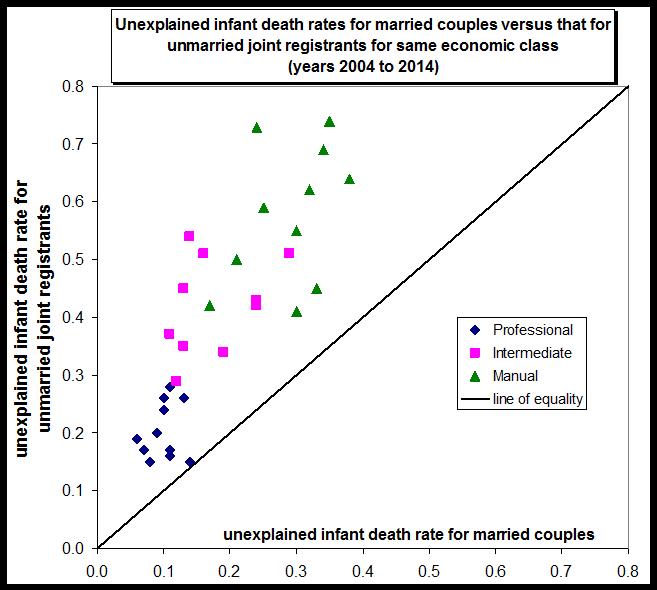
Figure 11: Unexplained infant death rates by broad socioeconomic group (illustrating that married and unmarried joint registrants have distinct death rates even for the same socioeconomic group)
Are unexplained infant deaths covert homicides?
Ref.1 lists the following risk factors for unexplained infant deaths:
- the baby’s sex (boys are more at risk);
- birthweight;
- sleeping position (prone sleeping is riskier than supine sleeping);
- unplanned bed-sharing / sleeping with a baby on a sofa;
- maternal age;
- maternal smoking during pregnancy;
- not breastfeeding;
- temperature (overheating, covering the baby’s head);
- exposure to tobacco smoke;
Ref.1 also notes explicitly that the parents’ marital status and socio-economic classification are risk factors.
Why should the risk of unexplained death be greater for mothers of the same socio-economic class according to whether they are cohabiting or not? Do lone-living mothers smoke more than cohabiting or married mothers of the same socio-economic class? Are lone mothers more likely to have the infant in bed with them, or to sleep with the baby on a sofa, than married or cohabiting mothers of the same economic status? Quite possibly, I suppose, but I don’t know.
More difficult to understand is the difference between unexplained death rates for married couples and cohabitees (Figure 9).
There is little doubt that a non-trivial proportion of SIDs are in fact homicide. Steven Kairys et al, Pediatrics February 2001, 107, Issue 2, observe,
“Recently, well-validated reports of child abuse and infanticide – perpetrated by suffocation and masqueraded as apparent life-threatening events (ALTE) and/or SIDS – have appeared in the medical literature and in the lay press.
Parents of infants with recurrent ALTEs have been observed trying to suffocate and harm their infants. In Great Britain, covert video surveillance was used to assess child abuse risk in 39 young children referred for evaluation of recurrent ALTEs. Abuse was revealed in 33 of 39 cases, with documentation of intentional suffocation observed in 30 patients. Among 41 siblings of the 39 infants in the studies, 12 had previously died suddenly and unexpectedly. Although 11 of these deaths had been classified as SIDS, 4 parents later admitted to suffocating 8 of these siblings. Other cases previously thought to be multiple SIDS deaths within a family have been revealed to be cases of multiple homicide by suffocation.”
Wolkind et al, Acta Paediatr 1993;82: 873-6 studied families with 2 or more cot deaths. They concluded that 55% of these were probably filicide (infanticide). However, it is not clear what conclusion we can draw from this as regards the frequency of homicide masquerading as SID in cases of just one SID in a family.
There seems little doubt that some deaths assigned to the “unexplained” category are, in fact, homicides. But as to what proportion, no one knows. The bearing this might have on the overall child homicide statistics could be considerable. The total number of unexplained infant deaths in 2014 was 212 (in England & Wales). This compares with (identified) child homicide rates of around 70 per year. Hence, if even a small percentage of unexplained infant deaths are actually homicides – as seems inevitable – then this will cause a marked increase in the total child homicides.
We shall see in the next post that, each year, several infant deaths classed as “unexplained” are subject to Serious Case Reviews by the child protection agencies, indicative of suspicious circumstances.
References
- Childhood Mortality in England & Wales (years up to 2014), http://www.ons.gov.uk/peoplepopulationandcommunity/birthsdeathsandmarriages/deaths/datasets/childmortalitystatisticschildhoodinfantandperinatalchildhoodinfantandperinatalmortalityinenglandandwales
- Unexplained Deaths in Infancy, England and Wales: 2014, http://www.ons.gov.uk/peoplepopulationandcommunity/birthsdeathsandmarriages/deaths/bulletins/unexplaineddeathsininfancyenglandandwales/2014
- Unexplained deaths in infancy: England and Wales QMI (methodology doc), https://www.ons.gov.uk/peoplepopulationandcommunity/birthsdeathsandmarriages/deaths/qmis/unexplaineddeathsininfancyenglandandwalesqmi
- Excel datafile on unexplained deaths from 2004 to 2013, https://www.ons.gov.uk/peoplepopulationandcommunity/healthandsocialcare/childhealth/datasets/unexplaineddeathsininfancyenglandandwalesreferencetables
- Excel datafile on unexplained deaths from 2004 to 2014, https://www.ons.gov.uk/peoplepopulationandcommunity/birthsdeathsandmarriages/deaths/datasets/unexplaineddeathsininfancyenglandandwalesreferencetables