
Contents
- Motivation
- Arrests v Prosecutions
- The Disparities up to 2016
- Imprisonment Disparity
- Sentence Disparity
- Bias or Men Committing More Serious Crimes?
- Disparity on Cautions
- Disparity on Conviction
- Discharge Disparity
- Community Sentence Disparity
- Suspended Sentence Disparity
- Conclusion on Bias
- Mitigations and Aggravations
- Lightowlers 2018
- Modelling the Probability of Immediate Custody
- Modelling Sentence Severity
- Conclusion
1. Motivation
I had not intended to return to this issue, having addressed it previously on a number of occasions (here and here and here and here and here). But my attention was drawn to a recent academic publication which sparked my interest again. The paper in question was authored by Carly Lightowlers and published in the British Journal of Criminology on 19 October 2018. The purpose of the work was to investigate the effects of intoxication in exacerbating punishment for assault offences, and how this varies according to sex. Its opening sentences are,
“At the time of writing, the UK Government is due to produce a female offenders strategy. Underpinned by conceptions of social and distributive justice and a resounding consensus with the recommendations from the Corston report, it is broadly recognized that responses to women’s offending ought to be gender-specific, respond sensitively to the needs of women and divert them away from custody.”
Other extracts include,
“Broader feminist debates surrounding the administration of justice have traditionally centred on notions of ‘equality’ and ‘social justice’, highlighting the way in which women are often more disadvantaged and unequal before they even encounter the law and experience penal sanctions as harsher than men. Related critiques of the criminal justice system have highlighted how administrative practices are linked to deep-seated assumptions of gender based roles and behaviour, and masculine conceptions of justice based on legal and procedural equality. Feminist scholars also spotlight how more feminine conceptions of justice, such as ‘social’ and ‘distributive’ justice, are relatively absent in sentencing guidelines and wider criminal justice policy, given that white middle-class men remain overwhelmingly the guardians of justice.”
If you were not familiar with the term before, welcome to the concept of “distributive justice”. Curiously, in a broader social context, this term is usually defined thus,
“Distributive justice concerns the nature of a socially just allocation of goods. A society in which inequalities in outcome do not arise would be considered a society guided by the principles of distributive justice.”
Roughly speaking, proponents of distributive justice are in favour of equality of outcome – when it applies to the allocation of “goods” in society. Curiously, though, despite her advocacy of distributive justice, when it comes to criminal punishment, Lightowlers writes,
“When it comes to sentencing, equality of outcome (e.g. sentence length and/or severity) on average between men and women is not necessarily the correct goal to strive for.”
Distributive justice in this context means alignment with Baroness Corston’s 2007 report.
I’ll not reiterate my view of the Corston report. It is indeed the case that the Government is poised to make “justice” explicitly sex-biased as a matter of policy (the scare-quotes there being absolutely necessary). How curious it is that there has been such resistance to the claim that the criminal justice process is already biased significantly in favour of women, and has been for years if not forever. The decision to make “justice” sex-dependent hardly sprang from nowhere. It arose from what Lightowlers calls the “resounding consensus”: that one should not treat women the same as one treats men, for that would be too harsh and lacking in compassion. I’ll not labour the obvious corollary. This is the “some-animals-are-more-equal-than-others” version of equality that we are all familiar with under the label “women’s equality”. If such an attitude were widespread – and it certainly is within circles of influence (though the general public is another matter) – then one would naturally expect that its effects would have been seen in the outcomes of criminal justice before now. And, of course, they have.
However, it was not these sentiments that drew my attention to the paper, for they are commonplace. One of the factors was the following statement made in publicity blurb about the paper in the Law Society Gazette,
“Women are twice as likely as men to receive harsher sentences for assault offences when alcohol is a contributory factor, according to a new study.”
The statement begs misunderstanding. The statement might be taken to mean that women tend to get harsher sentences than men for assault offences when alcohol is involved. But Lightowlers’ analysis does not show this (nor does the paper itself claim to). Alcohol acts as an aggravating factor in assault cases, i.e, being inebriated tends to result in a harsher sentence. This is true for both men and women. Lightowlers’ analysis indicates that the aggravation penalty for inebriation in assault cases is rather greater for women than men, e.g., the increase in the probability of being imprisoned due to being inebriated is greater for women than men. However, the analysis also shows that inebriated men remain more likely than inebriated women to be imprisoned for assault, and the same is true if both are sober.
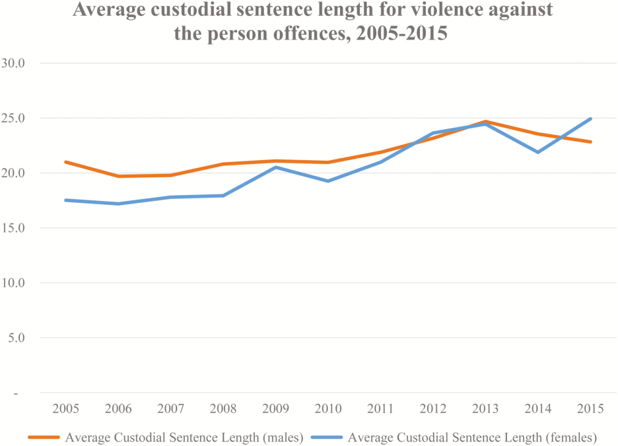
The more significant issue which drew my attention, though, was Fig 2 of Lightowlers’ paper (reproduced below as Figure 1), which is based on CJS data of the average sentence length for violence against the person (VAP) offences for people sentenced to immediate custody. It shows that women received slightly longer sentences than men in 2015. In fact the same is true in 2016, though not shown in the Figure, the average sentence lengths in that year being 22.3 months and 23.3 months for men and women respectively, (see this MOJ data).
Figure 1: Reproduced from Fig 2 of Lightowlers’ 2018 Paper (“Drunk and Doubly Deviant? The Role of Gender and Intoxication in Sentencing Assault Offences”, Br J Criminol. Published online October 19, 2018. doi:10.1093/bjc/azy041. Br J Criminol | © The Author(s) 2018. Published by Oxford University Press on behalf of the Centre for Crime and Justice Studies (ISTD).This is an Open Access article distributed under the terms of the Creative Commons Attribution License (http://creativecommons.org/licenses/by/4.0/), which permits unrestricted reuse, distribution, and reproduction in any medium, provided the original work is properly cited.) Click to enlarge
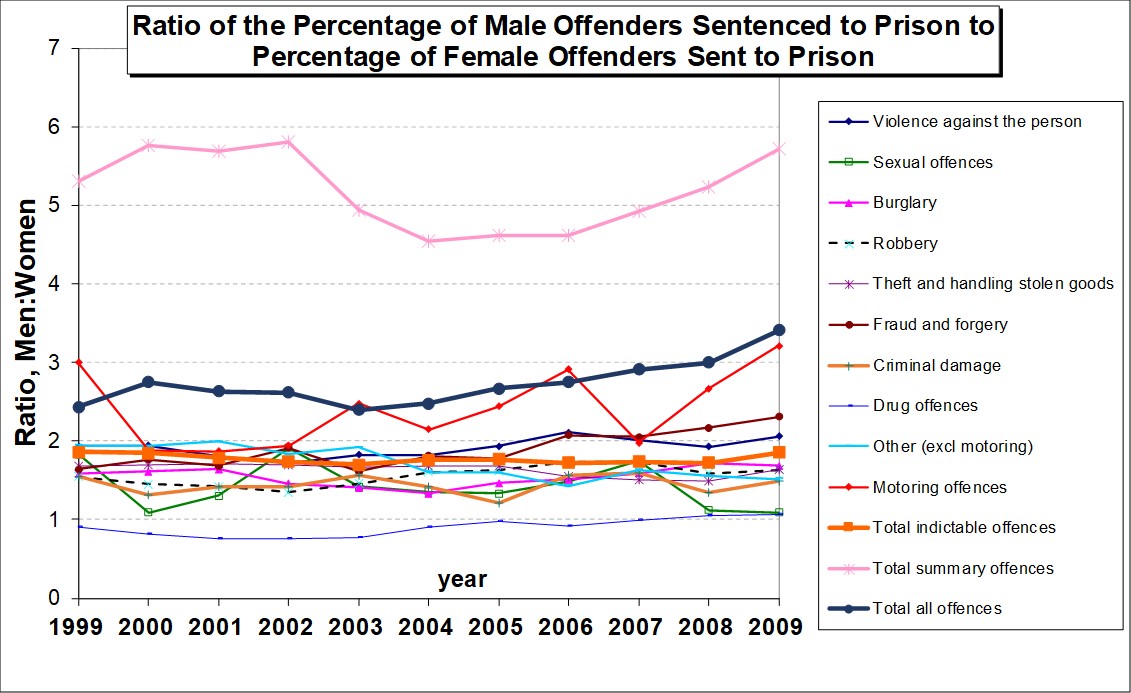
I was somewhat concerned. Does this invalidate my previous claims that men are treated substantially more harshly? I had not looked at the data for some years. A disparity on sentence length may be defined as the ratio of men’s to women’s average prison sentence length for the same category of crime. Previously (see links above) I have used data for average sentence lengths which extends to 2009, the corresponding disparities being shown in Figure 2. These data do indeed show that, in 2009 though not in earlier years, the disparity for violence against the person (VAP) offences was just slightly below unity (see arrow), i.e., that women received on average a slightly longer prison sentence – in those cases where they were sent to prison. In addition, the disparity for criminal damage offences and arson was less than unity throughout the period 1999 to 2009.
However, these observations do not invalidate the overall message from Figure 2, that for most offences, the disparity is significantly greater than unity: men receive longer sentences on average.
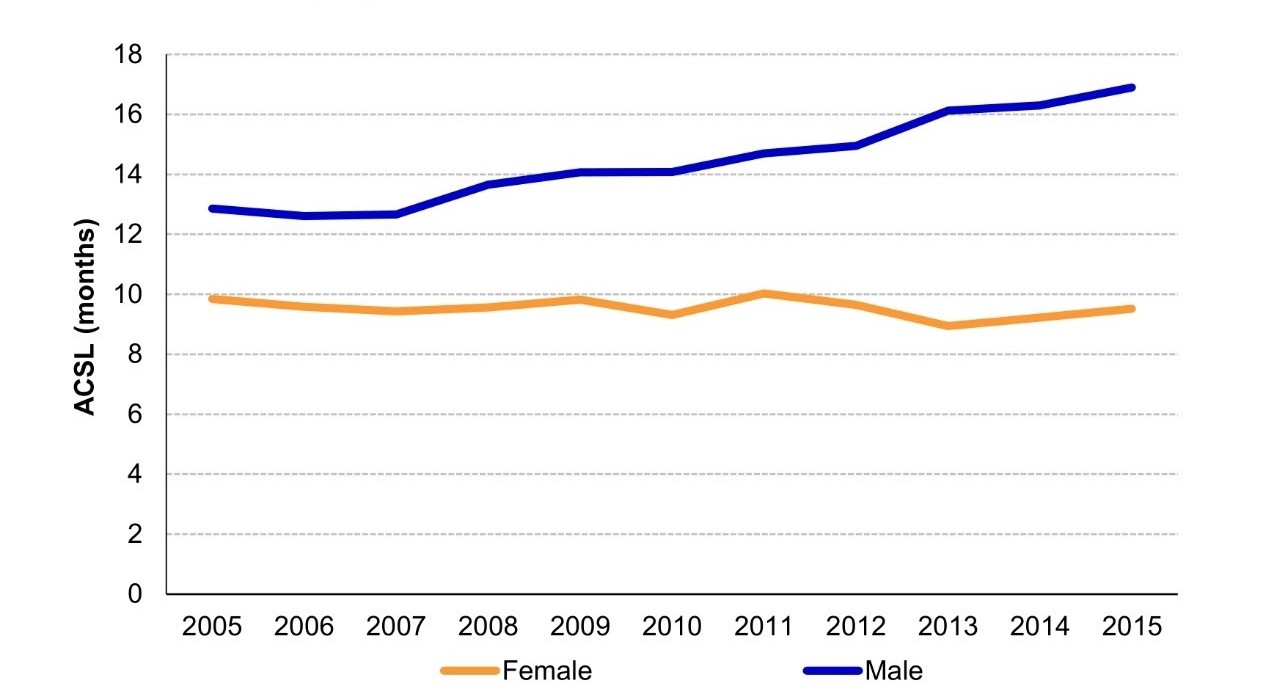
Based on all offences, men’s average custodial sentence has been trending upwards, whilst that for women has been roughly constant (Figure 3). However, Figure 3 cannot be interpreted in terms of bias because it does not account for the proportionally greater, and increasing, volume of male offending in the more serious crime categories.
All this motivated me to take a good look at the more recent MOJ data. This has been made publicly available in recent years in the form of a pivot table, which makes interrogation of many variables possible and convenient. This link provides the pivot table containing sentencing data between 2006 and 2016.
Figure 2: Disparity on Average Sentence Length, 1999 to 2009, by Offence Category
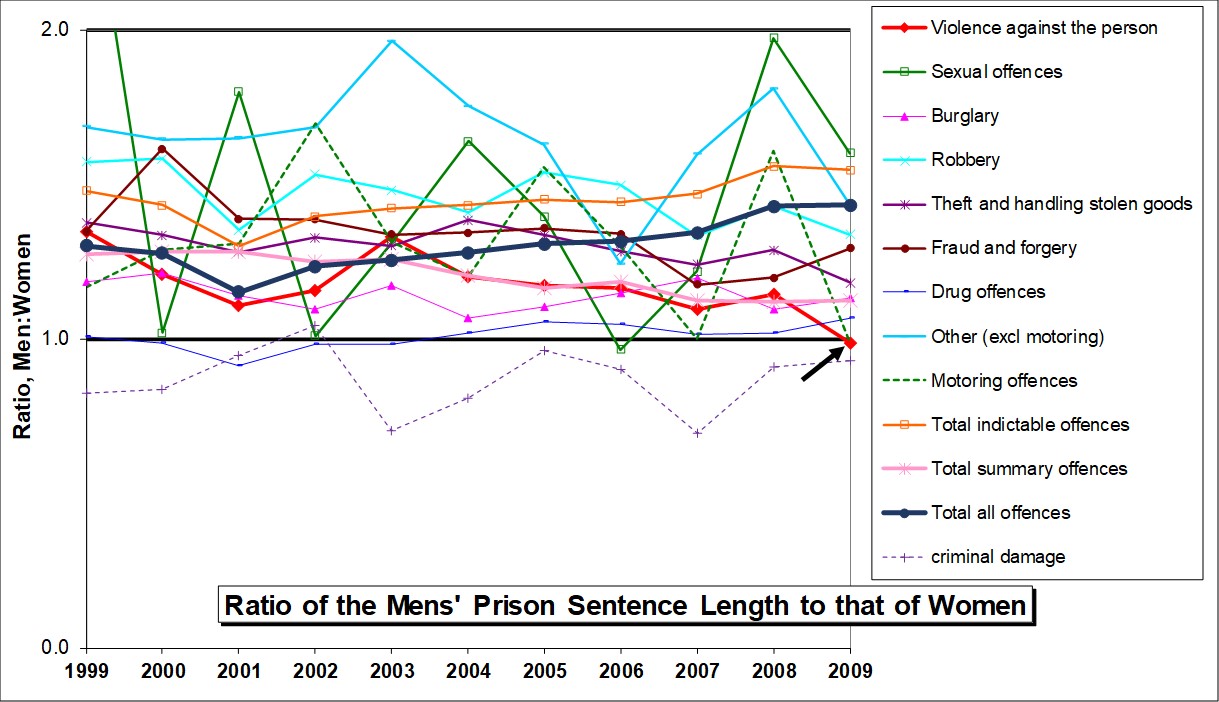
Figure 3: Average Prison Sentence Lengths (all offences)
2. Arrests v Prosecutions
In previous posts I have only considered gender disparity in sentencing, specifically sentencing to immediate custody. I have repeatedly noted that gender disparities may exist in other parts of the criminal justice process, namely in,
- The relative likelihood of men and women being arrested under otherwise identical circumstances;
- The relative likelihood of men and women being prosecuted, having been arrested, under otherwise identical circumstances; and,
- The relative likelihood of men and women being convicted, having been prosecuted, under otherwise identical circumstances.
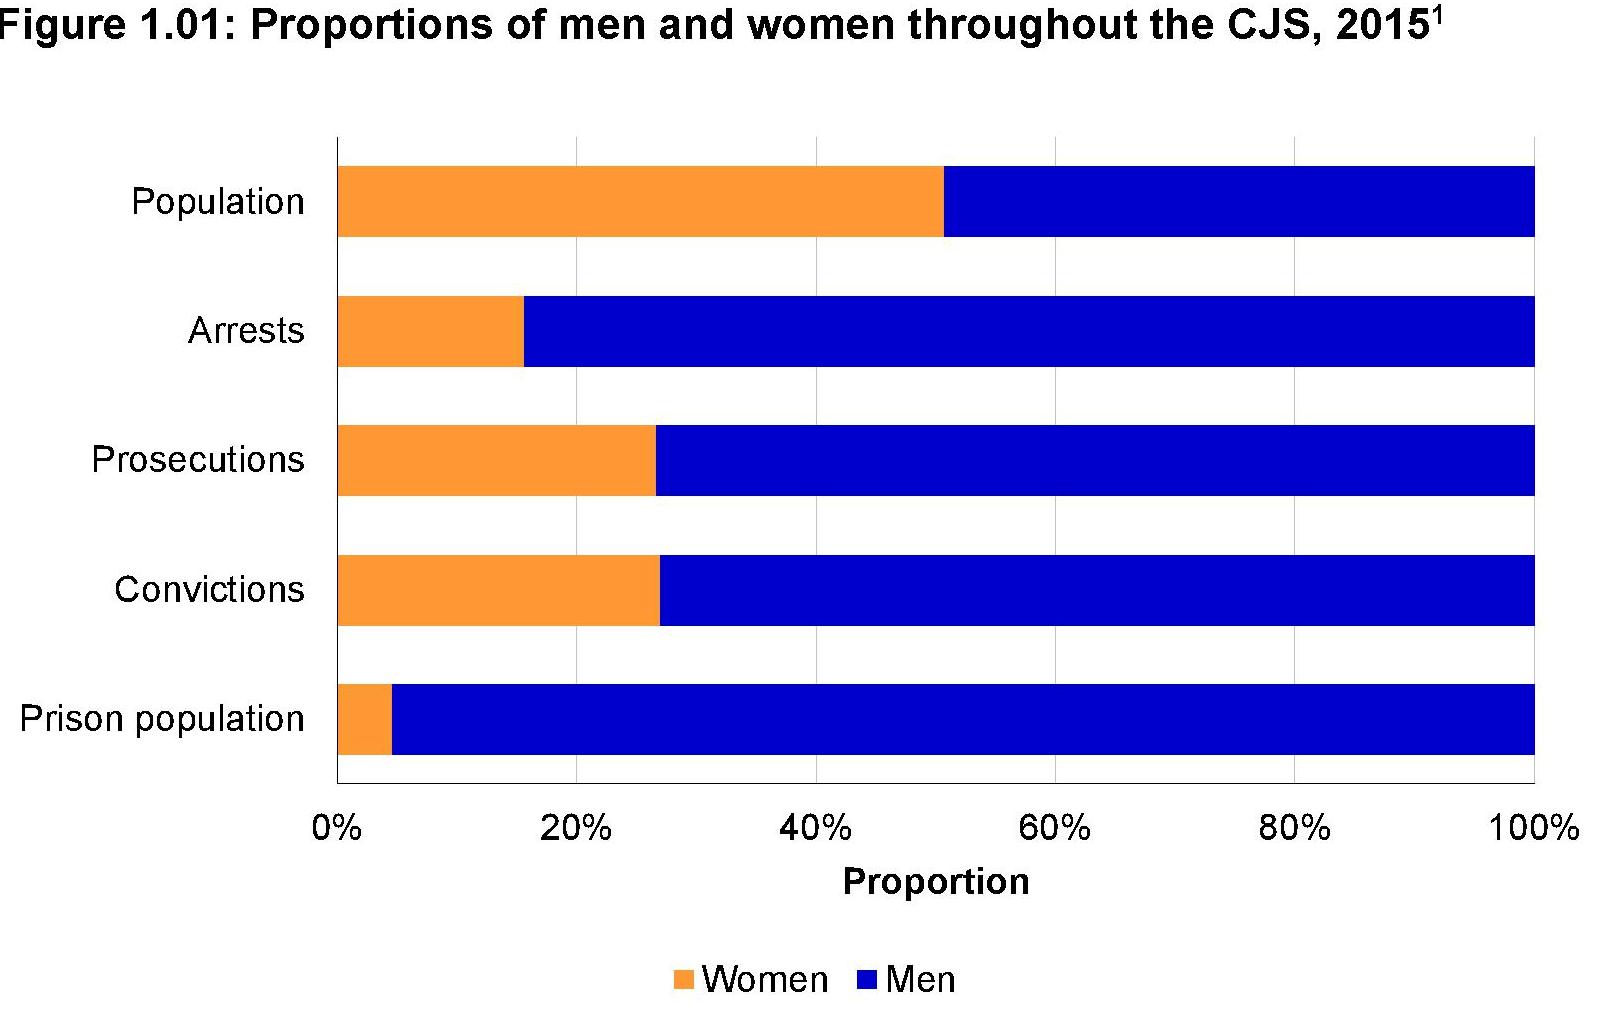
Clear evidence of gender bias in the above areas is not easy to obtain. If someone is not arrested, they never feature in the CJS statistics. Consider Fig 1.1 from Women and the criminal justice system statistics 2015, reproduced as Figure 4, below. This covers the entirety of offences by both sexes. I draw your attention to the substantially greater proportion of women prosecuted than are arrested. However, little can be concluded from this because of the numerical dominance of prosecutions for summary offences (for both sexes), for which no arrest may be made (the accused being summoned to appear in court).
Figure 4: Reproduced from Women and the criminal justice system statistics 2015
3. The Disparities up to 2016
The data between 2006 and 2016 has been taken from the MOJ pivot table “Criminal justice statistics outcomes by offence tool”. Disparity factors are defined below and plotted in the corresponding graphs. Each disparity is defined as either a male:female ratio or a female:male ratio. In both cases a disparity greater than one indicates a disbenefit to men. For example, the sentence disparity is the average sentence length for men divided by the average sentence length for women. Hence a sentence disparity greater than one indicates men receive a longer sentence, on average. In contrast, the discharge disparity is defined as the fraction of prosecutions of women which result in conditional or unconditional discharges, divide by the same for men. Thus, a discharge disparity greater than one means that it is proportionally more common for women to receive a discharge than men, i.e., again this is a disbenefit to men.
All data relates to offenders of all ages, so juvenile offenders are included.
3.1 Imprisonment Disparity
The imprisonment disparity is defined as the percentage of convicted men who are given a sentence of immediate custody, divided by the percentage of convicted women who are given a sentence of immediate custody. Figure 5a shows the imprisonment disparity for 10 separate categories of indictable offence from 2006 to 2016. Clearly, men are far more likely to be sent to prison for almost all offences – and for all offences in most years. The MOJ themselves analysed the data for 2015 using multivariate logistic regression and concluded that there was an imprisonment disparity of 1.88, i.e., that men are 88% more likely to be imprisoned. This looks like a reasonable “average” result when compared with Figure 5a.
Figure 5a: Imprisonment Disparity, Indictable Offences, 2006 to 2016 – click to enlarge

The imprisonment disparities for summary offences are shown in Figure 5b. Men are around 8 times more likely than women to be imprisoned for a summary offence. However, summary offences very rarely attract sentences longer than 3 months.
For completeness, the imprisonment disparities for the period 1999 to 2009 are shown in Figure 5c.
Figure 5b: Imprisonment Disparity, Summary Offences, 2006 to 2016

Figure 5c: Imprisonment Disparity, All Offences, 1999 to 2009
3.2 Sentence Disparity
The sentence disparity is the average sentence length for men who are sent to prison, divided by the average sentence length for women who are sent to prison. Figure 6a shows the sentence disparity for indictable offences, and Figure 6b shows the sentence disparity for summary offences. The former is consistent with Figure 1 as regards VAP offences. For most of the offences the disparity is always greater than one (i.e., men get longer prison sentences, on average). In 2016, only VAP offences have a disparity on sentence length below one, and that only very marginally. The reason why VAP offences have the smallest sentence disparity will be rationalised below.
Figure 6a: Sentence Disparity, Indictable Offences, 2006 to 2016
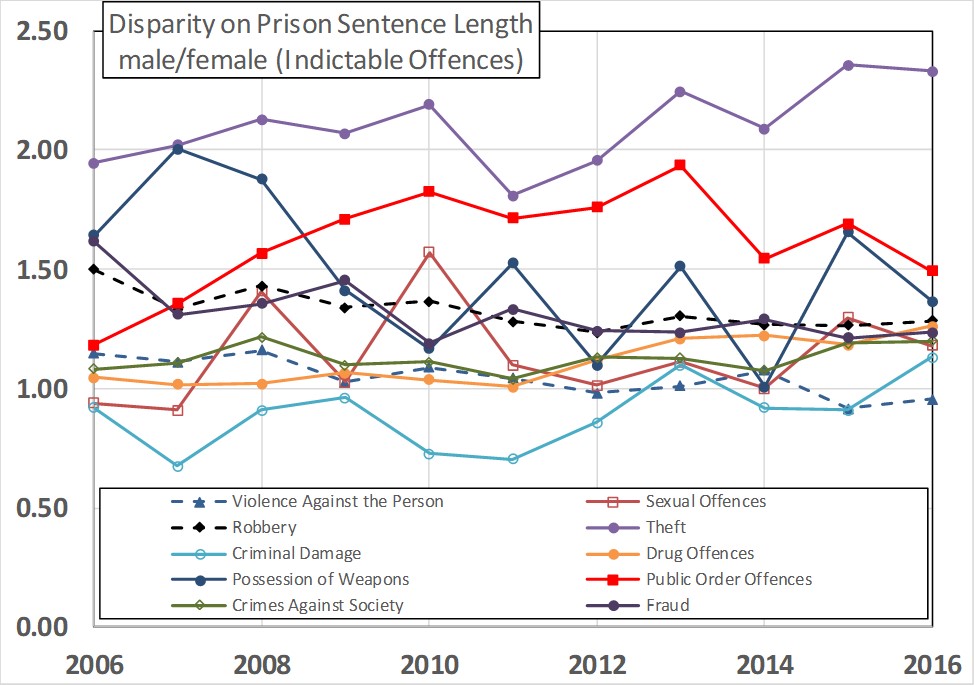
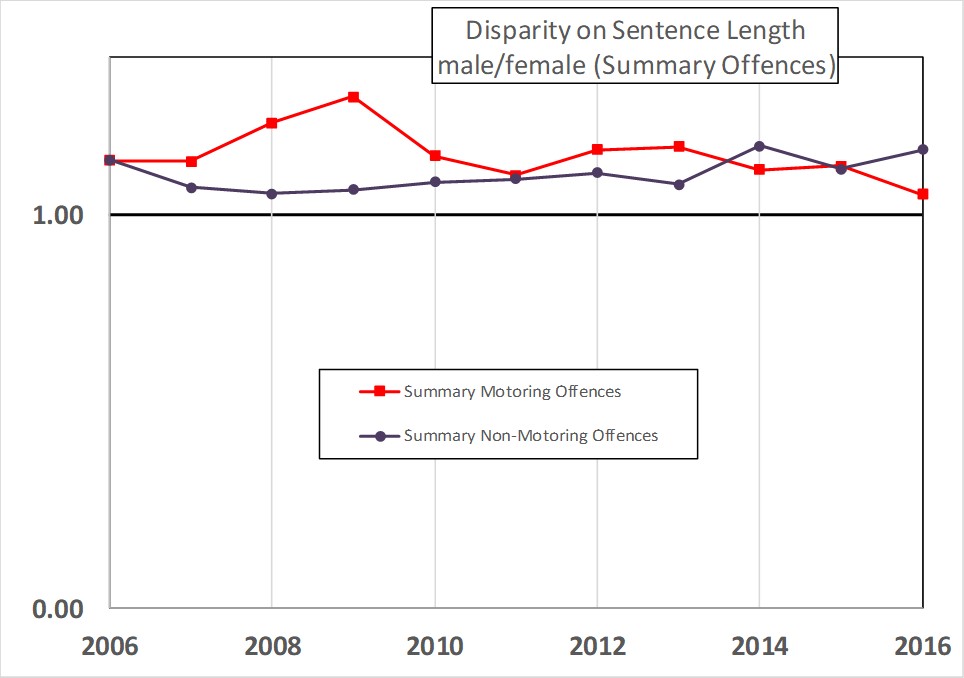
Figure 6b: Sentence Disparity, Summary Offences, 2006 to 2016
3.3 Bias or Men Committing More Serious Crimes?
Do the disparities evident in Figures 5 and 6 arise from gender bias, or do they simply, and fairly, reflect men’s tendency to commit more serious crimes? I have argued in the past (and continue to argue) that the disparity to men’s disadvantage across every offence category is evidence that they are caused by gender bias. Whilst many people (but not necessarily myself) might readily believe that men’s violent, or sexual, crime tends to be more serious than women’s, it is less easy to see why this should be the case for arson, or theft, for example.
And we know that our society has a strong leaning towards a more lenient treatment for female offenders. This is what the Corston Report exemplifies, the report which Lightowlers condones in her opening paragraph. This is the report whose defining ethos is summed up in this quote, “equality does not mean treating everyone the same”. Even more significantly, the Equal Treatment Bench Book explicitly and unashamedly enshrines a differential treatment based on sex in formal judicial guidance. That being so, why should anyone be surprised if the sentencing data reflects this attitude? Let me drive the message home with a few quotes from the Equal Treatment Bench Book in case the reader is not yet familiar with the concept of “equality” as it is officially taught to our judiciary,
(page 3) ‘True equal treatment may not, however, always mean treating everyone in the same way. As Justice Blackmun of the US Supreme Court commented: “In order to get beyond racism, we must first take account of race. There is no other way. And in order to treat some persons equally, we must treat them differently.”’
(page 6-16, in the context of gender) ‘true equal treatment may not always mean treating everyone in the same way’
The Equal Treatment Bench Book quotes Baroness Hale from her 2005 Longford Trust Lecture thus,
(page 6-16) ‘It is now well recognised that a misplaced conception of equality has resulted in some very unequal treatment for the women and girls who appear before the criminal justice system. Simply put, a male-ordered world has applied to them its perceptions of the appropriate treatment for male offenders…. The criminal justice system could … ask itself whether it is indeed unjust to women.’
Treating women and girls the same way we treat men and boys is a “misplaced conception of equality”. This is the sentiment which pervades the Corston Report and is now about to become formally triumphant in our criminal justice processes.
But I have not yet done with the data. There are further indications that support the claim that Figures 5 and 6 are, at least in part and perhaps primarily, the result of bias based on sex. I turn to these additional features next.
3.4 Disparity on Cautions
The police have an alternative to pressing for a prosecution. They may instead offer the arrestee a caution. If the arrestee accepts the caution, prosecution, and any further action, is avoided. However, by accepting the caution the arrestee is admitting guilt, and will then have a record to that effect. Where the arrestee is indeed guilty, to accept a caution is to be let off lightly compared with the possible consequences of being prosecuted and convicted. A gender disparity on cautions cannot be defined simply by the ratio of cautions accepted by men and women because men do commit more crimes. Instead, the number of cautions per prosecution is first evaluated. The caution disparity is then defined as the number of cautions accepted by women per prosecution of women divided by the number of cautions accepted by men per prosecution of men. The resulting caution disparities are plotted in Figure 7 for 2006 to 2016 and for the ten indictable offences.
The caution disparity is almost always larger than 1. It is particularly large for VAP offences in recent years (~4). This means that women are cautioned rather than prosecuted proportionally more than men.
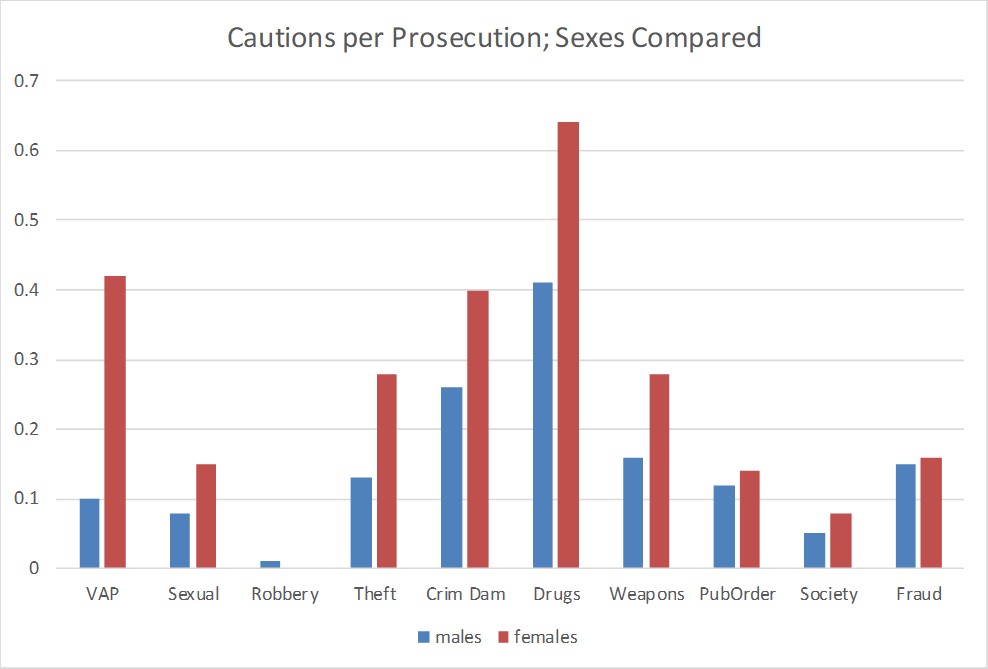
The absolute number of cautions has been falling steeply for all offences and both sexes. Nevertheless, for some offences the number of cautions remains a substantial fraction of the number of prosecutions, suggesting large numbers of people escape prosecution by accepting a caution. Figure 8 shows the number of cautions per prosecution for each offence by sex. Note the particularly large difference between the sexes for VAP offences. In 2016, the number of cautions accepted by women accused of VAP offences was 42% of the number of prosecutions. For men the figure was only 10%. This must be significant as regards the outcomes for the remaining people who are prosecuted and ultimately convicted.
The caution disparity for robbery becomes small in recent years only because the number of cautions has become vanishingly small (see Figure 8).
Figure 7: Caution Disparity for Indictable Offences, 2006 to 2016
 Figure 8: Number of Cautions per Prosecution by Sex
3.5 Disparity on Conviction
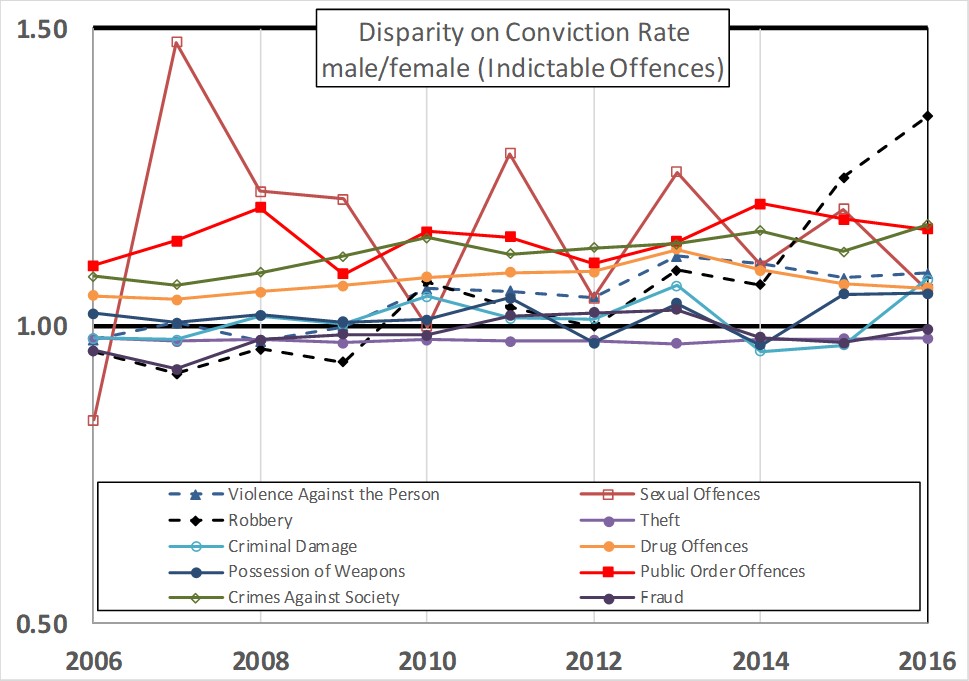
The disparity on conviction is defined as the conviction rate for men divided by the conviction rate for women. Conviction rate is the fraction of prosecutions which result in a conviction. Figure 9 shows the conviction disparities. A few are close to one. Where they differ significantly from one they exceed one, indicating a tendency for some offences to convict a larger proportion of men than women.
Figure 9: Conviction Disparities, Indictable Offences, 2006 to 2016
3.6 Discharge Disparity
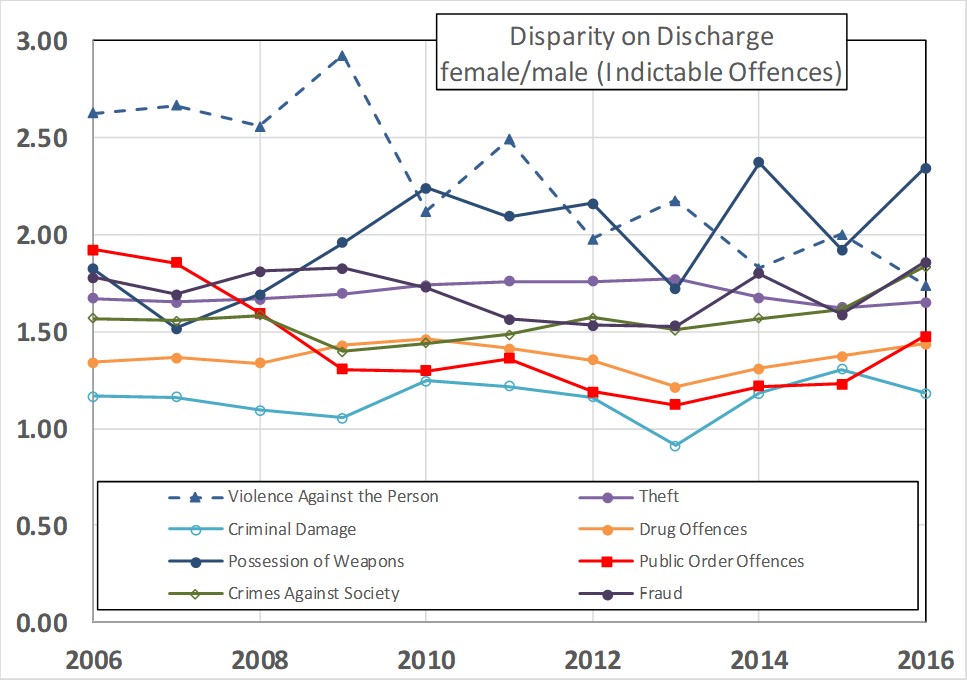
Those prosecuted may eventually be discharged, perhaps an unconditional discharge or perhaps a conditional discharge. The discharge disparity is the fraction of prosecuted women who are discharged divided by the fraction of prosecuted men who are discharged. Figure 10 plots the discharge disparity for indictable offences. (Sex offences and robbery have been omitted because statistics are too small to be meaningful). The Figure shows that women are substantially more likely to be discharged.
Figure 10: Discharge Disparity, 2006 to 2016
3.7 Community Sentence Disparity
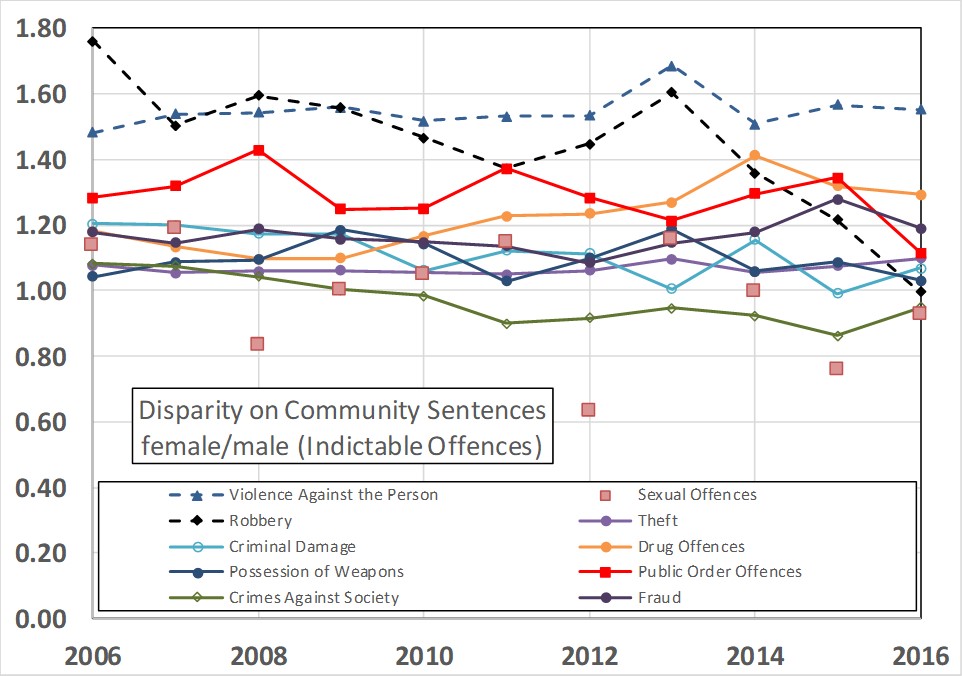
Those prosecuted and convicted may be awarded a community sentence (such as unpaid work in the community). The community sentence disparity is the fraction of convicted women who are awarded a community sentence divided by the fraction of convicted men who are awarded a community sentence. Figure 11 plots the community sentence disparity for indictable offences. There are some disparities below one, but the bulk are above one, indicating that women are more likely than men to be awarded a community sentence.
Figure 11: Community Sentence Disparity, Indictable Offences, 2006 to 2016
3.8 Suspended Sentence Disparity
Those prosecuted and convicted may be awarded a suspended sentence. The suspended sentence disparity is the fraction of convicted women who are awarded a suspended sentence divided by the fraction of convicted men who are awarded a suspended sentence. Figure 12 plots the suspended sentence disparity for indictable offences. There are some disparities around one or just below, but the bulk of disparities are greater than one, indicating that women are more likely than men to be awarded a suspended sentence.
Figure 12: Suspended Sentence Disparity for Indictable Offences, 2006 – 2016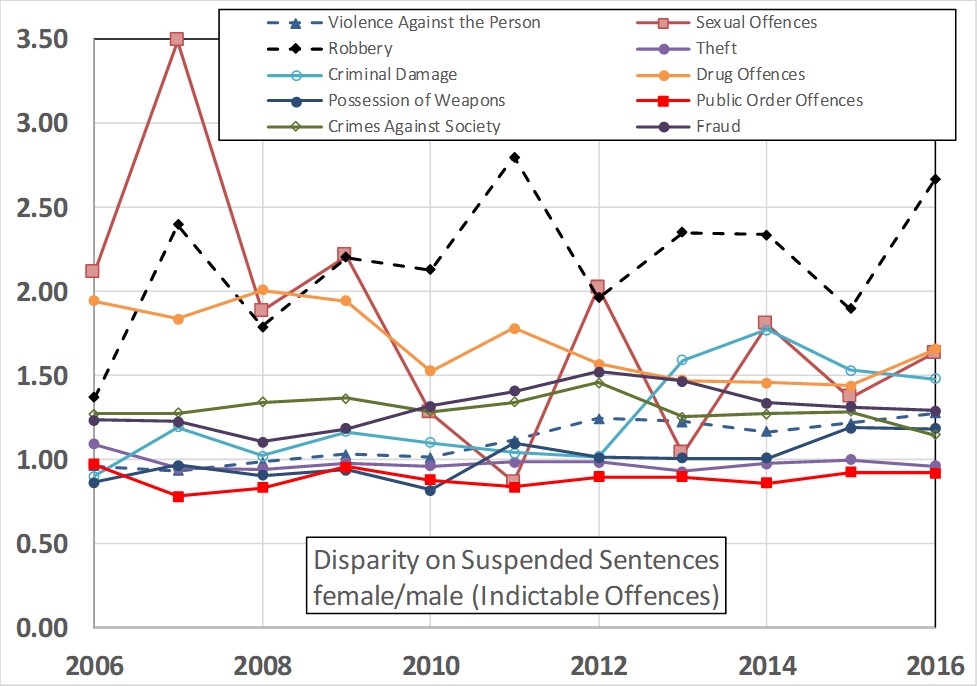
4. Conclusion on Bias
In summary, the above data has shown that, for all or almost all offences,
- Women are proportionally more likely than men to be cautioned rather than prosecuted;
- Women are proportionally more likely than men to be discharged;
- Given prosecution, men are proportionally more likely to be convicted;
- Given conviction, women are proportionally more likely than men to be awarded a community sentence;
- Given conviction, women are proportionally more likely than men to be awarded a suspended sentence;
- Given conviction, men are far more likely to be subject to immediate custody;
- Given a sentence of immediate custody, men receive longer sentences on average than women;
One hypothesis is that all these things are explained by women committing less serious offences than men, on average. I have already argued that the fact that the above disparities apply across all, or almost all, offence categories challenges this explanation. Another challenge to this hypothesis is that there are a number of steps in the process which will act to filter out more women than men on the grounds of having committed only lesser offences, including the greater number of cautions and the greater discharge rate for women. Also the lower conviction rate of women for indictable offences. And yet we are to believe that the women who make it through all these “filters” and are convicted are still guilty only of lesser crimes than men on average. This begins to strain credibility.
The opposing hypothesis, that there is endemic gender bias, would, in contrast, act at all stages equally, and irrespective of what has gone before. Occam’s Razor rules in its favour.
In respect of VAP offences, and the observation that the sentence length disparity is relatively small for this offence category, note that the “filters” are particularly severe for VAP. There are particularly large attritions on ultimate imprisonment of women for VAP offences provided by cautions (Figure 7), discharge (Figure 10) and community sentences (Figure 11). And yet despite that, the imprisonment disparity is still very large (Figure 5a).
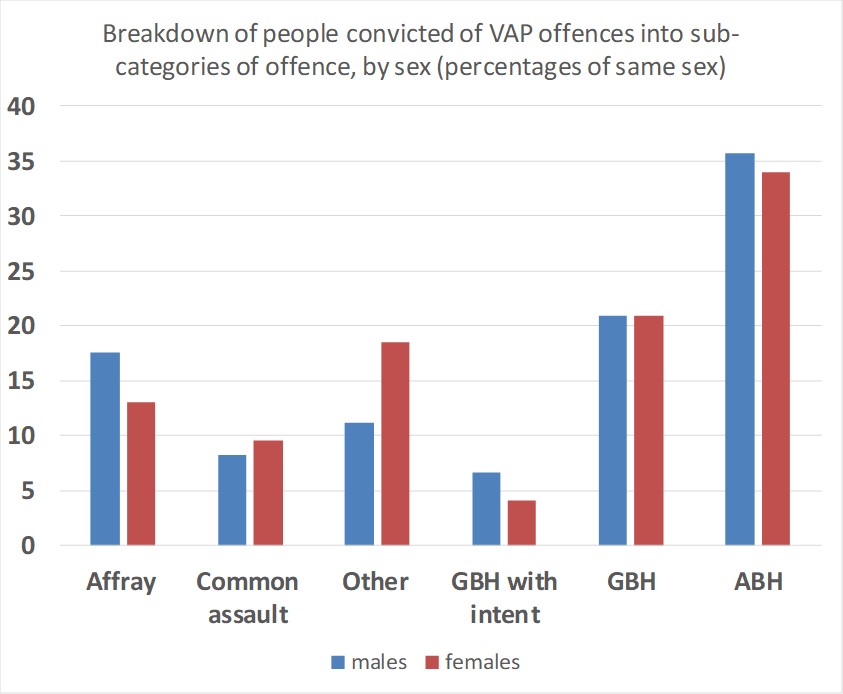
The hypothesis that sentencing disparities result from convicted women’s offending being less severe on average than convicted men’s offending, is contradicted by Lightowlers’ data for VAP offense (her Table 1). This Table breaks down all those in the sample convicted of VAP offences into sub-categories of varying severity. The data is displayed in histogram form below, Figure 13. There is little difference between the sexes, especially in the more severe categories (ABH and GBH). Why, then, are men 2.3 times more likely to be imprisoned? It is hard to avoid the conclusion that this is gender bias. We shall see in section 6 that Lightowlers’ analysis provides strong support for this contention.
Figure 13: Percentages of each sex convicted of various sub-categories of VAP offences (from Table 1 of Lightowlers 2018).
The final consideration, as noted above, is that sex bias is already accepted in the judicial process, so no one should be surprised that it is apparent in the data.
Note that proponents of distributive justice will not be concerned about the disparities displayed in Figures 5-12. Under this concept of “justice”, such disparities are right and proper because “equality does not mean treating everyone the same”. But, in the case of the imprisonment disparities, proponents of distributive justice want this disparity to be far bigger still. Such unequal treatment, if unequal enough, would be “true equal treatment”. The new Government policy looks likely to advance this objective, though unfortunately no one has said just how much inequality is required to bring equality about.
5. Mitigations and Aggravations
The reader may have in mind that various mitigations or aggravations might explain the disparities in Figures 5-12. The same judges who pass sentence also fill in the survey paperwork which have historically recorded mitigations and aggravations. So there is obviously going to be some correspondence between the two. But this may be rationalisation rather than explanation in the sense that some of the categories of mitigation and aggravation are subjective (though not all).
Figure 14 shows some example mitigation factors for theft, dishonesty and fraud offences. Women clearly benefit far more from mitigations than men. And did the judges have an objective measure of remorse, of “being out of character”, of mental illness, and of “cooperation”?
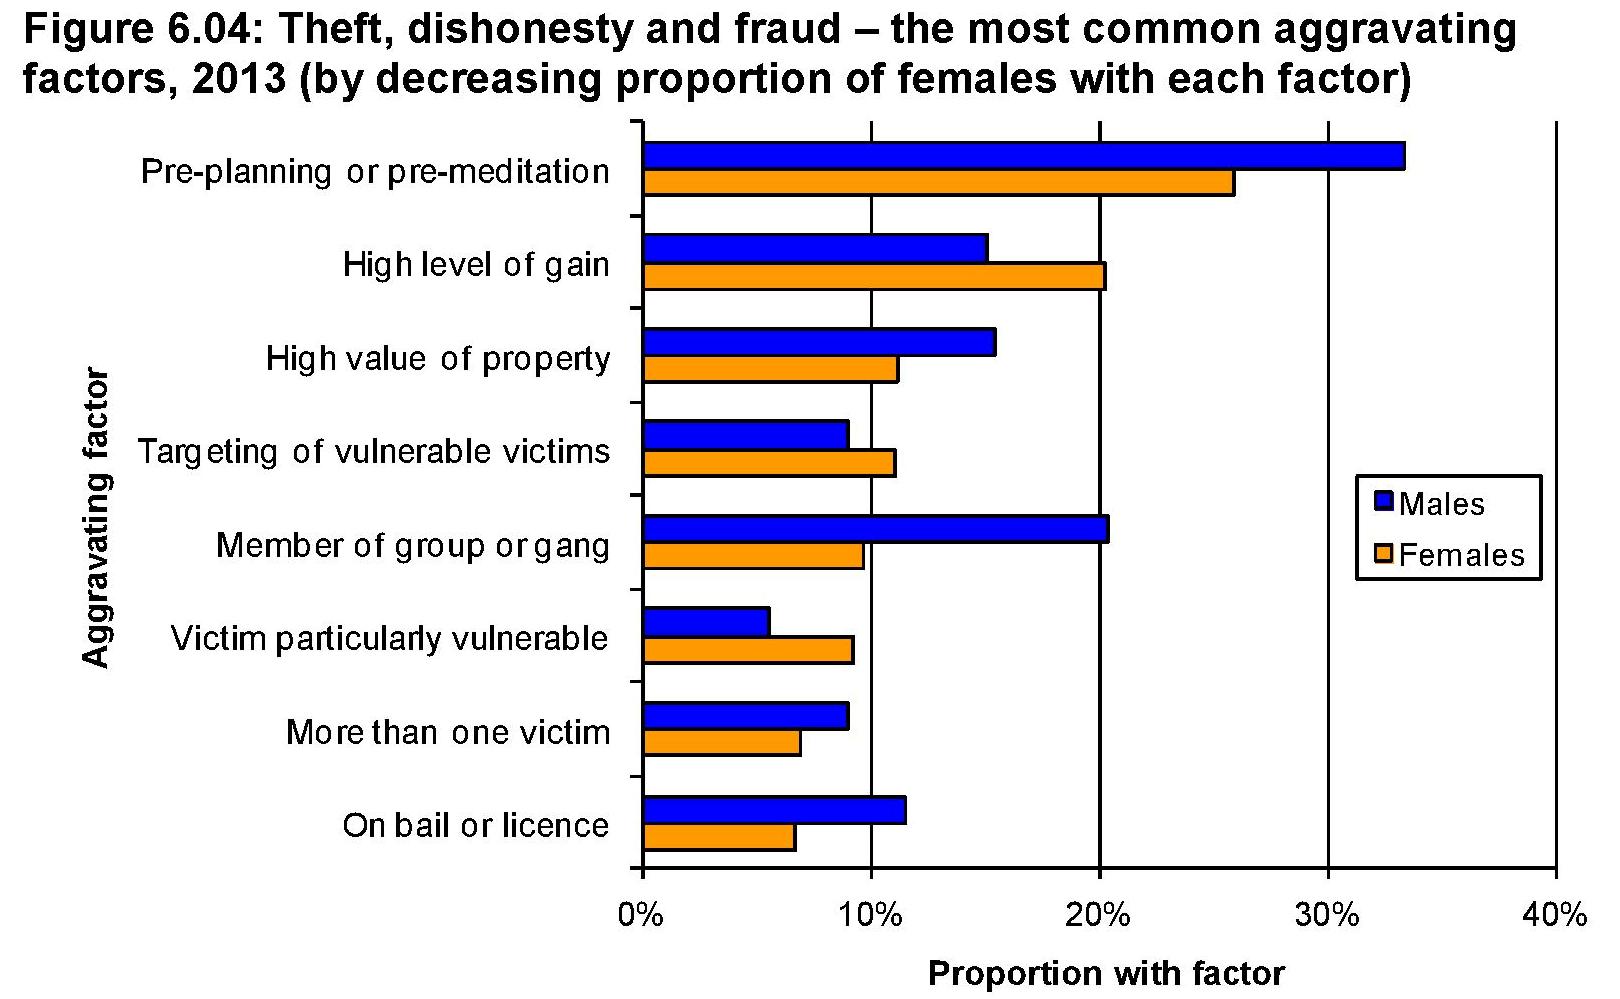
Figure 15 shows some example aggravation factors for theft, dishonesty and fraud offences. The position is not so emphatic, but men tend to have rather more aggravating factors.
Even if these mitigations and aggravations were the full explanation of the disparities in Figures 5-12, it would not disprove gender bias because of the subjective nature of many of the categories – though it might ameliorate the extent of the bias.
However, we shall see in section 6 that the regression analyses of Lightowlers 2018 controls for mitigation and aggravation factors and still results in substantially greater likelihood of men being imprisoned based on sex alone.
Figure 14: Example Mitigation Factors. Taken from the MOJ report “Statistics on Women and the Criminal Justice System 2013”
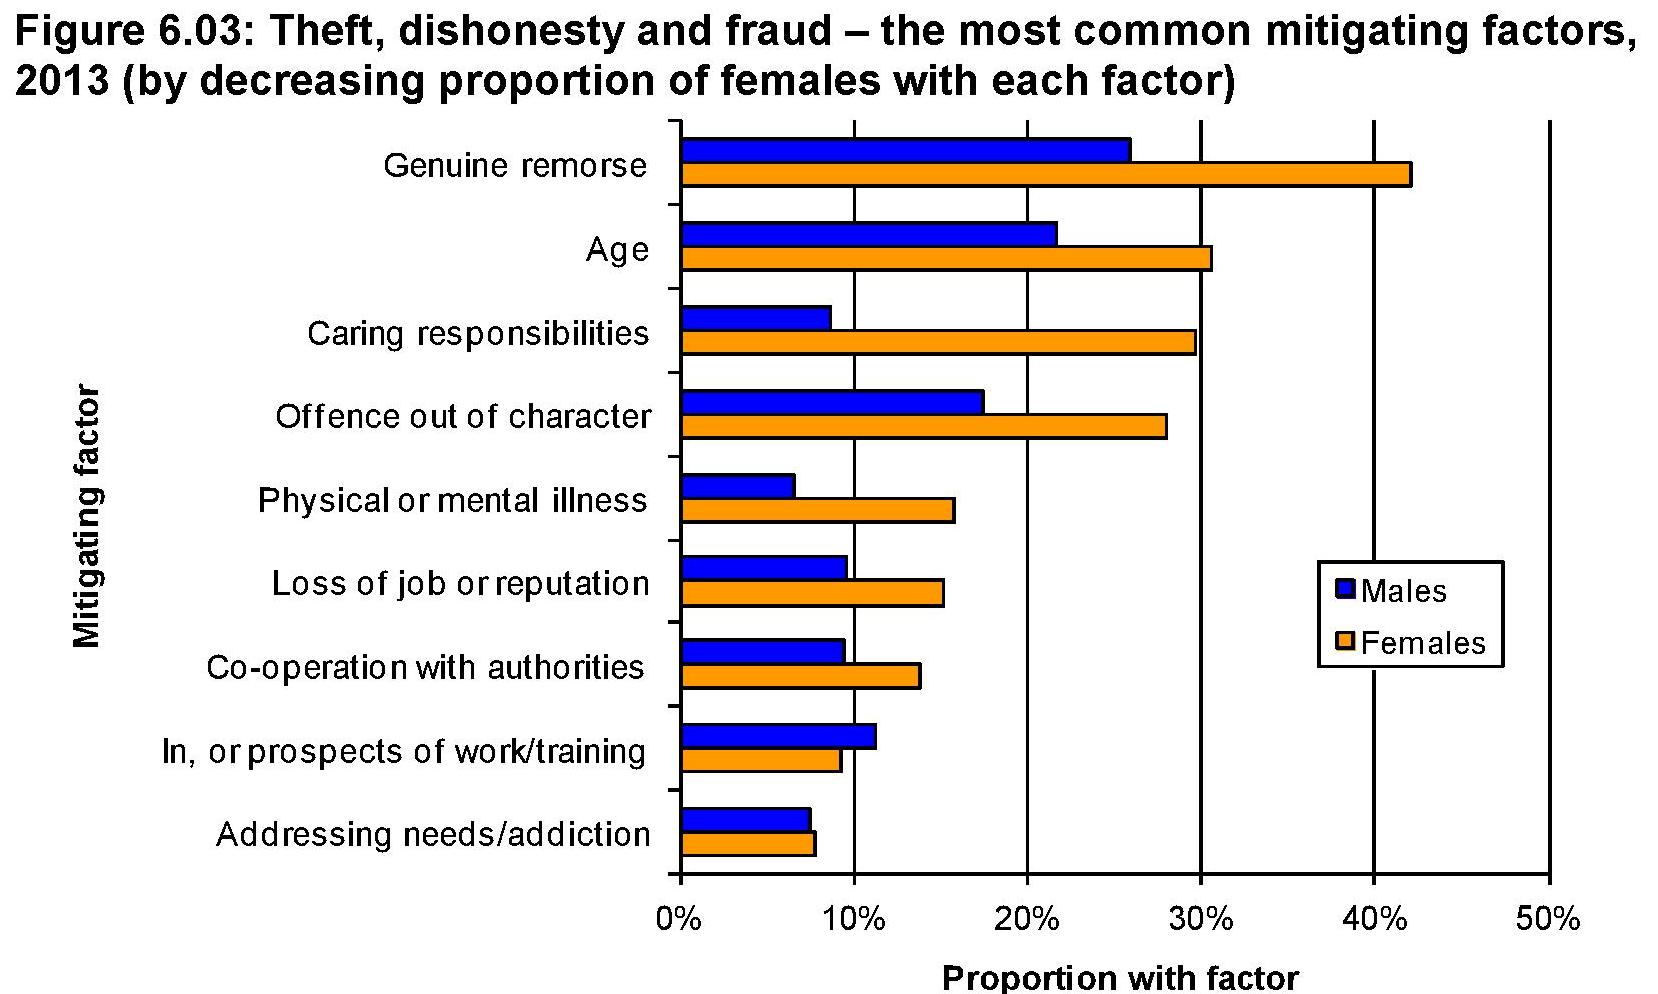 Figure 15: Example Aggravation Factors. Taken from the MOJ report “Statistics on Women and the Criminal Justice System 2013”
6. Lightowlers 2018
Finally I turn to the paper by Lightowlers which prompted me to look at these data again. The title of the paper “Drunk and Doubly Deviant? The Role of Gender and Intoxication in Sentencing Assault Offences” is slightly misleading as the data does not distinguish between intoxication by alcohol or drugs (not that I’m suggesting it should).
The analysis employs data from the Crown Court Sentencing Survey comprising some 30,861 sentences for assault offences. It is a rich dataset which permits regression analysis to take into account the following set of independent variables,
- Sex of the offender;
- Four age ranges;
- Six VAP offence sub-categories (as Figure 13), one of which (“other” VAP offences) acts as the reference category;
- Guilty plea;
- Four options for previous convictions;
- 18 different aggravating factors (including alcohol or drug consumption);
- 11 mitigating factors (including being the primary carer for dependent relatives);
6.1 Modelling the Probability of Immediate Custody
The probability of receiving an immediate custodial sentence was modelled using logistic regression, controlling for all the above independent variables (Model 1). A further model (Model 2) included an interaction term between “female” and “intoxicated”. This model was introduced to extract any gender dependence in the aggravation penalty for intoxication (the primary purpose of the paper). A further Model 3 also included interaction terms between intoxication and the five sub-categories of VAP offence.
The paper includes all the regression coefficients and so the probabilities are easily reconstructed. The paper includes specimen results for the case of Model 2 and ABH. The results show that men are more likely to be imprisoned than women, whether both are sober or both are intoxicated (the paper’s Table 5).
My Table 1, below, recalculates the probabilities of immediate custody for all six sub-categories of VAP offence based on Model 2, which includes the female*intoxicated interaction term. Table 1 confirms the paper’s claim that the increase in the probability of incarceration due to intoxication is greater for women than for men. However, this is hardly the most significant finding of the analysis. Table 1 also shows that, whatever the offence and whether intoxication is a feature or not, men are always more like to be imprisoned than women.
This will be the case for Models 1 and 3 also, because it follows simply from the negative sign of the beta coefficient attached to the variable “female”.
This bears further emphasis. The logistic regression analysis has controlled for a large set of mitigation and aggravation factors, it has controlled for previous convictions, it has controlled for age and guilty plea. Most importantly it has controlled for sub-category of VAP offence, i.e., offence severity within the VAP umbrella category. The analysis therefore addresses – at least for VAP offences – the uncertainties that may have remained in readers’ minds about the cause of the disparities in Figures 5-12. The hypothesis that women’s less serious offences might be the cause of these disparities, or that mitigation/aggravation factors might be the cause, has been firmed rejected by this regression analysis. By elimination, gender bias is confirmed as the explanation.
Table 1: Probabilities of immediate custody from logistic regression Model 2
| Offence | Male
sober |
Female
sober |
Male
intoxicated |
Female
intoxicated |
| Common Assault | 0.35 | 0.19 | 0.40 | 0.29 |
| Affray | 0.36 | 0.20 | 0.42 | 0.31 |
| “Other” VAP offences | 0.44 | 0.26 | 0.50 | 0.38 |
| ABH | 0.49 | 0.30 | 0.55 | 0.43 |
| GBH | 0.69 | 0.49 | 0.74 | 0.64 |
| GBH with intent | 0.982 | 0.961 | 0.986 | 0.978 |
6.2 Modelling Sentence Severity
The dataset also contained information on sentencing which Lightowlers has represented as an ordinal variable in the following order of escalating seriousness,
- Non-custodial sentence, including suspended sentence
- Prison, Low severity: less than 12 months;
- Prison, Medium-low severity: between 12 and 18 months;
- Prison, Medium-high severity: between 18 months and 4 years;
- Prison, High severity: over 4 years.
Ordinal regression was used for this (with three different models as for the logistic regression). However, I believe this analysis is seriously flawed.
What should have been done is an analysis of prison sentence length based on the partitioned dataset consisting only of cases where immediate custody was awarded. This would have produced an indication of the sex dependence of sentence length conditional upon immediate custody. However, by including the non-custodial sentences as a “least severe” ordinal, the ordinal regression has been asked to model both the probability of being sentenced to prison and also the probabilities of different sentence lengths.
That this does not work is apparent from the results. Lightowlers’ Model 2 ordinal regression results given in Table 6 (which is actually for “other” VAP offences, though that is not stated) imply that men have a greater probability of being awarded a non-custodial sentence than women. But this result stands in flat contradiction with the logistic regression (e.g., my Table 1, above). This is easily explained. Intoxication aside, the ordinal regression contains a single term for the variable “female”. Being a linear model (ie., the ln(OR) is linear) there is just one beta coefficient to account for being female. If this were positive then all probabilities would be larger for females; if negative, all smaller. But in modelling via ordinal regression and including non-custodial sentences in the ordinal, a conflict arises. It has already been established that women are less likely to be imprisoned, and this requires the beta coefficient to be negative. The model does not then have the capacity to decide independently, based on the sentence length data, whether being female results in longer or shorter sentences.
In other words, if non-custodial sentences are included in the ordinal, the model cannot be taken as linear in the variable “female” without artificially constraining the result, and ordinal logistic regression is thus inappropriate. The problem would have been easily overcome by excluding non-custodial sentences from the ordinal and from the fitted data.
That said, it is likely that the four categories of sentence length would be too crude for accuracy in any case. Discrimination only occurs where being female causes a boundary at 12 months, 18 months or 4 years to be crossed. Differences in sentence length within a given severity category would be invisible in the analysis, and this would be the majority of cases.
7. Conclusion
- Women are proportionally more likely than men to be cautioned rather than prosecuted;
- Women are proportionally more likely than men to be discharged;
- Given prosecution, men are proportionally more likely to be convicted;
- Given conviction, women are proportionally more likely than men to be awarded a community sentence;
- Given conviction, women are proportionally more likely than men to be awarded a suspended sentence;
- Given conviction, men are far more likely to be subject to immediate custody;
- Given a sentence of immediate custody, men receive longer sentences on average than women;
Lightowlers’ analysis, though not designed for this purpose, indicates that gender bias is the cause of men’s greater probability of being imprisoned, rather than mitigations, aggravations, previous convictions, or women’s less serious offending.