
Until 2017 GCSE grades were labelled A*, A, B, C…, with A* as the top grade. This year (2019) all GCSEs have been graded under a new system, from 9 down to 1, with grade 9 as the top grade. (This is most confusing for us old timers who took O Levels which were also graded 1 to 9, but for which the top grade was 1 and grades 7, 8 and 9 were fails).
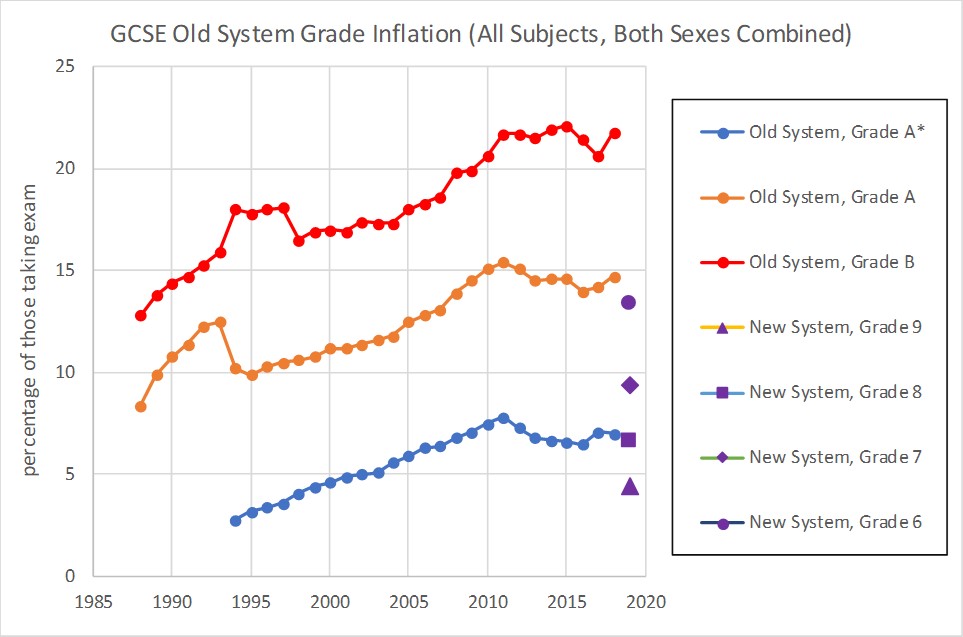
The new top grade 9 is substantially harder to obtain than the old grade A* (which was itself introduced when too many candidates were achieving grade A). The old grade A* aligns more closely with the new grade 8.
In 2018 both the new and the older GCSE grading was used, depending upon location.
Here I summarise the key GCSE results in relation to comparative performance by sex. Data has been taken from Brian Stubbs site. Data for 2019 (new system) relates to England only. Data up to 2018 (old system) relates to the whole UK.
Old System Grade Inflation
The new exam and grading system became necessary, in part, because grade inflation under the old system was preventing discrimination at the upper achievement levels, as illustrated by Figure 1.
2019 Results
The results are presented in Figures 2, below, concentrating on grades 5 to 9. Not every GCSE subject has been plotted, but I believe I’ve captured the major subjects – of which there are 18: Computing, English, English Literature, Geography, History, Music, Physical Education, Biology, Chemistry, Double Science Award, French, German, Spanish, Art & Design, Business Studies, Religious Studies, Maths and Physics.
The histograms of Figures 2 show the proportion of candidates of each sex achieving each of grades 5 to 9. The following Table 1 gives the histogram data in numerical form.
Girls do better, and often emphatically better, in 16 of the 18 subjects. Boys do better only in maths and physics – and even then only at grades 8 and 9.
In the 16 subjects where girls do better, they do better at grades 7, 8 and 9 – and in all but two cases also better at grade 6.
Girls do better in Biology and in Chemistry and in the combined Science Double Award. This should surprise no one because girls have been dominant as university undergraduates in the pure sciences for many years. Nevertheless it probably will surprise some people – including those Ministers who write policy documents stating that we need to redress girls’ disadvantage in the sciences.
Girls do better in Business Studies and Religious Studies and Music and History and Geography. And, of course, girls do better in English and foreign languages and Art & Design.
Girls even do better in Computing (although they account for only 22% of the candidates).
Girls also do substantially better in Physical Education. Initially surprising, my guess is that this is because PE actually has a substantial written component. I do wonder whether boys’ underperformance at GCSE is caused entirely by just one male weakness: writing.
Across all GCSE subjects, girls do better than boys at all of grades 5, 6, 7, 8 and 9 individually.
Shadow education secretary Angela Rayner reminds us that disadvantaged pupils are much more likely to do badly in their GCSEs. As boys consistently do less well than girls, you may be tempted to suppose there is some aspect of male disadvantage at work. But that’s a conclusion that our entire political class steadfastly refuses to acknowledge. If males fail, it’s their own fault. It’s always their own fault because the ancient presumption of the agentic male prevents any other conception.
At Michaela Community Free School, the school headed by Katharine Birbalsingh with an intake which is overwhelmingly non-white, 18% of the pupils’ exams achieved grade 9, compared with the national average of 4.5%. Obtaining four times the average proportion of top grades is a stunning result and proves that it is the teaching and the teaching ethos which is holding back most pupils in the UK.
Figures 2
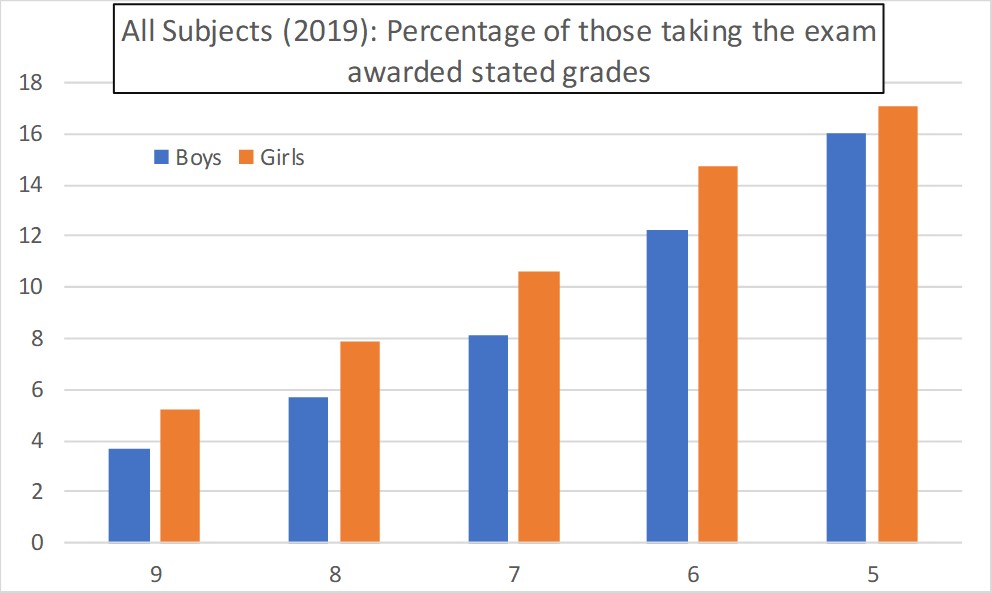
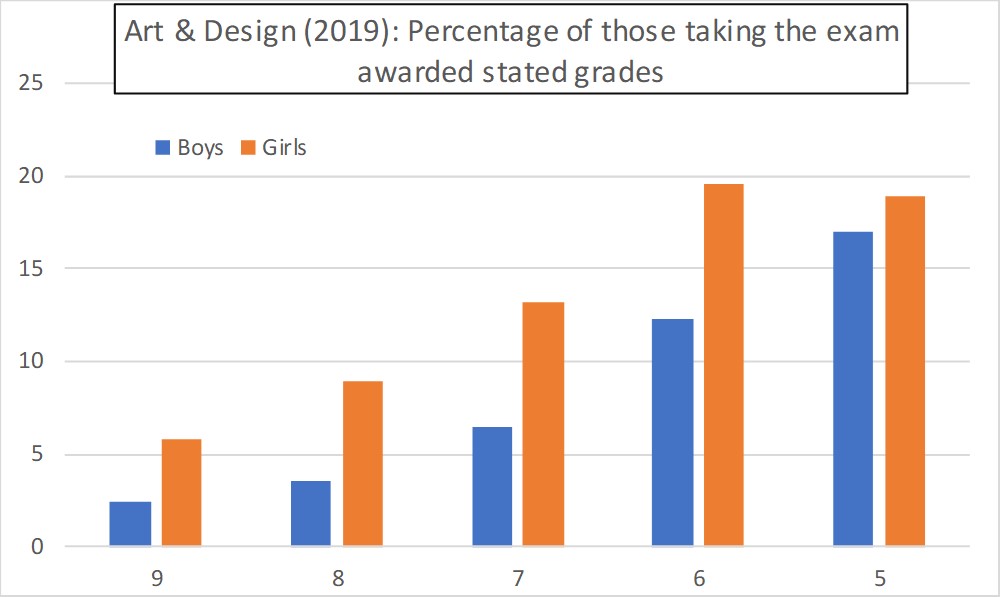
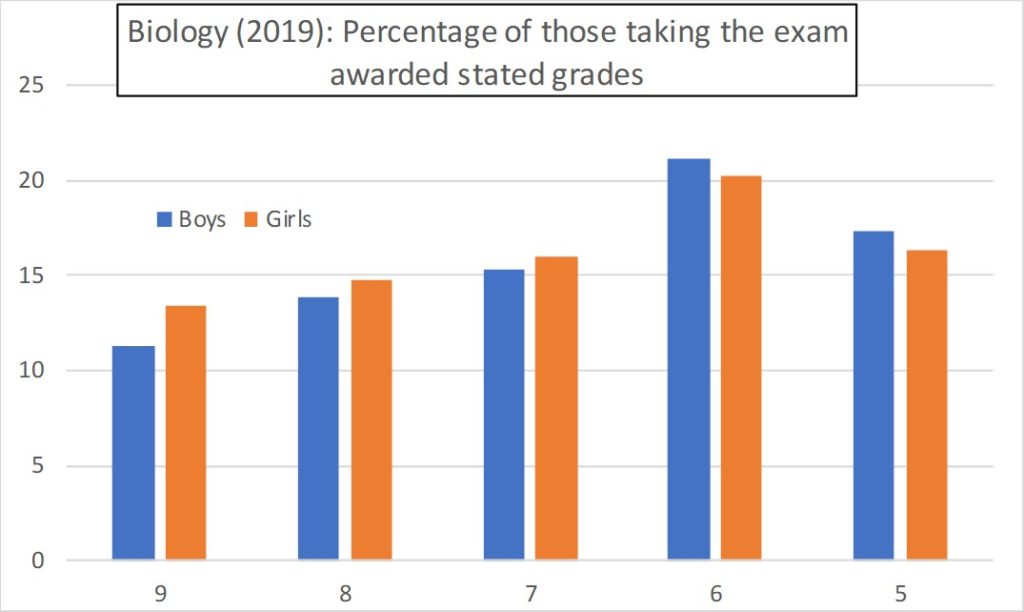
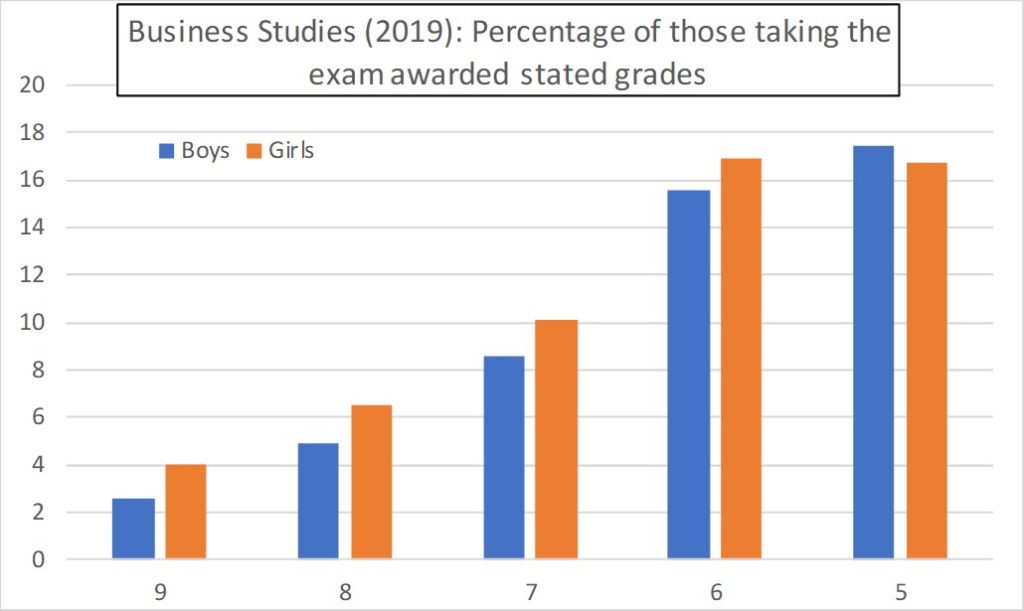
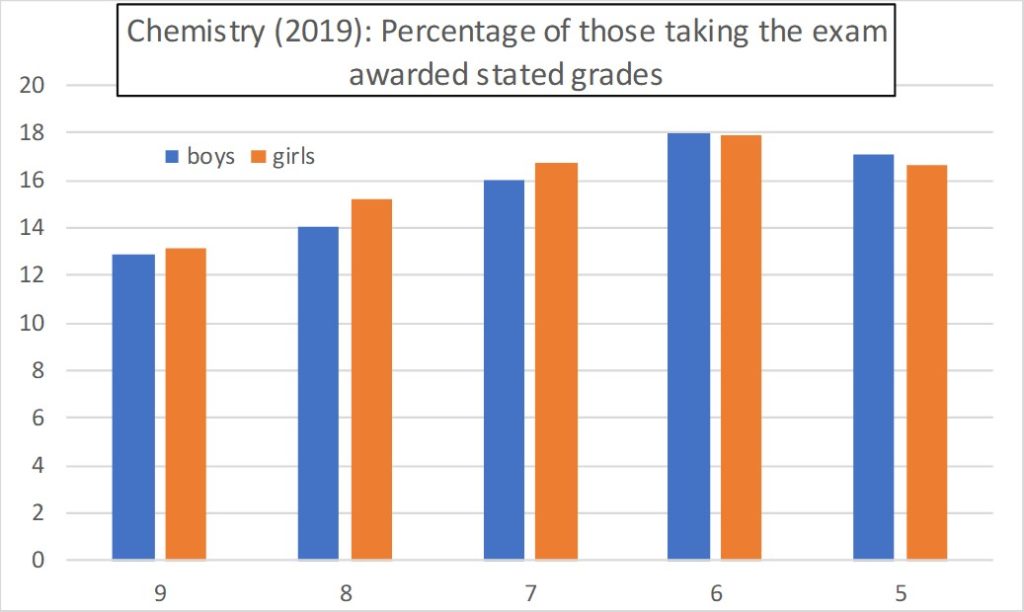
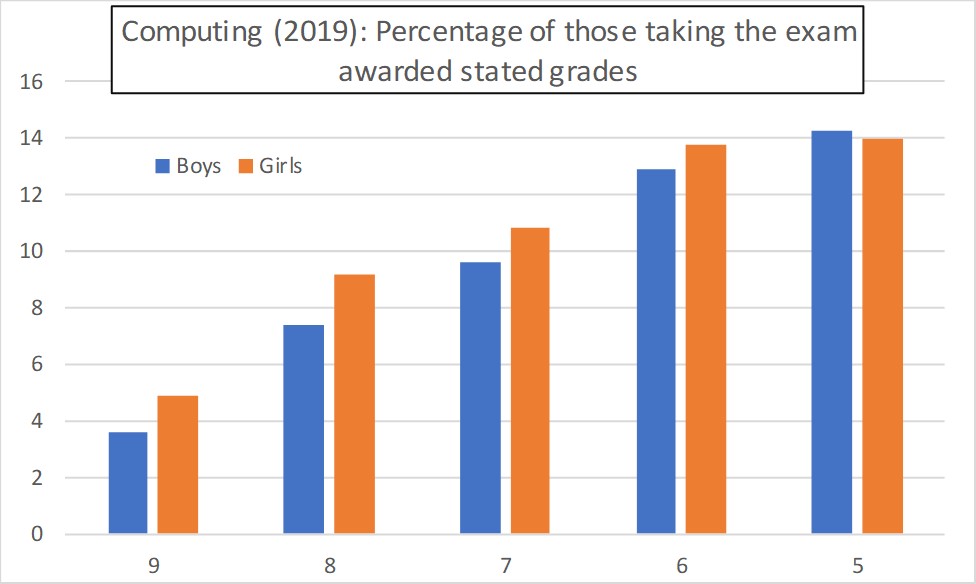
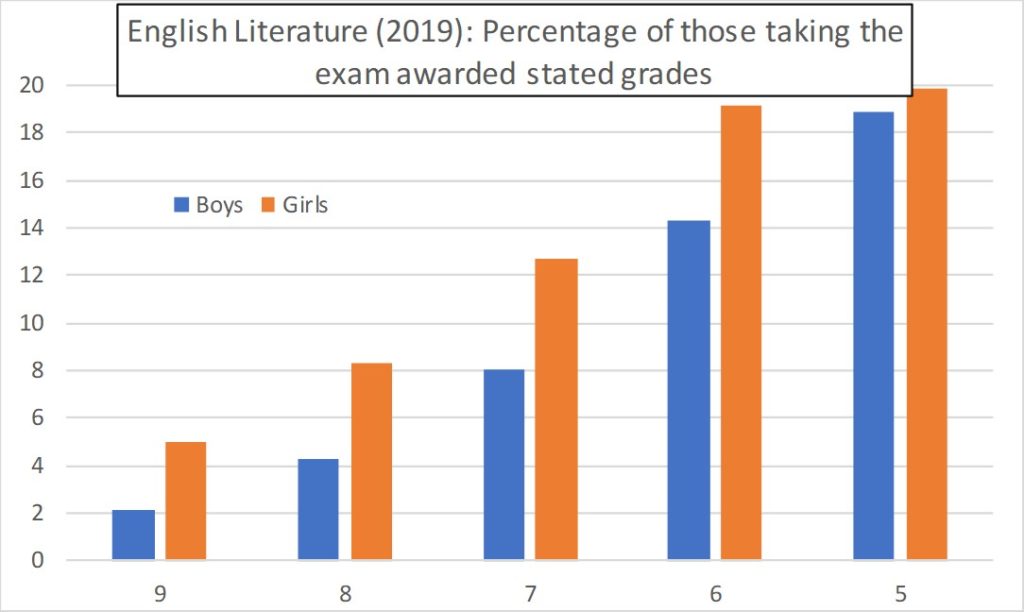
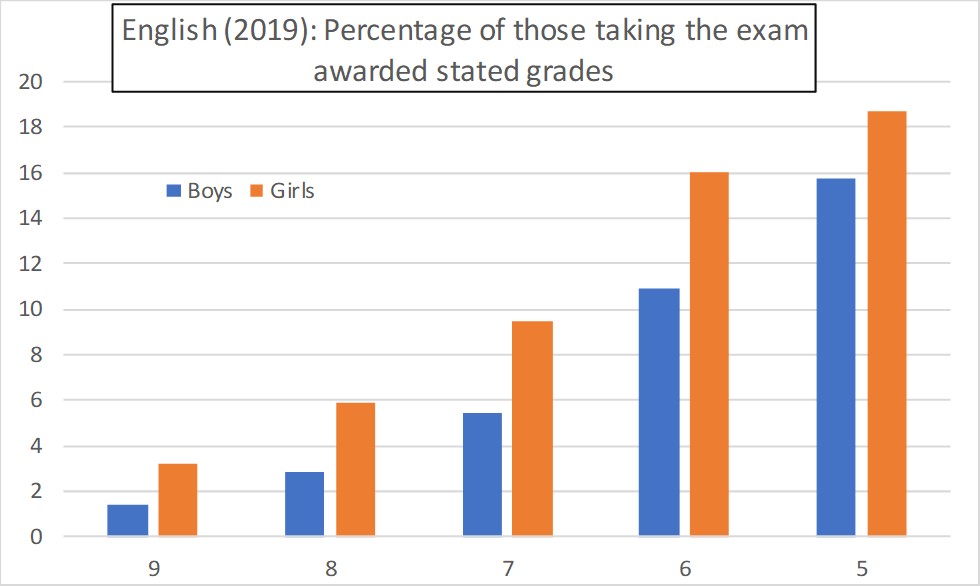
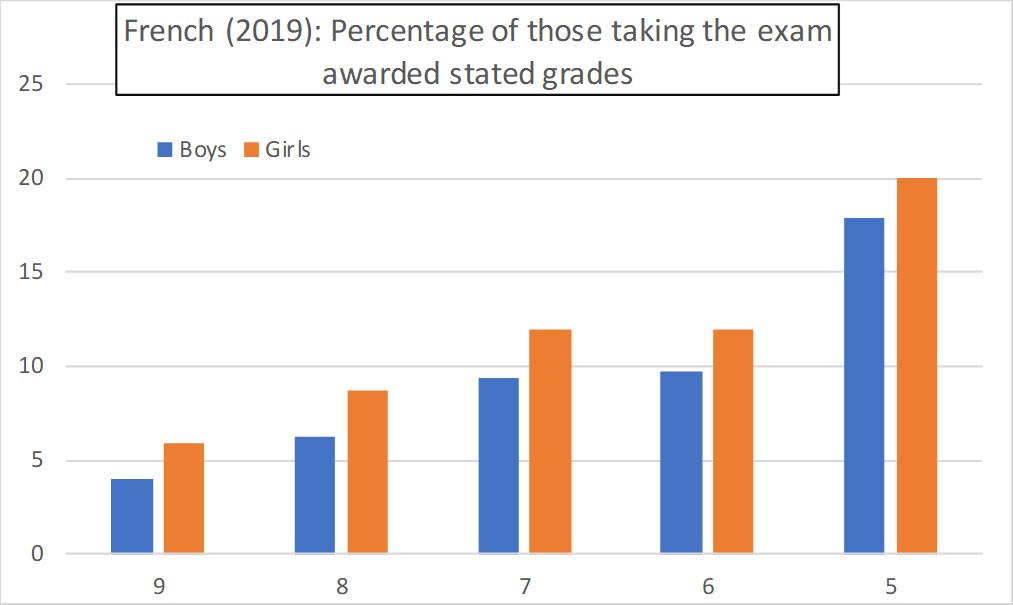
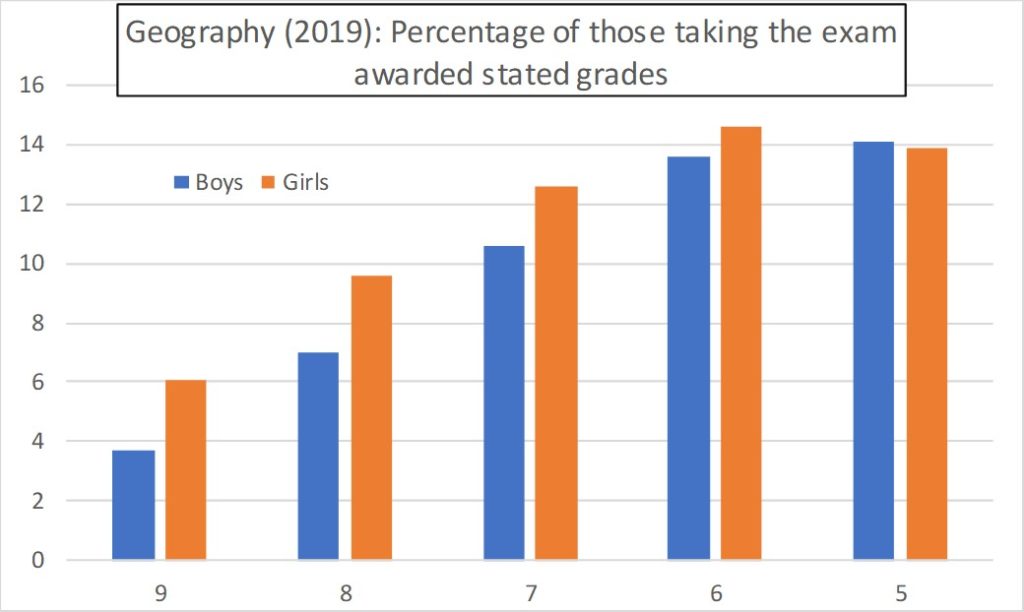
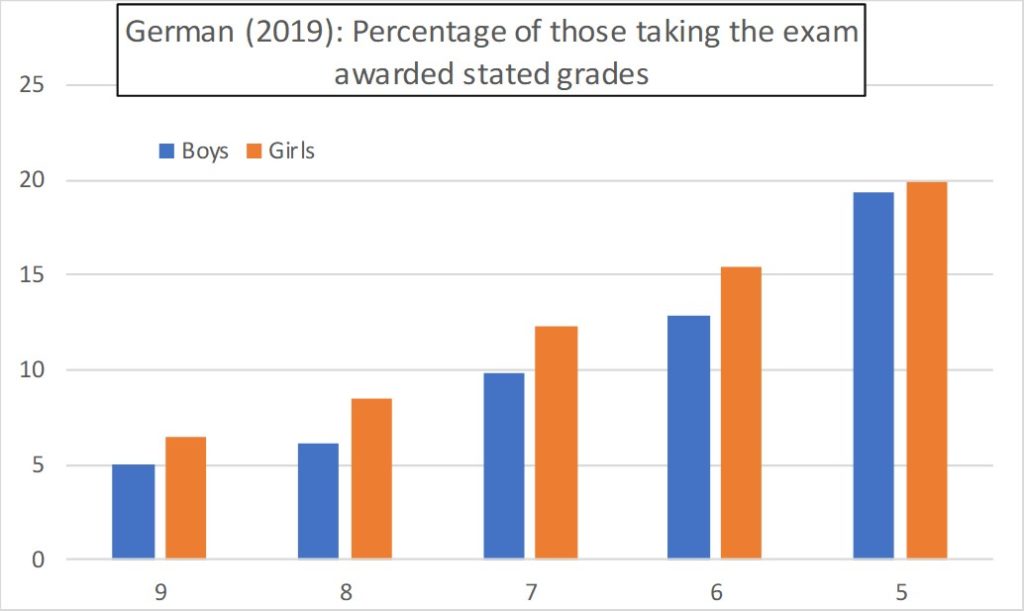
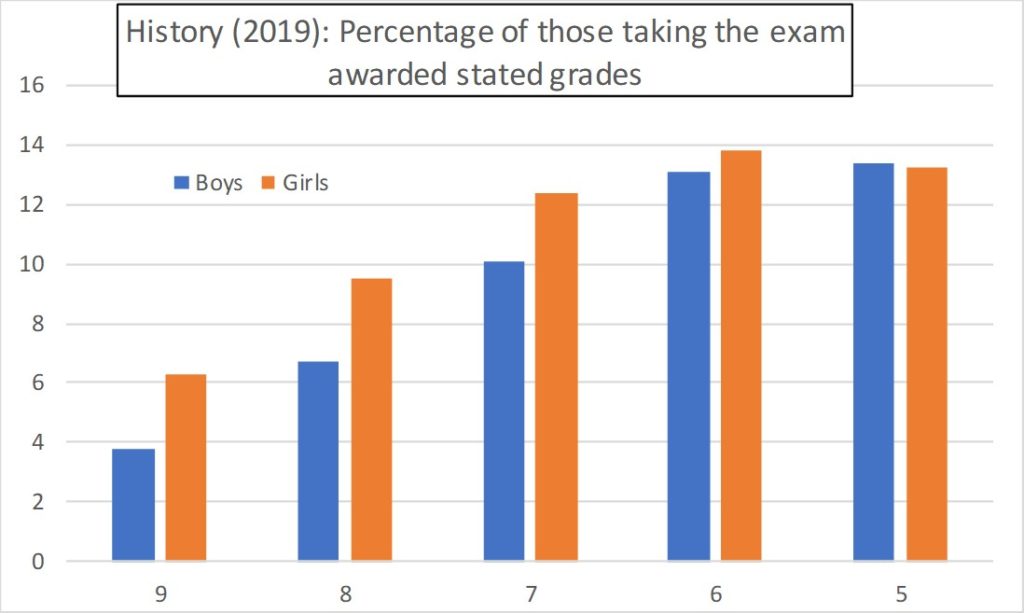
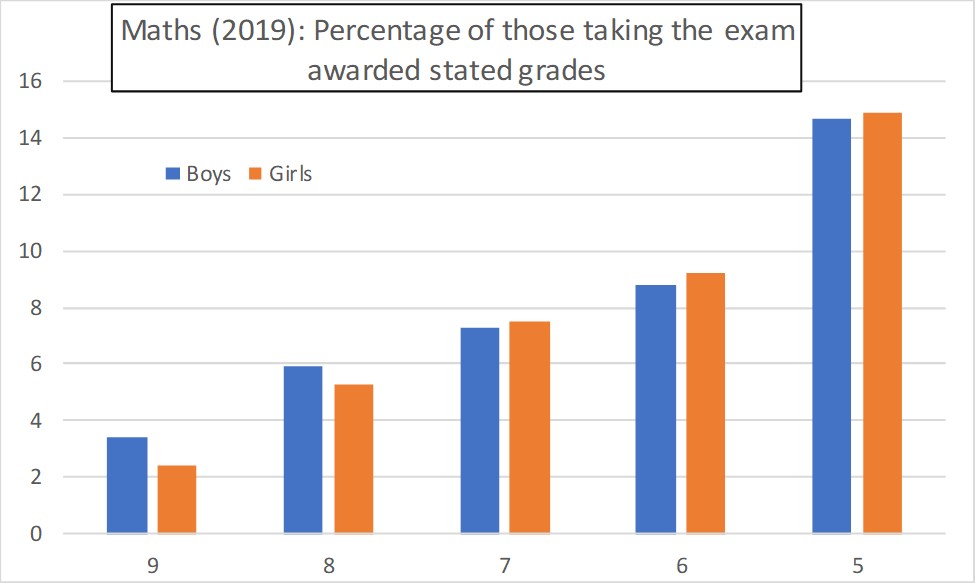
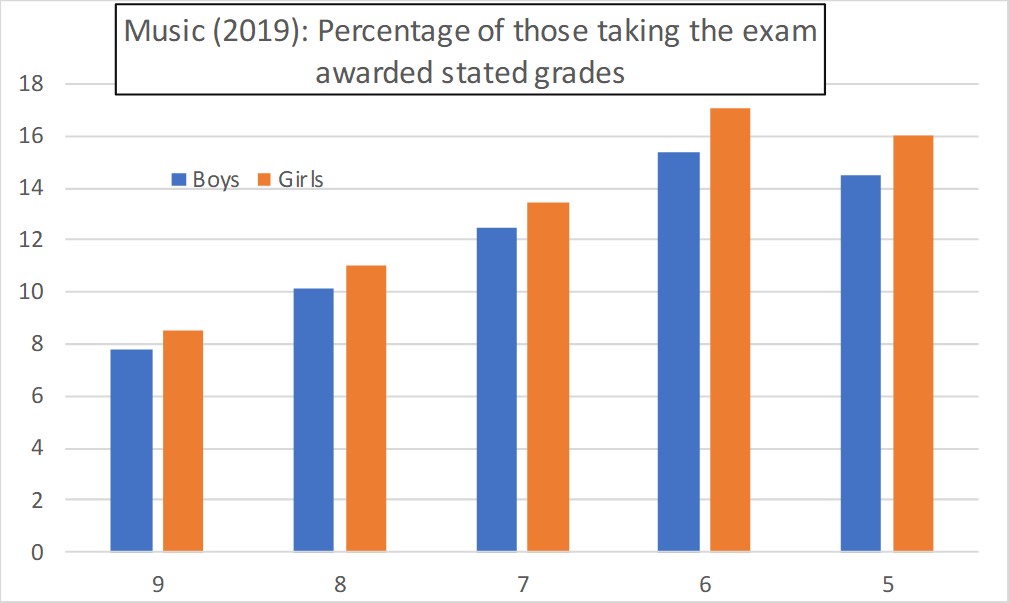
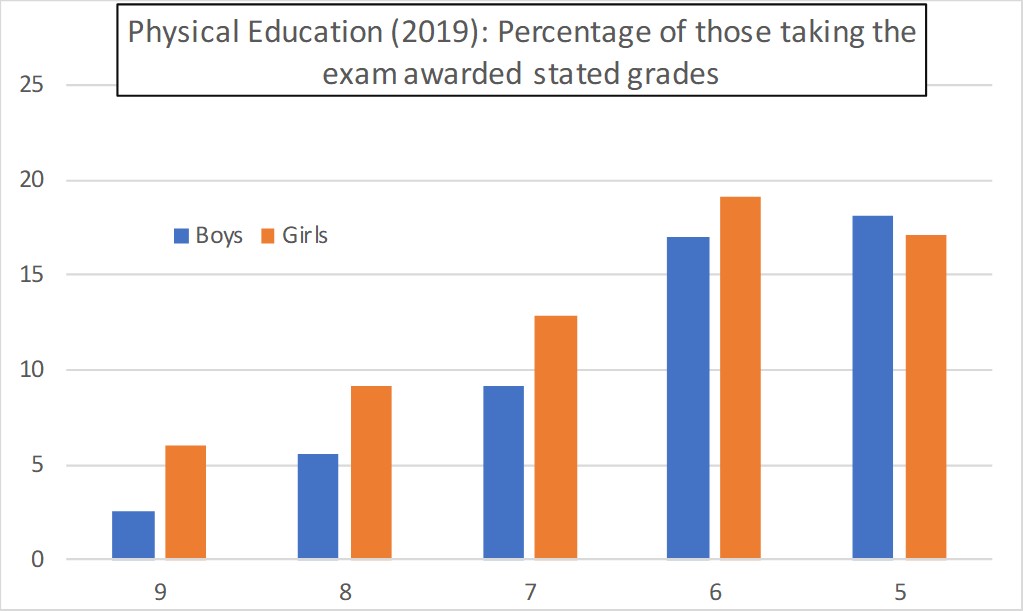
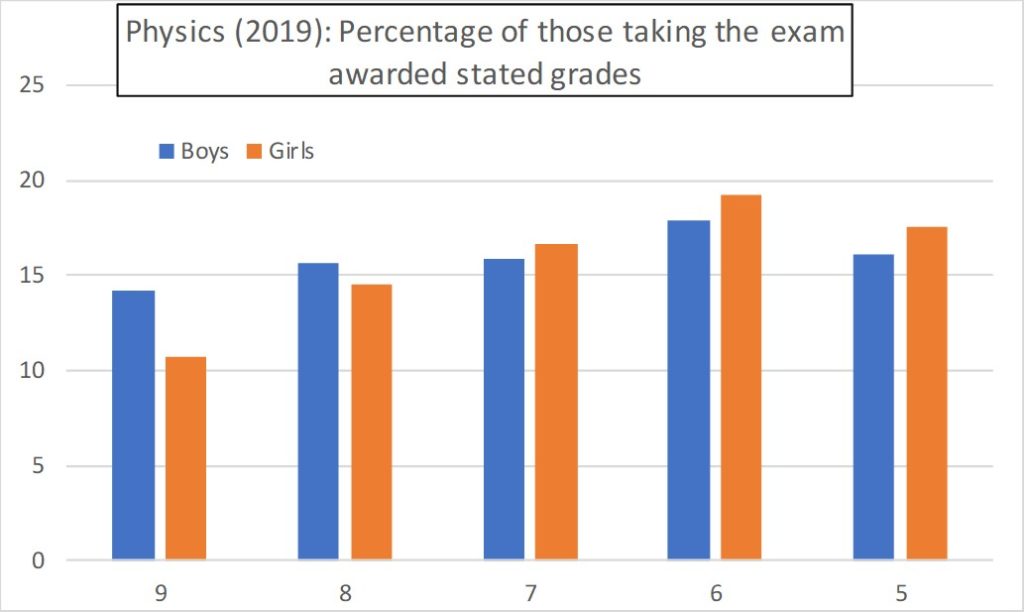
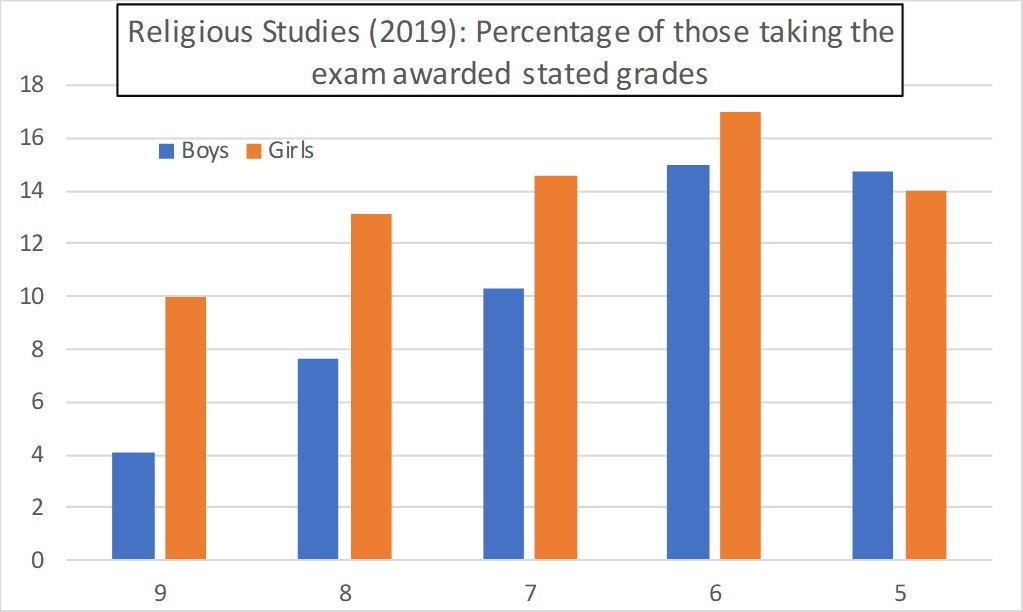
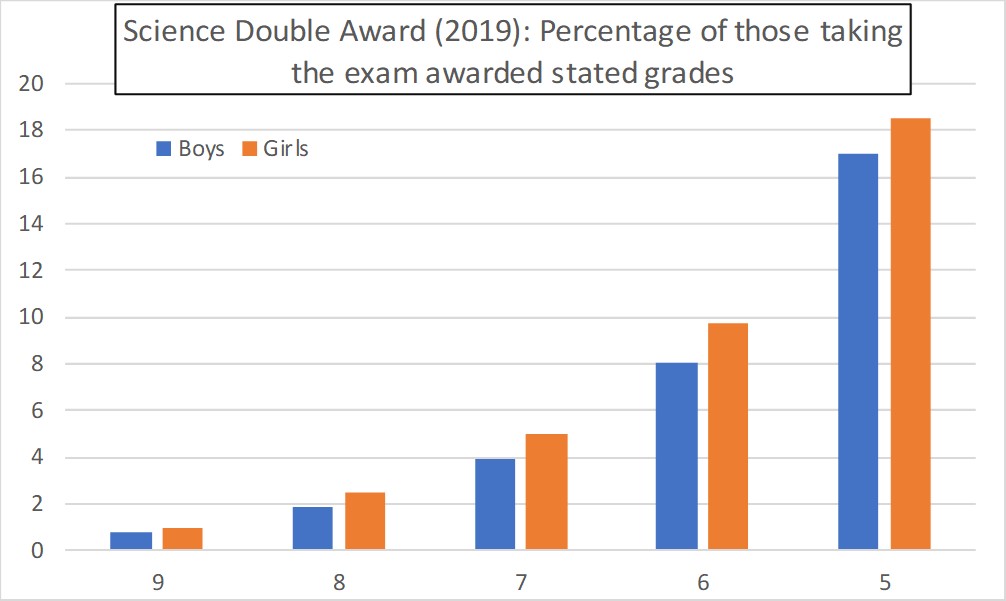
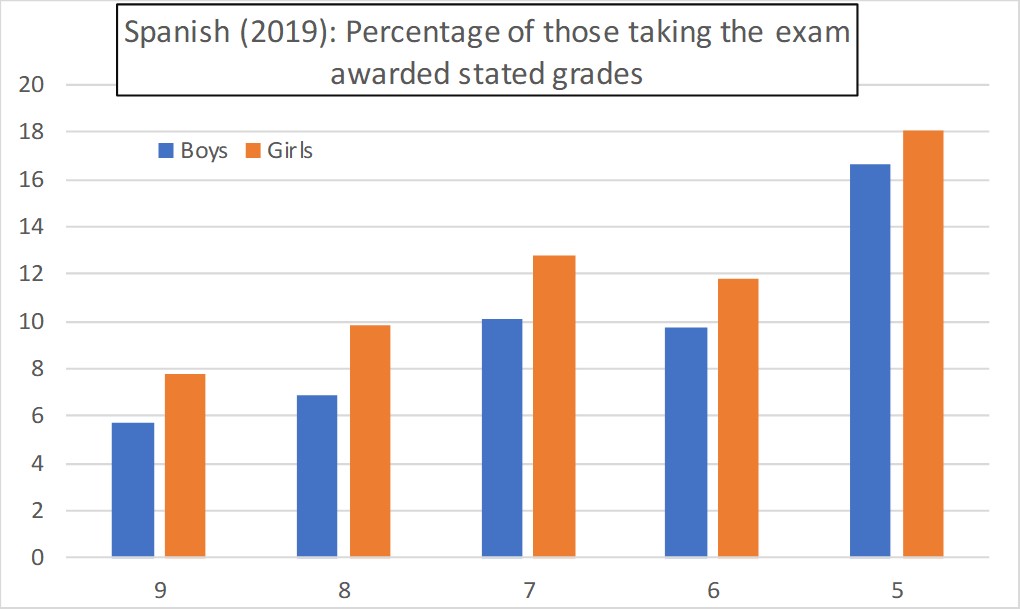
Table 1
| grade | 9 | 8 | 7 | 6 | 5 |
| Computing | |||||
| boys | 3.6 | 7.4 | 9.6 | 12.9 | 14.3 |
| girls | 4.9 | 9.2 | 10.8 | 13.8 | 14 |
| English | |||||
| boys | 1.4 | 2.8 | 5.4 | 10.9 | 15.7 |
| girls | 3.2 | 5.9 | 9.5 | 16 | 18.7 |
| English Literature | |||||
| boys | 2.1 | 4.3 | 8 | 14.3 | 18.9 |
| girls | 5 | 8.3 | 12.7 | 19.1 | 19.9 |
| Geography | |||||
| boys | 3.7 | 7 | 10.6 | 13.6 | 14.1 |
| girls | 6.1 | 9.6 | 12.6 | 14.6 | 13.9 |
| History | |||||
| boys | 3.8 | 6.7 | 10.1 | 13.1 | 13.4 |
| girls | 6.3 | 9.5 | 12.4 | 13.8 | 13.2 |
| Music | |||||
| boys | 7.8 | 10.1 | 12.5 | 15.4 | 14.5 |
| girls | 8.5 | 11 | 13.4 | 17.1 | 16 |
| Physical Education | |||||
| boys | 2.5 | 5.6 | 9.1 | 17 | 18.1 |
| girls | 6 | 9.2 | 12.8 | 19.1 | 17.1 |
| Biology | |||||
| boys | 11.3 | 13.8 | 15.3 | 21.1 | 17.3 |
| girls | 13.4 | 14.8 | 16 | 20.2 | 16.3 |
| Chemistry | |||||
| boys | 12.9 | 14 | 16 | 18 | 17.1 |
| girls | 13.1 | 15.2 | 16.7 | 17.9 | 16.6 |
| Science Double Award | |||||
| boys | 0.8 | 1.9 | 3.9 | 8 | 17 |
| girls | 1 | 2.5 | 5 | 9.7 | 18.5 |
| French | |||||
| boys | 4 | 6.2 | 9.4 | 9.7 | 17.9 |
| girls | 5.9 | 8.7 | 12 | 11.9 | 20 |
| German | |||||
| boys | 5 | 6.1 | 9.8 | 12.8 | 19.3 |
| girls | 6.5 | 8.5 | 12.3 | 15.4 | 19.9 |
| Religious Studies | |||||
| boys | 4.1 | 7.6 | 10.3 | 15 | 14.7 |
| girls | 10 | 13.1 | 14.6 | 17 | 14 |
| Spanish | |||||
| boys | 5.7 | 6.9 | 10.1 | 9.7 | 16.6 |
| girls | 7.8 | 9.8 | 12.8 | 11.8 | 18.1 |
| Art and Design | |||||
| boys | 2.4 | 3.6 | 6.5 | 12.3 | 17 |
| girls | 5.8 | 8.9 | 13.2 | 19.6 | 18.9 |
| Business Studies | |||||
| boys | 2.6 | 4.9 | 8.6 | 15.6 | 17.4 |
| girls | 4 | 6.5 | 10.1 | 16.9 | 16.7 |
| Maths | |||||
| boys | 3.4 | 5.9 | 7.3 | 8.8 | 14.7 |
| girls | 2.4 | 5.3 | 7.5 | 9.2 | 14.9 |
| Physics | |||||
| boys | 14.2 | 15.6 | 15.9 | 17.9 | 16.1 |
| girls | 10.7 | 14.5 | 16.6 | 19.2 | 17.6 |
| All Subjects | |||||
| boys | 3.7 | 5.7 | 8.1 | 12.2 | 16 |
| girls | 5.2 | 7.9 | 10.6 | 14.7 | 17.1 |
o