This is an unusual year for A Levels because the exams have not actually been taken. Instead grades have been awarded based on teachers’ assessments, possibly taking mocks into account, and possibly with wholesale “adjustment”. However, it is not my purpose here to describe that process. I merely give the results which have been published.
I was particularly keen to look at the sex differentials this year because basing grades on teachers’ assessments might be expected to increase girls dominance even further than normal. Broadly, this does indeed turn out to be the case. Data has been taken from Brian Stubbs’ site, “Student Performance Analysis”.
I have looked only at the total of subjects. If anyone is desperate to see the results for specific subjects, these data are available and I can run off a few extra graphs on request – but not all the graphs below disaggregated by all subjects or I’ll be slaving over this hot laptop for weeks.
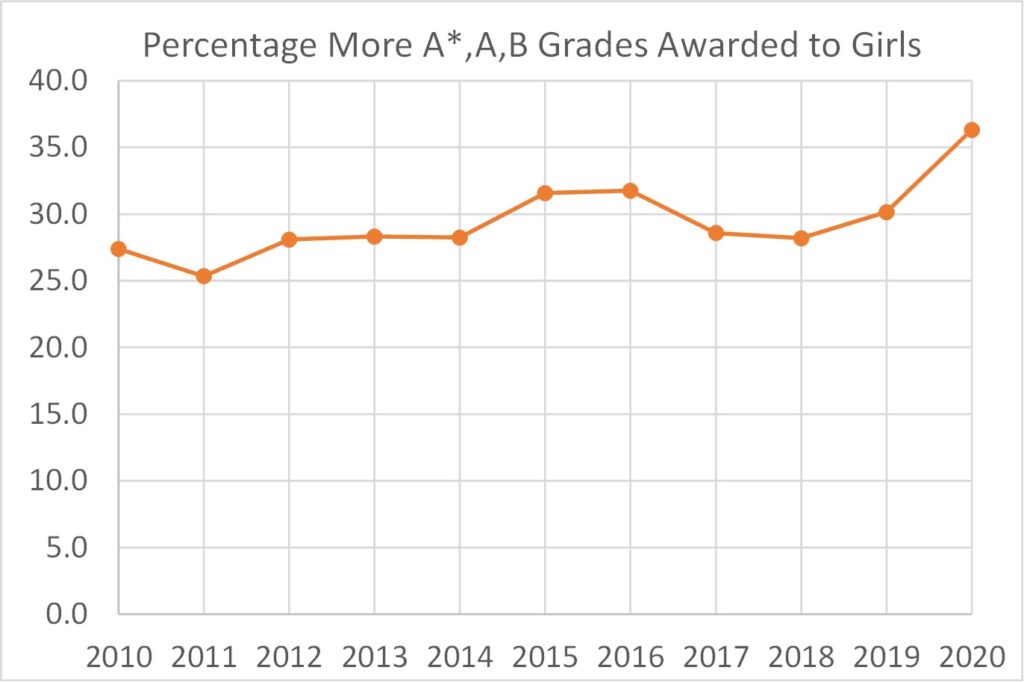
Figure 1, which heads this post, tells the main story: As regards the top grades (A*,A and B), girls have been awarded between 25% and 32% more over the last ten years (since the A* grade was introduced in 2010). This year, based on examless assessments, this has increased to an all-time high of 36.3%.
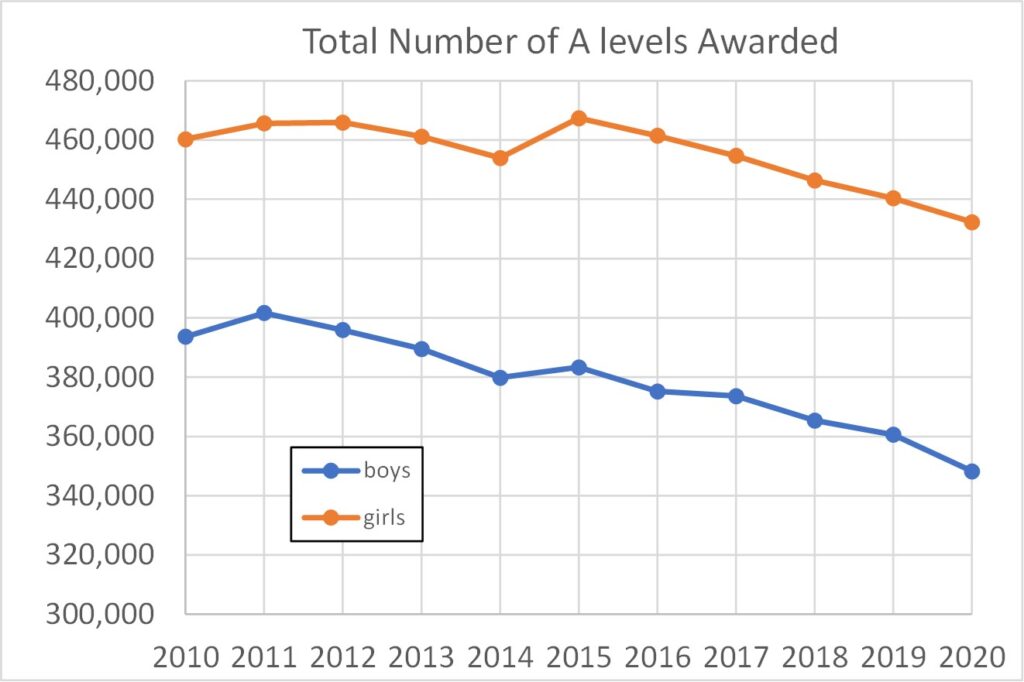
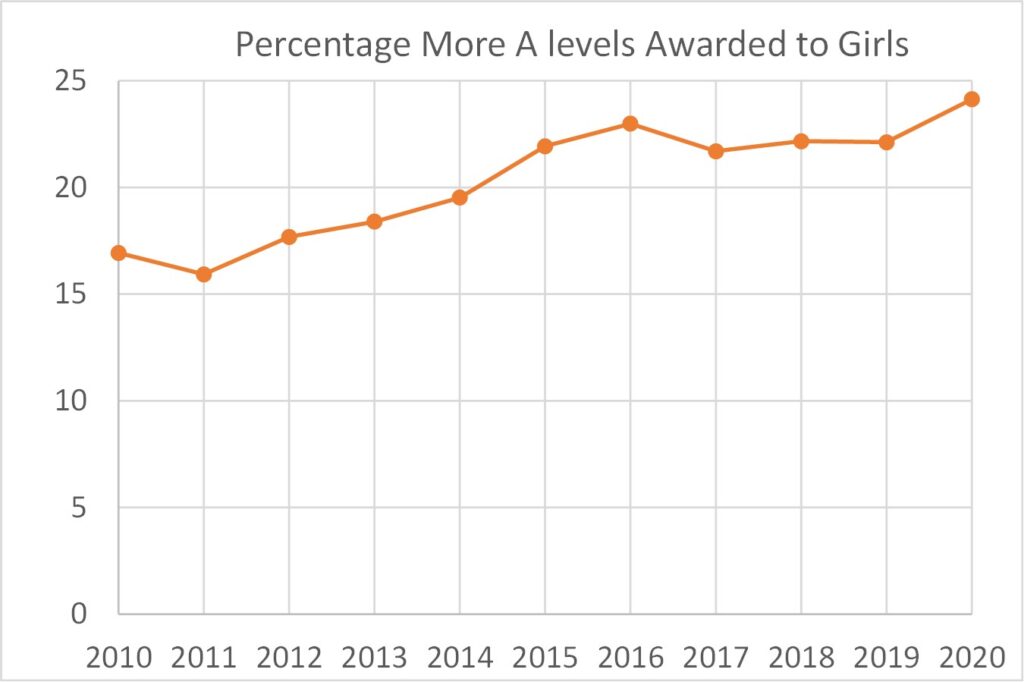
The number of A Levels awarded (all grades) has been falling for both sexes for a number of years (Figure 2), but the percentage awarded to girls has been climbing steadily (Figure 3) and continued to do so in this examless year, reaching an all-time high of 24% across all grades.
The percentages of applicants of each sex being awarded grades A* to C in 2020 are given in Table 1, and the actual numbers of such grades awarded in Table 2. Boys dominate only in the percentage awarded the top A* grade. There are substantially larger absolute numbers of girls attaining all grades, and also a larger percentage of girls at grades A, B and C.
| sex | percent | |||
| A* | A | B | C | |
| boys | 9.3 | 18 | 24.2 | 23.9 |
| girls | 8.8 | 19.6 | 28.2 | 24.3 |
| sex | percent | |||
| A* | A | B | C | |
| boys | 32,389 | 62,688 | 84,281 | 83,236 |
| girls | 37,861 | 84,837 | 121,786 | 104,878 |
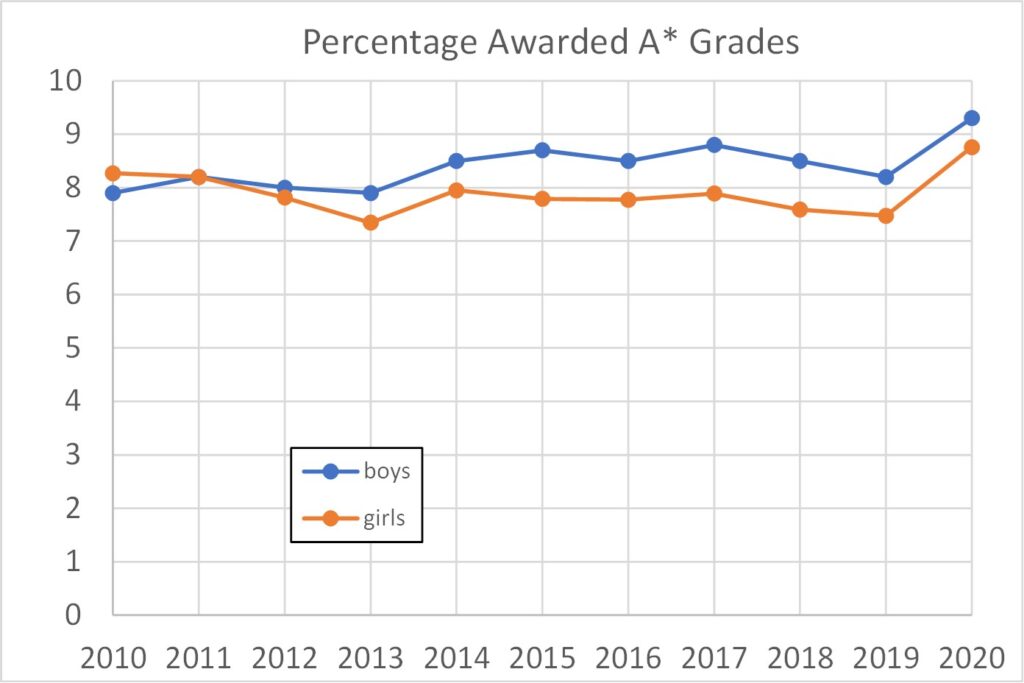
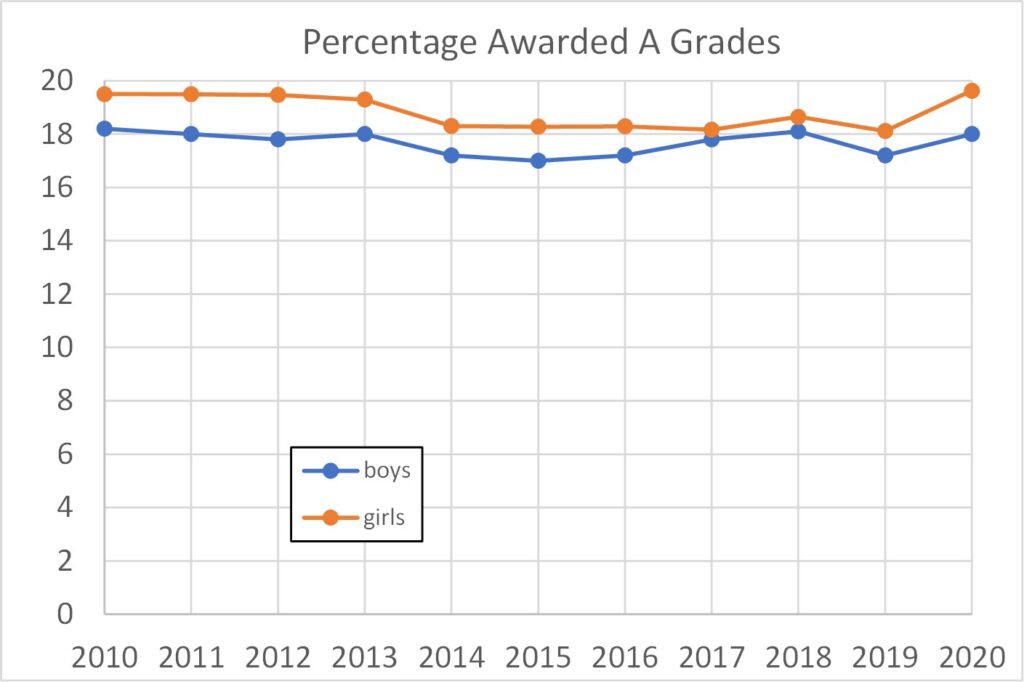
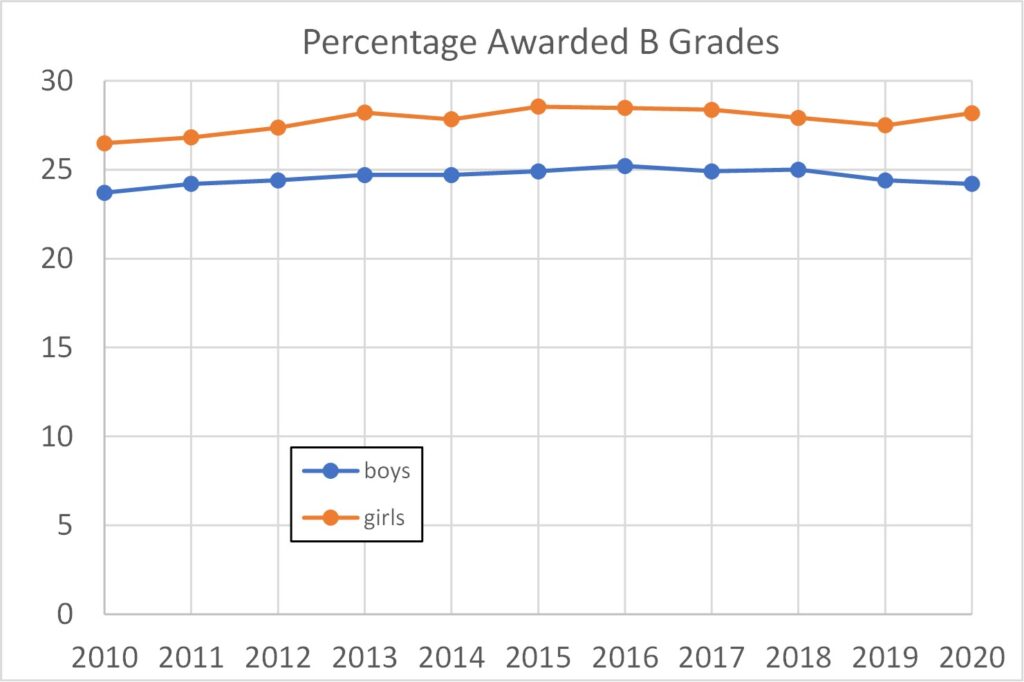
The percentage of each sex awarded grades A*, A and B grades (across all subjects) are plotted against year in Figures 4, 5 and 6. Figure 4 shows a blip upwards this year in the A* percentages for both sexes.
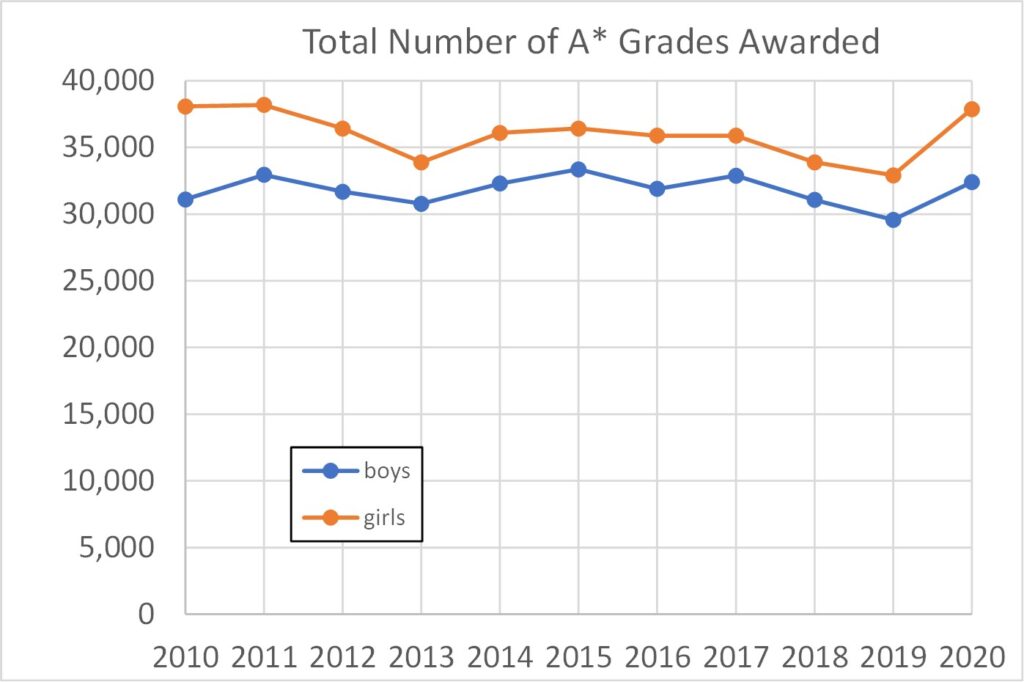
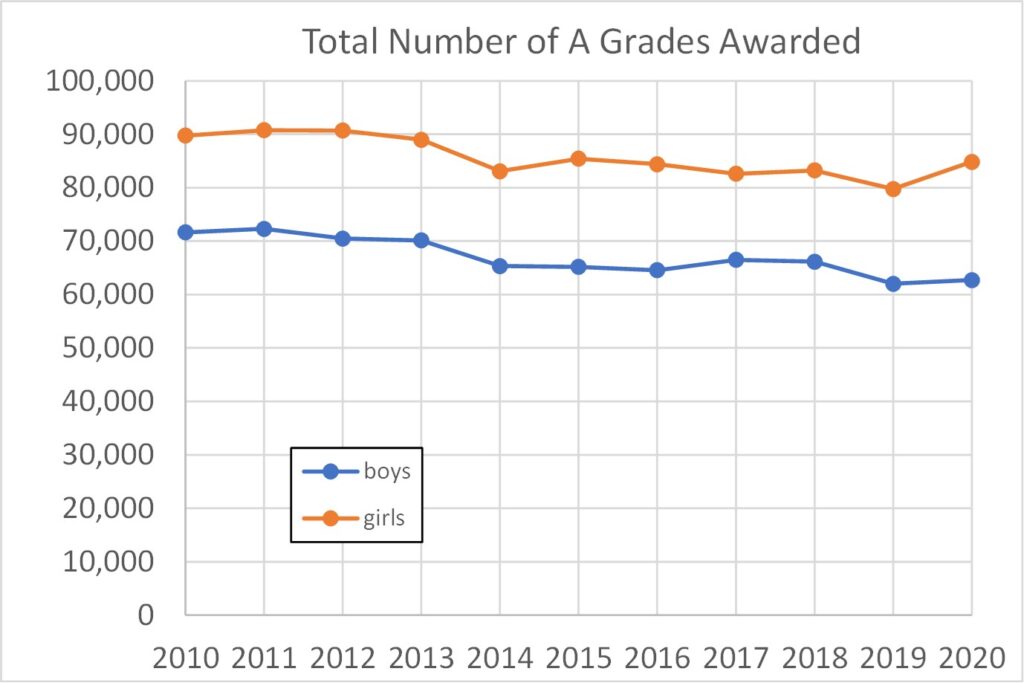
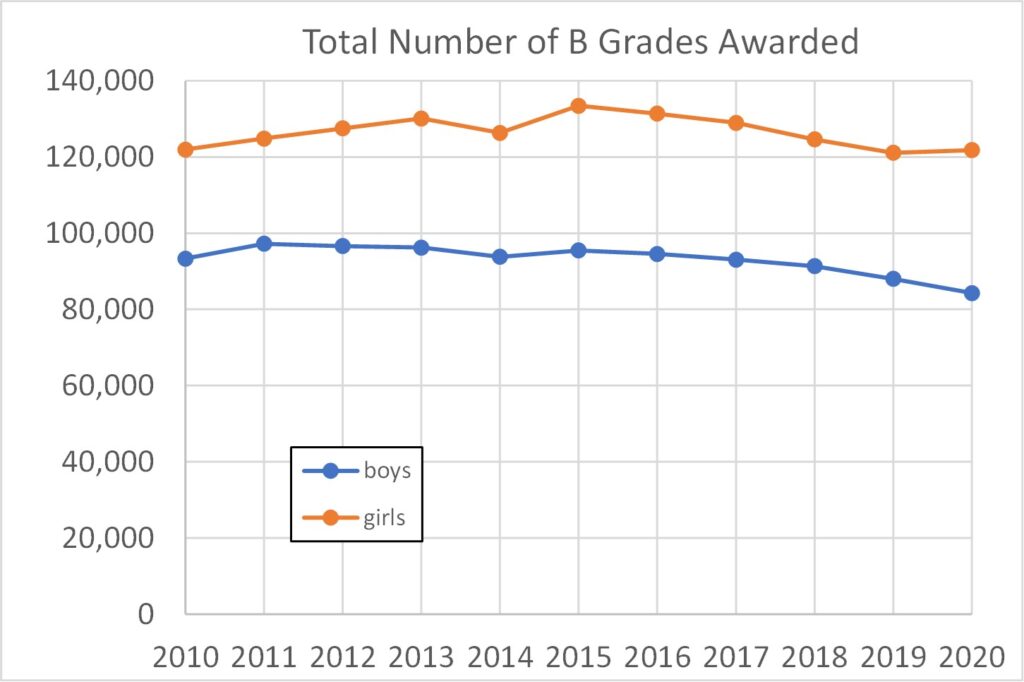
Figures 7, 8 and 9 show the corresponding absolute numbers of grades A*, A and B awarded by sex. Figure 7 also shows an upward blip this year for the A* grade, but more so for girls than boys. Figure 8 for A grades shows a slight upward blip for girls, but not boys. Figure 9 for grade B shows a continuing downward trend for boys this year, but not for girls.
In summary, girls aiming for the better A Level grades have nothing to complain about in this strange examless year. Statistically speaking, girls have done well out of the teachers’ assessment means of assigning grades. This was entirely predictable, of course, as teachers’ assessments are known to favour girls in other contexts (see here and here and here, for example, or The Empathy Gap book – I see Amazon have reduced their price).
We can anticipate that the sex-ratio for university entry will be another record high for girls this year. Data on this is usually released by UCAS in December.